Смотри обучающее видео по маркету на YouTube
Как купить торгового робота или индикатор
Запусти робота на
виртуальном хостинге
виртуальном хостинге
Протестируй индикатор/робота перед покупкой
Хочешь зарабатывать в Маркете?
Как подать продукт, чтобы его покупали
Бесплатные технические индикаторы для MetaTrader 5 - 6

Auto Fibo Expansion is an indicator that projects the Fibonacci expansion levels above and below the opening price of the day. It does the calculation based on the previous day and projects the levels on the current day. It is very efficient to find "psychological" zones of support and resistance. Its appearance is all configurable and you can set up to 30 different levels. Enjoy! This is a free indicator, but it took hours to develop. If you want to pay me a coffee, I appreciate a lot <3 PayP
FREE
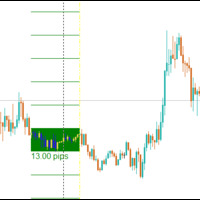
The Central Bank Dealers Range (CBDR) is a key ICT concept, used to project potential highs and lows for the day based on market conditions during a specific time window. The CBDR is utilized to forecast price movements in both bullish and bearish market conditions. By identifying this range, traders can better anticipate the price levels that may form as the day progresses.
CBDR and Standard Deviation A key feature of the CBDR is its application of standard deviation , a statistical measure u
FREE

CPR Pivot Lines It Will Draw Pivot Point R1,R2,R3 S1,S2,S3 Tc Bc Best Part Is That You Can Even Add Values Of High,Low,Close Manually Also To Get Your All Levels On Chart.So If Your Broker Data Of High ,Low ,Close Is Incorrect Then You Don’t Have To Depend On Them Anymore. You Can Even Modify All Lines Style. It Will Show Line In Floting Style And Not Continues Mess.
FREE
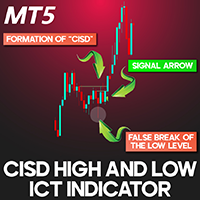
CISD - CSD + High & Low ICT Indicator in MetaTrader 5 The CISD – CSD + High and Low Indicator is a powerful tool that plots key High and Low-price levels while highlighting CISD formations on the chart. Designed based on the ICT trading strategy , this MT5 indicator helps identify false breakouts at major price levels and marks CISD occurrences with arrows to signal trade opportunities. CISD + High/Low Indicator Features Below is a breakdown of the CISD - CSD + High and Low Indicator specifica
FREE
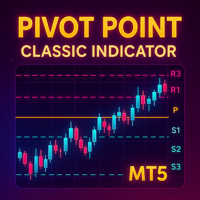
Detailed Description: The Pivot Point Classic Indicator is designed for traders who rely on classic pivot points and midpoints levels for their trading strategies. By automatically calculating and plotting these levels, the indicator provides a clear, visual representation of critical price areas where the market may reverse or break out. Key Features: Automatic Pivot Point Calculations : Automatically calculates pivot points, three support (S1, S2, S3) and resistance (R1, R2, R3) levels bas
FREE
Indicator Description Range Filter Pro is a sophisticated trading tool for XAUUSD (Gold) that combines adaptive price filtering with volume analysis and real-time market monitoring. Designed for both novice and professional traders, this indicator helps identify trend direction, potential reversals, and significant market movements through its multi-layered approach.
Key Components 1.Dynamic Range Filter 2.Volatility-Adjusted Bands 3.Volume-Enhanced Candles 4.Professional Trading Dashboard 5.M
FREE

Presentation
Another indicator that makes scalping on tick charts easier, it displays an Heiken Ashi graph in Ticks.
It allows to detect entry points and trend reversals. Recommended number of ticks in a candle : 5, 13 or 21.
Parameters Ticks in candle: Number of ticks in a candle (default 5), Displays Trend arrows : displays a trend arrow based on EMA8 and EMA20 crossing, Displays MM50, Displays MM100, Max Candle (CPU): number of candles max to manage, low value will save ressources of your
FREE

BREAKOUT-SESSION-BOX LONDON EU US ASIA Open
watch the expectation of a volatile movement above or under the opening range We take the high of the range as Entry for a long trade and SL will be the low of the range and vice versa the low of the range as Entry for a short trade and the high for SL The size of the range is the distance to the TP (Take Profit) The range of the opening hours should not be larger than about 1/3 of the average daily range 4 breakout examples are already predefined: A
FREE

Moving Average Trend Alert is a triple MA indicator that helps traders to identify potential market trends based on 3 MAs alignment and crossover.
Moving Average Trend Alert features: Customizable short-term, medium-term, and long-term MAs. Option to filter signals based on a minimum distance between moving averages to avoid premature MAs alignment. Optional Filter of signals with RSI indicator overbought/oversold levels. Optional Filter of signals with ADX indicator. Popup, email, and phone no
FREE

Show Pip Value and Spread on Chart as Object or Comment. User can select to display Pip Value and/or Spread by object on main Chart, or show both only as Comment lines on chart. Object Color, Font face and Size and also which corner to show, may change by user. Pip Value calculated in accordance of input Lot size , Default is 1 lot . Can use at all currency pairs , Gold , Silver and most other charts.
FREE

The POC_Levels indicator calculates and displays the 3 most frequently occurring price levels (Points of Control – POC) based on historical candles. It is useful for identifying areas of high market interest (like support/resistance zones) across any timeframe. How It Works
The indicator analyzes the last LookbackBars candles. It counts how many times each price level (based on the selected price type) appears. Then it selects the top 3 most frequent prices and draws horizontal lines at those l
FREE

Sessions are very important in trading and often good area where to look for setup. In SMC, ICT we will look for Asian session to serve as liquidity
This indicator displays: High & Low of the Asia session Midnight New York time opening line
Congifuration Line Style, color Label position, size, color Start of the level (Start of the day, Start of the session, Highest or Lowest point in the session)
Any questions or comments, send me a direct message here https://www.mql5.com/en/users/mvonline
FREE
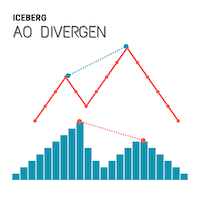
Iceberg Divergen Indicator Uncover the hidden opportunities beneath the surface.
Overview Divergences in the Awesome Oscillator (AO) often signal powerful market reversals, yet spotting them manually can be challenging and time-consuming. Missing out on these opportunities can cost traders valuable entry points. That’s why we created the Iceberg Divergence Indicator — a powerful tool that precisely detects both regular and hidden divergences in AO. With Iceberg Divergence, you won’t just id
FREE

Think of the Super Fractal Indicator as the Bill WIlliams Indicator on Steroids. Indicator Abilities: 1. Adjust Candle around Fractal High or Low. 2. Adjust Lookback period and only plot for a specific number of history candles avoiding cluttering your trading desk. 3. The Indicator uses buffers so you call and use it from any EA.
Note : The higher the candles around Fractal, the stronger the Turning point anfd viceversa is true.
FREE
Stochastic Alert Indicator for MetaTrader 5
The Stochastic Alert Indicator is a powerful and customizable tool designed for the MetaTrader 5 platform, perfect for traders who want to monitor overbought and oversold conditions while staying informed of potential buying and selling pressure. Key Features: Overbought/Oversold Detection: Automatically detects when the market reaches overbought (above 80) or oversold (below 20) levels, providing you with timely alerts for potential reversal points.
FREE
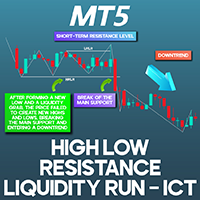
High-Low Liquidity Sweep ICT MT5 The HLRS (High Liquidity Resistance Sweep) and LLRS (Low Liquidity Resistance Sweep) indicators are advanced tools designed to analyze price movement within liquidity zones based on the ICT framework. An HLRS pattern emerges when the price accumulates liquidity at its lowest point before initiating an upward movement. This shift is characterized by the consistent formation of higher lows and higher highs, establishing a structured bullish trend. On the other hand
FREE
Keyzone – это индикатор, предназначенный для определения уровней поддержки и сопротивления , разделенных на четыре ключевых уровня: 3, 8, 21 и 89. Эти уровни основаны на усовершенствованной адаптации Smart Money Concept (SMC) , обеспечивая высокую эффективность при максимальной простоте использования. Благодаря простоте и мощности Keyzone можно легко применять в различных стилях трейдинга, включая:
Скальпинг – быстрые, высокочастотные сделки Свинг-трейдинг – ловля среднесрочных движений цены Сле
FREE

The Weis Wave first takes the market volume and then organizes it with the price into Wave charts. It is the only software that will present the true picture of the market before you. If anyone of you, has watched an intraday price movement then you must know that it unfolds in a series of selling as well as buying waves-a procedures tearing down and building up. Wave analysis is an integral part of the trading method. The indicator helps to deal with today’s volatile market. Moreover, it works
FREE

Highly configurable Macd indicator.
Features: Highly customizable alert functions (at levels, crosses, direction changes via email, push, sound, popup) Multi timeframe ability Color customization (at levels, crosses, direction changes) Linear interpolation and histogram mode options Works on strategy tester in multi timeframe mode (at weekend without ticks also) Adjustable Levels Parameters:
Stochastic RSI Timeframe: You can set the lower/higher timeframes for Stochastic RSI. Stochastic RSI
FREE

Are you tired of drawing trendlines every time you're analyzing charts? Or perhaps you would like more consistency in your technical analysis. Then this is for you. This indicator will draw trend lines automatically when dropped on a chart. How it works Works similar to standard deviation channel found on mt4 and mt5. It has 2 parameters: 1. Starting Bar 2. Number of bars for calculation The starting bar is the bar which drawing of the trend lines will begin, while the number of bars for c
FREE

MT4 version Overview The Lowess Channel indicator is a smoothed trend-following tool designed to help traders identify the direction of the trend , detect flat or ranging markets , and spot breakouts from consolidation zones. It creates a central smoothed line with upper and lower channel boundaries, adapting to market noise while maintaining clarity. How It Works The indicator builds a channel around a smoothed price line. The central line reflects the current trend. The upper and lower bounda
FREE
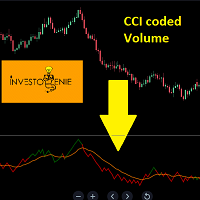
The Indicator is based on Commodity Channel Index (CCI) coded on Volume. The concept is to try and analyze the movement of Volume and Price in a certain direction
Concept:
If the Price of the indicator moves below the threshold price, it turns RED indicating the direction downwards is getting strong.
If the Price of the indicator moves above the threshold price, it turns GREEN indicating the direction upwards is getting strong.
The moving average acts as a great filter to decide entry/exit poi
FREE

Rejection Block Indicator and Void MT5 The Rejection Block Indicator is a powerful tool designed to detect market reversal zones in MetaTrader 5 . By analyzing candle wicks, this indicator marks crucial rejection block areas where long upper shadows near price highs and lower shadows near price lows act as potential reversal points. Additionally, the Void (absorbed portion) within the rejection blocks is highlighted in gray. Once this void is entirely filled, it signals that the level has lost i
FREE
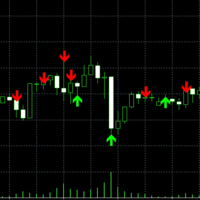
Этот индикатор показывает точки, где тренд бара разворачивается из-за внезапного давления, даже если общий тренд движется вверх или вниз. Стрелка, отображаемая индикатором, основана на анализе предыдущего бара, который должен соответствовать определенным критериям для изменения тренда. При разработке вашей стратегии вы можете интерпретировать 3–4 последовательные стрелки в одном направлении как сигнал возможного прорыва. Например, когда вы видите четвертую стрелку, можно рассмотреть возможность
FREE

Pivot Classic, Woodie, Camarilla, Fibonacci and Demark Floor/Classic Точки разворота или просто развороты полезны для определения потенциальных уровней поддержки/сопротивления, торговых диапазонов, разворотов тренда и настроений рынка путем изучения максимума, минимума и значений закрытия актива. Точки разворота Floor/Classic можно рассчитать следующим образом. Pivot Point (P) = (High + Low + Close)/3 S1 = P * 2 - High S2 = P - (High - Low) S3 = Low – 2*(High - P) R1 = P * 2 - Low R2 = P + (High
FREE

Ренко - это вневременной график, то есть он учитывает не период времени, а изменение цены, что делает изменение цены на графике более четким.
Hyper Renko является индикатором, который обеспечивает это.
Для настройки у вас есть только один параметр - размер свечи в тике *, который вы хотите использовать.
* галочка: это наименьшее возможное изменение актива.
Спасибо за выбор индикатора Hyper Trader.
Википедия: Диаграмма Ренко показывает минимальное изменение значения переменной - например, ц
FREE

Mouse You can draw fibonaccis moving the mouse over the zigzag indicator Pin them You can click on fibonacci with this option and it will no longer be deleted unless you click on it again :) Precision The tuned fibonacci gets the precise point in lower timeframes Enjoy it You can ask me for add more features, so please comment and leave your ranting for me to be happy, thank you :)
FREE
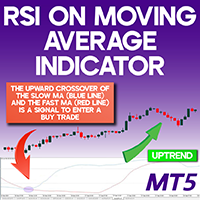
RSI On Moving Average Indicator for MT5 The RSI On Moving Average Indicator Merges Moving Average Crossovers with the Relative Strength Index (RSI) to provide a powerful tool for assessing market momentum and trend direction. By integrating these two analytical methods, this indicator enhances trading precision, helping traders identify potential buy and sell opportunities more effectively. This indicator operates with two oscillating lines fluctuating between 0 and 100 , which signal optimal en
FREE

MomoPoints — индикатор, который показывает на графике точки входа/дополнения длинных и коротких позиций.
Основываясь на динамике и силе тренда, MomoPoints показывает входы/дополнения с хорошим соотношением риска и прибыли.
Настройки
----------------------------------
Дизайн: цвета, размер и крылья (графический символ) сигнала можно регулировать.
Настройки сигнала: можно установить период скользящей средней, силу тренда, расстояние от скользящей средней до цены и период RSI.
Значения сигнало
FREE

This indicator finds Double Top and Double bottom Example : What is Double Top When price establishes a new high and then falls, then reverse to the same candle area of High then its considered a valid double top and vice versa for double bottom. 1. It plots and high and low on visible chart if ChartChange is set to true else it searches on new bar opening
2. If there is double top and double bottom found in visible chart window then it plots a line 3. It has options to customize text color, tex
FREE

Draw and Sync Objects Multiple Charts 1. Draw objects by key press. ( You must: 1. Press Function key => 2. Click where you want to draw => 3. Draw it => 4. Press ESC to complete). (If you don't want to draw after pressing function key, you must press ESC to cancel). 2. Developing : Sync selected objects to multiple charts by button. 3. Developing: Hide objects that do not belong to the current symbol (Objects drawn with this indicator will belong to the symbol they are plotted on. When your c
FREE

COLORED TREND MA / MACD CANDLES draw MA Candles above/below Moving Average draw MACD Candles above and below 0 and Signal-Line
Your Advantage: a simple view of the trend direction a simple view over the higher trend direction a calmer chart for the eye clear rules can be defined Settings: Value Quick-Set : pre-Settings MACD 3 / 9 / 6 MACD customize MA Candles Fast EMA : 12 Slow EMA : 26 MACD SMA : 9 1. MA Period : default 14 and 20, which are my favorite for all timeframes, I believe in the 14
FREE

I'm sure after a lot of research on the internet, you haven't found any indicator that can help you with forex or binary trading in the latest probability strategy created by famous trader Ronald Cutrim. The strategy is based on a simple count of green and red candles, checking for a numerical imbalance between them over a certain period of time on an investment market chart. If this imbalance is confirmed and is equal to or greater than 16%, according to trader Ronald Cutrim, creator of the pro
FREE

Moving Average Convergence/Divergence — схождение/расхождение скользящих средних — технический индикатор, разработанный Джеральдом Аппелем (Gerald Appel), используемый в техническом анализе для проверки силы и направления тренда, а также определения разворотных точек. Встроенный в MetaTrader 5 индикатор MACD не соответствует задумке автора (Gerald Appel):
-линия MACD графически изображена в виде гистограммы, однако гистограммой отражается разница между линией MACD и сигнальной линией;
-сигнальн
FREE

Jackson trendline scanner it a powerful price action tool which draw accurate trendlines and alert a breakout signals . As we all know that trendlines it a most powerful tool in price action by providing us with different chart patterns. e.g. Bullish flag, Pennant, Wedges and more...It not easy to draw trend lines, Most successful traders use trendlines to predict the next move based on chart pattern and breakout. Drawing a wrong trendline it a common problem to everyone, wrong
FREE

Индикатор вычисляет профиль объёма и выставляет метки, соответствующие уровням VAL, VAH и POC, для каждой свечи индивидуально.
Особенности работы индикатора Индикатор работает на периодах от M3 до MN, но для вычислений использует исторические данные меньших периодов: M1 - для периодов от M3 до H1, M5 - для периодов от H2 до H12, M30 - для периода D1, H4 - для периода W1, D1 - для периода MN. Цвет и положение меток VAL, VAH и POC на текущей свече считаются корректными только по времени близкому
FREE

Order Block Void Indicator MT5
The Order Block + Void Indicator in MetaTrader 5 is an advanced tool designed to detect key liquidity areas and highlight them as order blocks. These zones are frequently utilized by institutional traders, making them ideal reference points for determining support and resistance levels. This indicator visually marks bullish order blocks with green boxes and bearish order blocks with red boxes. Additionally, once an order block is consumed, it turns gray to indic
FREE
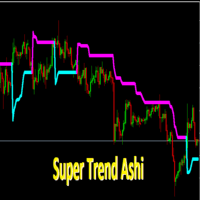
SuperTrendAshi Description SuperTrendAshi is an advanced and optimized version of the SuperTrend indicator that incorporates Heikin Ashi calculation to provide smoother and more reliable signals. This unique combination results in an indicator that reduces false signals and identifies trends with greater precision. Key Features Combines the strength of SuperTrend with Heikin Ashi smoothing More stable signals with less noise Intuitive color system (Aqua for uptrend, Magenta for downtrend) Custo
FREE

A combined indicator of two famous indicators: RSI , Bollinger Bands Can be used in all currency pairs Can be used in all time frames with many signals Very simple and fast to use
Description:
This indicator is made from the combination of RSI and Bollinger Bands indicators
As you can see, it shows good signals and is worth using and testing
We hope you are satisfied with this indicator
Settings: show past show candle: Displays the number of candles that the indicator calculates.
For example
FREE
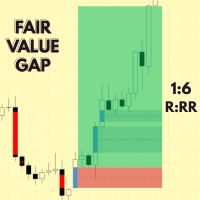
Fair value gap indicator MT5 – Advanced Fair Value Gap Detection for MT5 Enhance Your Trading with Fair value gap indicator MT5! Are you looking to identify Fair Value Gaps (FVGs) effectively and integrate them into your trading strategy? The Fair value gap indicator MT5 for MetaTrader 5 (MT5) offers a comprehensive solution to detect and utilize FVGs, providing you with a trading edge. Key Features: Dynamic FVG Detection: Automatically scans and highlights FVGs on your cha
FREE
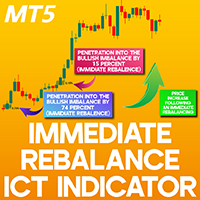
Immediate Rebalance ICT Indicator for MT5 The Immediate Rebalance Indicator is an advanced tool designed to pinpoint price rebalancing zones within MetaTrader 5 . Market imbalance arises when supply and demand are uneven, often triggering sharp price movements. This indicator identifies gaps by analyzing three consecutive candles. If a gap is present between the first and third candle wicks, and the third candle’s wick overlaps the first candle’s wick, it signals a trend continuation. Such price
FREE
MFI Divergence is a technical indicator that detects regular bullish and bearish divergences between price and the Money Flow Index (MFI) at swing highs and lows. It highlights potential reversal points by drawing clean green (bullish) and red (bearish) arrows directly on the chart. The indicator uses configurable swing detection, customizable MFI period, and an optional MFI threshold filter to show signals only in oversold/overbought zones. Alerts are triggered only once per bar on candle close
FREE

Description:
Heikin-Ashi-like swing oscillator candles. It can be used in the same way as RSI or Stochastic.
For example: Zero crossing. Above the zero line is bullish, below the zero line is bearish.
Overbought or oversold. 100 line is the extreme bought level, -100 line is the extreme sold level.
Divergences.
Time frame: Any time frame.
Instrument: Any instrument.
FREE
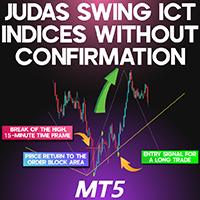
Judas Swing ICT Indices Without Confirmation for MetaTrader 5 The Judas Index Indicator is an essential tool in MetaTrader 5, designed to help traders recognize deceptive price movements. Many market participants misinterpret the initial price fluctuations, leading to incorrect trade entries. This indicator assists traders in detecting these false moves and provides signals for potential trade opportunities. The Judas Indices ICT Indicator specifically monitors price swings between the most rec
FREE

The indicator that shows the countdown to the change of candles is equipped with an alert when the bar changes (the alert is not active if installed on the M1 time frame). Displays seconds if installed in time frame M1, displays minutes and seconds if installed in time frame above M1, and displays hours and minutes if installed in time frame h1 and above. The time displayed is calculated based on the running time.
FREE
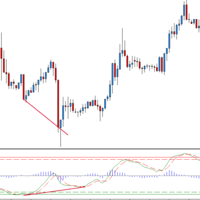
Why Use the WaveTrend Indicator? Here’s why WaveTrend stands out as a must-have tool for traders: Precision Timing for Entries and Exits
By highlighting overbought and oversold zones, WaveTrend helps you enter trades at undervalued levels and exit at overvalued peaks, optimizing your risk-to-reward ratio. Clear Trend Confirmation
Crossovers provide straightforward signals to confirm whether a trend is starting or ending, reducing uncertainty and boosting decision-making confidence. Early Reve
FREE

Developed by Chuck LeBeau, the Chandelier Exit indicator uses the highest high / lowest low -/+ a multiple of the ATR value to draw trailing stop lines (orange under buys, magenta over sells) that advance with the trend until the trend changes direction.The value of this trailing stop is that it rapidly moves upward in response to the market action. LeBeau chose the chandelier name because "just as a chandelier hangs down from the ceiling of a room, the chandelier exit hangs down from the high
FREE
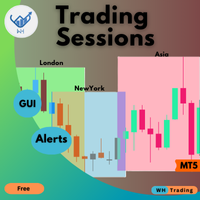
Повысьте точность своей торговли с индикатором WH Trading Sessions MT5 для MetaTrader 5! Этот мощный инструмент поможет вам визуализировать и управлять ключевыми рыночными сессиями без особых усилий. Основанный на на: Индикатор WH SMC MT5
Версия MT4: WH Trading Sessions MT4
Основные характеристики: Интерактивная панель графического интерфейса пользователя — легкий выбор и переключение между торговыми сессиями Азии, Лондона и Нью-Йорка .
Настраиваемые оповещения и настройки
FREE

Original supertrend indicator in Tradingview platform. Indicator type: Price Action indicator Introduction: The Supertrend Indicator - Enhancing Your Trend Analysis. If you haven't yet found a Supertrend indicator with good graphics on the MQL5 platform, this is the indicator for you. Overview: The Supertrend Indicator is a powerful tool designed to provide traders with valuable insights into the current and historical trends of financial markets. It serves as a valuable addition to any t
FREE

Построение точек разворота Traditionnal, Fibonacci, Woodie, Classic, Demark, Camarilla для любого таймфрейма
Поддержка всех типов разворотов Traditionnal, Fibonacci, Woodie, Classic, Demark, Camarilla Поддержка любого таймфрейма (M1...H1...D1...MN1...Yearly) Поддержка перехода на летнее время Поддержка ежедневного раздела форекс от открытия в Сиднее до закрытия в США Поддержка торговли криптовалютами Заполните разрыв между разворотной точкой и трендом, очень полезно
Разворотные точки показыва
FREE

This indicator uses the Zigzag indicator to identify swing highs and swing lows in the price chart. Once it has identified the swing highs and swing lows, it can use them to determine potential support and resistance levels. A support level is formed when the price drops and bounces back up from a swing low, indicating that there is buying pressure at that level. A resistance level is formed when the price rises and reverses downward from a swing high, suggesting selling pressure at that level.
FREE

Combination of Ichimoku and Super Trend indicators. 1. ARC (Average Range times Constant) The concept of ARC or Volatility System was introduced by Welles Wilder Jr. in his 1978 book, New Concepts in Technical Trading Systems . It has since been adapted and modified into the popular Super Trend indicator.
The fundamental idea behind ARC is simple: to identify support and resistance levels, you multiply a constant with the Average True Range (ATR) . Then, you either subtract or add the resulting
FREE

T he most Flexible & Reliable Trend-Based Fibonacci indicator by Safe Trading. This indicator helps you calculate Trend-Based Fibonacci levels base on the main and retracement trends to predict future price . If you just looking for a powerful indicator, please check this Timeframes Trend Scanner indicator ### FEATURES ### Auto-calculate up to 7 Trend-Based Fibonacci levels on adjustable frame. Adjust Fibonacci levels as your need. Adjust the start and the end of calculated frame i
FREE

INFOPad - информационная панель, создающая информацию по выбранной валютной паре в терминале МetaТrader 5. Существует 5 функций этого индикатора: Показывает основную и главную информацию по выбранному символу: цены Ask BID, Spread, Stop Level, Swap, Tick value, Commission; Показывает будущие цели SL target и TP Target (Количество пунктов установленного стоплосса и тейкпрофита, сумма в долларах); Показывает прибыль, полученную за периоды: Сегодня, Неделя, Месяц, Год, Общая прибыль по выбранной в
FREE

The original author is David Weis, an expert in the Wyckoff Method. The Weis Wave is a modern adaptation of the 1930's Wyckoff Method, another expert in Tape Reading techniques and Chart Analysis. Weis Waves takes market volume and stacks it into waves according to price conditions giving the trader valuable insights about the market conditions. If you want to learn more about this subject you can find tons of videos in YouTube. Just look for "The Wickoff Method", "Weis Wave" and "Volume Spread
FREE

VWAP Fibo Bands RSJ is an indicator that traces the lines of the daily VWAP and from it creates bands using Fibonacci proportions. This spectacular indicator creates 10 band levels through the selected VWAP period using Fibonacci ratios.
It is fantastic how the prices respect each level of the bands, where it is possible to realize that almost every time the price closes above / below a level of the bands he will seek the next one. If close above will seek to reach the level above and if close
FREE

Выделяет торговые сессии на графике
Trading Sessions Indicator (Индикатор торговых сессий) отображает начало и окончание каждой торговой сессии.
Платная версия продукта Trading Sessions Indicator Pro с возможностью пользовательской настройки начала/окончания сессий >>>
[ОПЦИИ:] Timeshift - Используйте, если имеет место смещение сессий по времени
[Заданные параметры:] Asian session Open=0; Asian session Close=9; Asian session OpenSummertime=1; Asian session CloseSummertime=10; European sessi
FREE
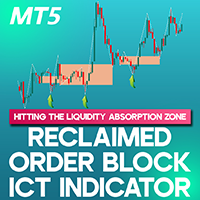
Reclaimed Order Block ICT Indicator MT5 Built upon the ICT trading principles, the Reclaimed Order Block ICT Indicator MT5 for MetaTrader 5 pinpoints essential price areas where an order block is initially breached, leading to a structural shift and the formation of a new trend. As the price revisits these levels post-breakout, the indicator generates strategic buy and sell signals, assisting traders in making data-driven decisions. «Indicator Installation & User Guide» MT5 Indicator Installatio
FREE

Институциональные уровни / Банковские уровни ... Психологические уровни / Теория кварталов.
Этот индикатор автоматически рисует на уровнях «000, 200, 500 и 800», которые я знаю как «Институциональные уровни», ИЛИ также может рисовать на графике уровни «000, 250, 500 и 750».
В зависимости от того, где вы изучали торговлю на институциональных уровнях / Теорию кварталов, вы можете знать их под разными названиями, по сути, основная идея заключается в том, что эти уровни действуют как сильные точки
FREE

TILLSON MOVING AVERAGE Также известен как индикатор TMA или T3. Это скользящее среднее, которое использует EMA и DEMA в своей формуле и рассчитывается с биномиальным расширением 3-й степени . ... int handle1; //Handle of the Tillson TMA T3.EX5 custom indicator double euBuff1[]; int TMAperiod= 12 ; int TMSshift= 0 ; double VolumeFactor= 0.618 ; int OnInit () { ... handle1= iCustom ( NULL , PERIOD_CURRENT , "Market\\Tillson TMA T3.EX5" ,0,TMAperiod,0,0,T
FREE

### Индикатор Ultimate Pivot Levels для MetaTrader 5
Ultimate_Pivot_Levels — это универсальный инструмент, разработанный для улучшения вашего торгового опыта путем точного нанесения уровней пивотов на ваши графики. Он позволяет вводить желаемые значения вручную или использовать хорошо известные методы расчета пивотов для создания уровней пивотов. Индикатор рисует уровни на заднем плане и позволяет вам настраивать уровни, размер и цвета областей, сохраняя ваши корректировки при расширении уровне
FREE

The fact that round number levels have a significant influence on the market cannot be denied and should not be overlooked. These psychological levels are used by both retail Forex traders and major banks that deal in Forex. Very simple and effective indicator and most importantly free. ////////////////////////////////////////////////////////////////////////////////////////////////////////////////////////////////////////////////////////////// The program does not work in the strategy tester.
FREE

VR Ticks - это специальный индикатор для стратегий на основе скальпинга. Благодаря этому индикатору, трейдер может видеть тиковый график напрямую на основном графике финансового инструмента. Тиковый график позволяет максимально точно войти позицией в рынок или закрыть позицию в рынке. VR Ticks строит тиковые данные в виде линий меняющих цвет в зависимости от направления - это позволяет визуально понимать и оценивать ситуацию на тиках. Преимущество тиковых графиков заключается в том что они не
FREE

The Trendline Automatic indicator is an advanced technical analysis tool specifically designed to assist traders in identifying critical levels in the financial markets through the automatic drawing of support and resistance trendlines on price charts. With its automatic capabilities, this indicator saves traders time and effort in analyzing price movements, allowing them to focus on making better trading decisions. Key Features : Automatic Drawing of Trendlines : This indicator allows traders t
FREE

This indicators automatically draws the support and resistances levels (key levels) for you once you've dropped it on a chart. It reduces the hustle of drawing and redrawing these levels every time you analyse prices on a chart. With it, all you have to do is drop it on a chart, adjust the settings to your liking and let the indicator do the rest.
But wait, it gets better; the indicator is absolutely free! For more information: https://youtu.be/rTxbPOBu3nY For more free stuff visit: https:
FREE

If you have the opportunity to read the book " Trend Trading - A Seven-Step Approach to success " by Daryl Guppy, you will have a great deal of information about how to "read" the market. In his book Daryl show, among other things, how can we use a visual tool to measure the volatility and trend between Long and Short-term periods: The GMMA - Guppy Multiple Moving Averages .
Instead of using his original idea of having 12 Exponential Moving Averages in your chart - which could be very CPU-deman
FREE

The TRIXs Indicator is the combination of the TRIX (Triple Exponential Moving Average) indicator with the addition of a SMA (Simple Moving Average) signal. It provides signs of trend continuity and the start of a new trend.
The entry and exit points of operations occur when the indicator curves cross.
It performs better when combined with other indicators.
FREE

Advanced Dynamic RSI – The Evolution of the Classic RSI Advanced Dynamic RSI is based on the work of technical analyst J. Welles Wilder and has been further developed. This improved indicator combines Wilder's proven RSI calculation with modern features and a dynamic smoothing method, which delivers more precise and flexibly adjustable signals, allowing traders to analyze market volatility and price movements with greater accuracy.
Features and Key Characteristics Dynamic Levels: The Advanced D
FREE

TG MTF MA MT5 is designed to display a multi-timeframe moving average (MA) on any chart timeframe while allowing users to specify and view the MA values from a particular timeframe across all timeframes. This functionality enables users to focus on the moving average of a specific timeframe without switching charts. By isolating the moving average values of a specific timeframe across all timeframes, users can gain insights into the trend dynamics and potential trading opportunities without sw
FREE

Индикатор предназначен для обнаружения высоковероятностных моделей разворота: двойная вершина/дно с ложными прорывами . Это бесплатная версия индикатора: https://www.mql5.com/ru/market/product/29957 Бесплатная версия работает только на EURUSD и GBPUSD! Двойная вершина/двойное дно - свечные паттерны, возникающие, когда движение цены торгового инструмента формирует фигуру, похожую на букву "W" (Двойное дно) или "M" (двойная вершина). Такие паттерны обычно формируются в конце тренда и используются
FREE
MetaTrader Маркет - торговые роботы и технические индикаторы для трейдеров, доступные прямо в терминале.
Платежная система MQL5.community разработана для сервисов платформы MetaTrader и автоматически доступна всем зарегистрированным пользователям сайта MQL5.com. Ввод и вывод денежных средств возможен с помощью WebMoney, PayPal и банковских карт.
Вы упускаете торговые возможности:
- Бесплатные приложения для трейдинга
- 8 000+ сигналов для копирования
- Экономические новости для анализа финансовых рынков
Регистрация
Вход
Если у вас нет учетной записи, зарегистрируйтесь
Для авторизации и пользования сайтом MQL5.com необходимо разрешить использование файлов Сookie.
Пожалуйста, включите в вашем браузере данную настройку, иначе вы не сможете авторизоваться.