Смотри обучающее видео по маркету на YouTube
Как купить торгового робота или индикатор
Запусти робота на
виртуальном хостинге
виртуальном хостинге
Протестируй индикатор/робота перед покупкой
Хочешь зарабатывать в Маркете?
Как подать продукт, чтобы его покупали
Бесплатные технические индикаторы для MetaTrader 5 - 10

Индикатор IRush использует модифицированную версию популярного индикатора RSI (Relative Strength Index, "Индекс относительной силы") для определения входов в рынок на дневном графике или меньше. Индикатор настроен и проверен для работы на основных символах: AUDUSD, EURUSD, GBPUSD, USDCAD, USDCHF и USDJPY. Автоматическая торговля по этому индикатору реализована в советнике Intraday Rush . Советник умеет открывать, вести и закрывать свои сделки. Обязательно посмотрите, возможно, это то, что вы иск
FREE

Фрактальный индикатор показывает последние уровни поддержки и сопротивления. Если цена пробивает уровень и закрепляется то индикатор рисует ромб желтого или малинового цвета сигнализирующий о возможном продолжении движения в сторону пробоя. Настройки индикатора: - BarCount: задает минимальное количество баров необходимых для построения фрактала. Индикатор лучше использовать в совокупности с другими индикаторами.
FREE

Индекс Относительного Равновесия, REi — индикатор технического анализа, показывающий направление и силу тенденции и указывающий на вероятность еe смены. Он показывает отношение среднего прироста цены к среднему падению за определенный период времени. Величина индекса позволяет оценить, покупатели или продавцы сильнее влияли на цену за установленный период времени и предположить дальнейшее развитие событий. Индикатор отличается простотой интерпретации и качеством подаваемых сигналов. Точки входа,
FREE

O indicador Supertrendingsignal imprime um sinal na tela indicando início de uma forte tendência. O sinal não mostra o ponto de entrada com melhor risco retorno, apenas faz a indicação de uma forte tendência. Foi idealizado a partir de um conjunto de médias móveis e volume. Parametros: Periodmalongo: Períodos da média longa Periodmamedio: Períodos da segunda media Periodmamedio2: Perídos da terceira media Periodmacurto: Períodos da média curta. PeriodATR: Períodos do indicador ATR para adequar
FREE

Introducing the Accelerator Divergence Indicator, a powerful tool designed to enhance your Forex trading experience. This innovative indicator is specifically crafted to identify market divergence, providing traders with valuable insights for more informed decision-making. The Accelerator Divergence Indicator utilizes advanced algorithms to detect divergence in the market, visually guiding traders with precision-drawn lines that highlight key points of interest. Divergence occurs when the price
FREE

The Stochastic Momentum Index (SMI), developed by William Blau and featured in the January 1993 edition of Technical Analysis of Stocks & Commodities magazine, introduces a unique perspective to trading analysis. Distinguished from the conventional Stochastic Oscillator, which evaluates the current close in relation to the recent x-period high/low range, the SMI assesses the close's position relative to the midpoint of this range. This innovation yields an oscillator with a range of +/- 100, re
FREE

Description: The Custom Moving Averages indicator displays three different moving averages on the chart: a 10-period Simple Moving Average (SMA10) in lime, a 21-period Simple Moving Average (SMA21) in red, and a 200-period Exponential Moving Average (EMA200) in thicker white. This indicator helps traders identify trends and potential entry/exit points based on the behavior of these moving averages. Features: Three moving averages in different periods: SMA10, SMA21, and EMA200. Customizable color
FREE

Технический индикатор Trend Strength Analyzer измеряет отклонение цены инструмента от средних значений за определенный период времени. В основе индикатора лежит сравнительный анализ относительной силы быков и медведей. Если быки преобладают, то наблюдается восходящий тренд. Если медведи сильнее - это нисходящий тренд.
Настройки:
Strike Energy (2 сплошные линии) = 14.
Influence Power (2 пунктирные линии) = 50.
Осциллятор TSA эффективен на активном рынке. Наиболее часто используемыми ин
FREE

Индикатор реального волчка
Он обнаруживает точную волчку на графике со сбалансированным соотношением высоты тела и фитиля, что является истинным значением волчка, которое отличает его от Молотов и Доджи или Нулевой свечи.
Этот индикатор отображает иконку с крыльями на количестве волчков, найденных на графике.
Настройки включают
Количество баров: настроить поиск по количеству баров.
Цвет значка: изменить цвет значка
Код значка: изменить код крыла для значка
FREE
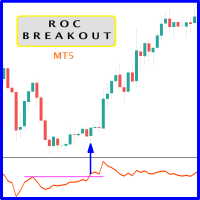
When prices breakout resistance levels are combined with Rate of Change oscillator "ROC" oscillator breaks out its historical resistance levels then probability emerges to record farther prices. It's strongly encouraged to confirm price breakout with oscillator breakout since they have comparable effects to price breaking support and resistance levels; surely, short trades will have the same perception. Concept is based on find swing levels which based on number of bars by each side to confirm
FREE

Swiss VWAPsimple Motivation Did not find free VWAP that works, the one that I found craseh. So I created a VWAP which calculates values only for the actual day. So computer resouces are not over stressed.
What is VWAP, how is it used? VWAP stands for Volume Weighed Average Price, it calculates the running sum of tick volume and the runnung sum of price times tickvolume. The division of these sums result in a weighed price (Sum P*V/Sum V). The calculation starts normally at midnight. The value
FREE

Qstick is a way to objectively quantify candlestick analysis and improve the interpretation of candlestick patterns. Qstick was developed by Tushar Chande and published in his book " The New Technical Trader - Boost Your Profit by Plugging Into the Latest Indicators (1994) ". Qstick is built based on a moving average of the difference between the Open and Close prices. The basis of the idea is that the Opening and Closing prices are the heart of candlestick analysis. We strongly recommend the re
FREE

Представляем Вам Volatility Doctor Compass – Ваш надежный проводник к прибылям на любом рынке!
Раскройте Секреты Вечных Математических Законов: Окунитесь в суть мастерства торговли с нашей уникальной технологией, укорененной в математических принципах, которые выходят за пределы каждого рынка. Хотя мы не раскрываем секреты, будьте уверены, эта инновация – ваш билет к непревзойденной надежности в любых рыночных условиях.
Революционная Двойная Функциональность: Представьте себе возможно
FREE

Trade Sentiment or trade assistant is a MT5 Indicatior. That show buy or sell signal of different indicator to assist to take trades. That will help you to take right trades or to get confirmation for your trade. You don't need to have this indicators. Including indicators like RSI , STOCH , CCI. And the signals are Based on different Timeframes like 5M , 15H , 1H and 4H.
FREE

Indicator that uses ATR and standard deviation to calculate the current trend. It has the top and bottom line. The top line is shown when it is high, and the bottom line when it is low. The indicator does not draw a trend line or show the trend for the day, or for a certain period. It has the function of indicating the current trend, and may indicate a reversal.
use it with caution and at your own risk.
FREE

This indicator uses a different approach from the previous version to get it's trendlines. This method is derived from Orchard Forex, and the process of making the indicator is demonstrated in there video https://www.youtube.com/watch?v=mEaiurw56wY&t=1425s .
The basic idea behind this indicator is it draws a tangent line on the highest levels and lowest levels of the bars used for calculation, while ensuring that the lines don't intersect with the bars in review (alittle confusing? I kno
FREE

For support, visit cc.inni.cc where you will also find our Knowledge library and FAQ. PATHFINDER ZONES is a powerful yet intuitive tool designed to highlight key Support and Resistance zones. This indicator helps traders identify potential turning points in the market by mapping out untested, proven, or broken price zones. Whether you're a day trader or long-term investor, Pathfinder Zones is a valuable addition to your strategy, bringing simplicity and clarity to your analysis.
Key F
FREE

A new box will be added, if the closing price is higher than the maximum (lower than the minimum) of the current box series no less than for the specified value. Reversal will be made, if the closing price is higher (lower) than the last box on a value no less than the specified.
T his is a trend indicator and it can be used as an alternative for the trend definition instruments which use averaging.
FREE

Camarilla Swing Trade Indicator is an Indicator. Support and resistance points are calculated from the High Low Close of the previous TF Week's price.
What are Camarilla Pivot Points?
1.Camarilla Pivot Points is a modified version of the classic Pivot Point. 2.Camarilla Pivot Points was launched in 1989 by Nick Scott, a successful bond trader. 3.The basic idea behind Camarilla Pivot Points is that price tends to revert to its mean until it doesn't. 4.Camarilla Pivot Points is a mathematical
FREE
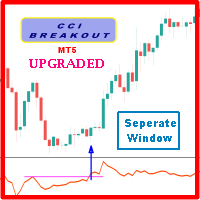
Probability emerges to record higher prices when Commodity Channel Index breaks out oscillator historical resistance level when exhibit overbought values. Since, oscillator breakout of support and resistance have similar effect as price breaks support and resistance levels, therefore, its highly advised to confirm price breakout with oscillator breakout; certainly, will have the same output in short trades. Concept is based on find swing levels which based on number of bars by each side of peak
FREE

Indicator measures strength of each currency in your list.
Main idea: It simply iterates through all combinations of pairs and adds difference between open and close in percent. Parameters: List of currencies - what currencies will be calculated (maximum is 8) Calculation type - from which data will be strength calculated Calculation data input - used as input related to calculation type Symbol suffix - used in case of suffix on symbols, e.g: when your symbols look like EURUSDm, EURUSDmicro et
FREE

Acceleration Points - мощный инструмент обнаружения критических точек ценового движения, основанный на идеи вычисления ускорения ценовых колебаний. _________________________________ Как пользоваться сигналами индикатора: Индикатор формирует сигнал после появления нового ценового бара. Использовать сформированный сигнал рекомендуется после пробития ценой критической точки в указанном направлении. Индикатор не перерисовывает свои сигналы. _________________________________ Параметры индикатора пр
FREE

For those who love to follow Volume behavior here it is a little indicator that could be used as a replacement for the old and standard MT5 built-in volume indicator. The trick here is that this indicator paints the volume histogram based on the direction of the candle giving to the trader a quick "Heads Up" on what is happening, visually! It could be used to study and see for instance, the volume and past bars volume during (or, reaching) a peak (Tops and Bottoms). UP candles are shown in pale
FREE

Alert Indicator for exponential moving average cross blue arrow for buy alert , fast ema 14 crosses above 50 pink arrow for sell alert , fast ema 14 crosses below 50 Default 14 ema fast & 50 ema slow add these indicators to chart Full Alerts , push, email, phone inputs for moving average lengths and alarm on off settings Please contact for help of an indicator alert suggestion
FREE

This is an indicator that shows total pips ,order counts and the total profit accumulated for the open orders of the pair attached. The colors change depending on if the total profit is positive , negative or zero. Contact:
If you have some questions or if you need help, kindly contact me via Private Message. Author: A.L.I, fintech software engineer and a passionate forex trader.
FREE

A very useful Price Action point is the previous day Closing VWAP. We call it Big Players Last Fight . This indicator will draw a line showing on your chart what was the last VWAP price of the previous trading session. Simple and effective. As an additional bonus, this indicator saves the VWAP value on the Public Terminal Variables, so you EA could read easily its value! Just for the "Prefix + Symbol name" on the variables list and you will see!
SETTINGS How many past days back do you want to
FREE

True Days is a tool designed specifically for the trader who wants to catch intraday volatility in price charts. True day makes it easier for the trader to avoid trading in the dead zone - a period in time where markets are considered dead or non volatile. The trader can concentrate on finding opportunities only during periods of profound market movements. By default the indicator gives you a true day starting at 02:00 to 19:00 hours GMT+2. You can adjust according to your Time Zone. By deafult
FREE

El **Heiken Ashi Smoothed** es una versión suavizada del indicador técnico Heiken Ashi, que se utiliza en el análisis de gráficos de velas para identificar tendencias del mercado y pronosticar movimientos de precios. Este indicador se basa en el promedio de datos de precios para formar un gráfico de velas que ayuda a los traders a filtrar el ruido del mercado.
**¿Para qué sirve?** Este indicador se utiliza para identificar cuándo los traders deben permanecer en una operación y cuándo está por
FREE

Фрактальная дивергенция - это скрытая дивергенция, построенная на фракталах Билла Вильямса. Бычья фрактальная дивергенция представляет собой комбинацию из двух нижних фракталов, последний из которых расположен ниже предыдущего, и при этом две свечи справа от минимума последнего фрактала имеют минимумы выше уровня предыдущего фрактала (см. скриншот 1). Медвежья фрактальная дивергенция - это комбинация из двух соседних верхних фракталов, последний из которых расположен выше, чем предыдущий верхн
FREE

Welcome to the Minions Labs' reinterpretation of the Classic Bulls & Bears Power , developed by Alexander Elder a long ago. Since the 2 indicators: Bull Power and Bear Power were histogram-based indicators and having 2 indicators in the same chart and occupy too much screen, we decided to mix them into ONE Line and Color-based indicator, which give us all the information we need. The Bull & Bear Power indicators help you determine the strength of BUYERS (Bulls) vs. SELLERS (Bears). Basically, it
FREE

McS Super Trend -This is one of the most popular classic trend indicators. It has a simple setting, allows you to work not only with the trend, but also displays the stop loss level, which is calculated by this indicator. Benefits:
Instruments: Currency pairs , stocks, commodities, indices, cryptocurrencies. Timeframe: М15 and higher. Trading time: Around the clock. Shows the direction of the current trend. Calculates the stop loss. It can be used when working with trading. Three types of n
FREE

Investment Castle Support and Resistance Indicator has the following features: 1. Dictates the direction of Buy or Sell trades based on Support and Resistance Levels automatically . 2. Candles stick colors will change to Red for Sell and Blue for Buy (Default settings, user can change from the inputs). 3. This indicator is built-in the Support & Resistance based Investment Castle EA which works with Psychological Key Levels "Support & Resistance".
FREE

Что такое Awesome Oscillator? Создателем данного индикатора является Билл Вильямс. Этот трейдер разработал собственную торговую систему. Её основой служит постулат: «Рынок движется хаотично. Какие-либо закономерности этого движения вывести довольно сложно, так как многое зависит от психологических факторов.» Поэтому Вильямс разработал собственные инструменты для анализа рынка.
Одним из таких инструментов и является индикатор АО. Это осциллятор, который дает возможность выявить силу текущего
FREE

The Expert Advisor for this Indicator can be found here: https://www.mql5.com/en/market/product/116472 Introducing the Rejection Candle MT5 Indicator, a robust tool designed to revolutionize your trading experience on the MetaTrader 5 platform. Built to pinpoint potential reversals with precision, this indicator offers unparalleled insights into market sentiment shifts, empowering traders to seize profitable opportunities with confidence. Key Features: Advanced Rejection Candle Detection: Uncov
FREE

Mostra a média móvel quando ADX > 20 e pinta de verde ou vermelho quando os valores de ADX estão subindo indicando tendência. Quando o ADX é menor que 20 indica movimento lateral consolidado. O indicador não define pontos de entrada, somente mostra a média colorida quando a tendência está se fortalecendo. Faz parte do grupo de indicadores do Indicador Tavim.
FREE

The script tries to determine the overall direction of the market, using smoothed Heiken Ashi candles. The coloring system (using bright and dark colors) is an attempt to detect strong market and weak market conditions. There's also an oscillator within the script
These are the features: Alert condition Features: You can now set alerts in the alert dialog for events like trend switch, trend strengthening and weakening; all for both Bullish and Bearish trend.
I also added the code for custo
FREE

Higher Timeframe Chart Overlay will display higher timeframe candles, including the number of candles high/low you specify.
You no longer need to switch timeframes to check the candles. Everything can be shown in one chart. Get Full Version - https://www.mql5.com/en/market/product/115682 Please feel free Contact me if you have any questions regarding this tool.
FREE

The MP Andean Oscillator is used to estimate the direction and also the degree of variations of trends. It contains 3 components: Bull component, Bear component and Signal component. A rising Bull component indicates that the market is up-trending while a rising Bear component indicates the presence of down-trending market. Settings: Oscillator period: Specifies the importance of the trends degree of variations measured by the indicator. Signal line per: Moving average period of the Signal line
FREE

Bar Countdown is a simple indicator for MetaTrader 5 that shows the time remaining of the each candle. It can be placed in any corner of the chart or near of the price close and it'll help you to know
if the current candle is ending. Choose the counter format between HR:MIN:SEC and MIN:SEC It is so easy to use, configure the color, size and counter position on the chart and that's it!!! The Countdown starts now!
Updates: 2021/02/28; v1.0: Initial release 2021/03/16; v1.1: Minor code changes
FREE

Провайдер сигнала, основанный на Дивергенциях RSI
со старшего таймфрейма.
Первые 3 буфера индикатора экспортируют сигнал.
Пользователь может выбирать таймфрейм на котором происходит
поиск дивергенций параметром 'RSI divergences timeframe'.
Индикатор использует несколько разных алгоритмов поиска дивергенций:
'Быстрый' алгоритм самый простой и, как следует из названия, быстрый.
'Строгий' алгоритм отфильтровывает больше шума, но работает медленнее предыдущего.
'Полный' алгоритм испо
FREE

Индикатор позволяет мгновенно определять текущий тренд по цвету и уровням Фибоначчи. Панель HTF показывает текущую тенденцию более высоких периодов, помогая определить силу тренда. Торгуйте по тренду при смене цвета свечей или торгуйте против тренда когда цена пробивает крайние уровни индикатора FIBO Trend PRO Преимущества FIBO Trend PRO Индикатор никогда не перекрашивает и не меняет свои значения Очень простой в использовании и интуитивно понятный Применим к любым символам: FX-валюты, акции, к
FREE

This indicator shows the direction of the trend and trend change. Ganesha Trend Viewer is a trend indicator designed specifically for gold and can also be used on any financial instrument. The indicator does not redraw. Recommended time frame H1. Ganesha Trend Viewer is perfect for all Meta Trader symbols. (currencies, metals, cryptocurrencies, stocks and indices..)
Parameter setting
MA Short Period ----- Moving Average short period MA Long Period ----- Moving Average long period Alerts ON
FREE

Индикатор показывает на графике круглые уровни . Их еще называют психологическими , банковскими или уровнями основных игроков. На этих уровнях происходит настоящая борьба быков и медведей, накопление множества ордеров, что приводит к повышенной волатильности. Индикатор автоматически подстраивается под любой инструмент и таймфрейм. При пробитии и последующем тесте уровня 80 - покупаем . При пробитии и последующем тесте уровня 20 - продаём . Цель - 00. Внимание. Из-за сильных уровней
FREE

The Indicator show Daily Pivot Points. It is possible to specify the number of days to display. For forex it doesn't consider the sunday session data. It is possibile to modify the color, style and width for every level. It is better to use this indicator with timeframe not higher than Н1. 4 Levels of support and resistance with also Intermediate Levels that is possible to hide.
FREE

Please check the " What's new " tab regularly for a complete and up-to-date list of all improvements + parameters. FREE indicator for my trading utility Take a Break . This indicator allows you to manage multiple other EAs with just one Take a Break EA instance. Simply specify the corresponding Chart Group in the indicator(s) and Take a Break EA settings and you are good to go.
Setup examples (Indicator + EA)
As a prerequisite, add the URL https://trading.custom-solutions.it to the list of
FREE

The traditional Money Flow Index indicator, this time, EA friendly . There are 3 buffers exposed that can be used by EAs to automatically analyze the Overbought and Oversold conditions of the quote. Just use the traditional iCustom() function to get these signals. This Money Flow Index calculation is based on the traditional Metaquote's MFI indicator.
SETTINGS
MFI Period Volume type to analyze (Real Volume or Ticks) Starting Overbought region Starting Oversold region
USING WITH EAs
Buffer
FREE

En esta versión, las alertas están funcionando y en la versión que publicó, la zona muerta de atr era solo una zona muerta sin atr, por lo que también la convirtió en una zona muerta de atr.
Indicator input parameters input int Fast_MA = 20; // Period of the fast MACD moving average input int Slow_MA = 40; // Period of the slow MACD moving average input int BBPeriod=20; // Bollinger period input double BBDeviation=2.0; // Number of Bollinger deviations input int Sensetiv
FREE

In this indicator, Heiken Ashi candles are calculated with the most optimal method. You can also customize the results by adjusting the amount of period and method input. But the most important advantage of this indicator is the adjustment of the time frame value. You can use this to calculate the Heiken Ashi chandels to See in time frames with lottery in the lower time chart. In this case, you get the best signal to buy or sell using two or more Heiken Ashi indicators with different timeframes
FREE

The Martinware Volume indicator plots a colored moving average over volume bars. The coloring uses three colors and can be done in different ways choosable by the user and is applied both to the average as to the volume bars.
Three types of coloring are possible: None: no coloring is done Increasing or decreasing: changes the color depending on the current value being bigger or lesser than the previous one Volume relative to average: colors vary if the current volume is bigger or lesser then
FREE

Индикатор Экспоненциальных скользящих средних (двойной или тройной) "Envelopes" - это инструмент технического анализа, разработанный для помощи вам в выявлении трендов и потенциальных точек разворота на финансовом рынке. Этот индикатор предоставляет трейдерам гибкость выбора между двумя типами экспоненциальных скользящих средних: двойное экспоненциальное скользящее среднее (DEMA) или тройное экспоненциальное скользящее среднее (TEMA).
Основные характеристики:
Двойное или тройное экспоненциал
FREE

Description This is an indicator for MT5 which has enhanced the "Fractals" indicator. "Fractals" indicator is included in MT5 by default but the draw line period is fixed at "5" and it cannot be modified. Thus I have reinvented the Fractals indicator with some useful function added. This tool will be useful especially for those who are learning how to draw good horizontal lines and wants to get some reference. Of course, those who are considering Fractals as an important horizontal line wil
FREE

Introducing the Raymond Cloudy Day indicator, a groundbreaking tool conceived by Raymond and brought to life on the MT5 platform by my coding expertise. This state-of-the-art indicator revolutionizes trading strategies by combining the robustness of an innovative calculation method that goes beyond traditional Pivot Points, with the precision of advanced algorithms. Source Code for EA: View Key Features: Innovative Calculation Method : At the heart of the Raymond Cloudy Day indicator
FREE

Индикатор ICT Zone Arrow Indicator представляет собой инновационный инструмент, разработанный на основе принципов ICT . Он обеспечивает простоту и эффективность в определении ключевых торговых зон на рынке. Основан на концепции 'killzone', этот индикатор предоставляет трейдерам важные уровни поддержки и сопротивления, обнаруживая места, где потенциально могут происходить сильные изменения направления цен. Индикатор ICT Zone Arrow Indicator предоставляет наглядные графические отметки, которые п
FREE

Based on Brazilian trader André Moraes' Difusor de Fluxo theory, the indicator is a more reliable version of the original MACD. It is a great confirmation indicator for Swing Trading and also can be used as a Day Trading tool. If you are not familiar with the concept or André's trading strategies, I strongly recommend his excelent book named "Se Afastando da Manada" in which he explains in detail how this indicator is used. Even if you don't know the Portuguese language it is not difficult to un
FREE

Панель трендов - это простой удобный инструмент, который будет отображать подтвержденное направление тренда таймфреймов M1 - D1 по десяти выбранным пользователем парам. Индикатор предназначен для добавления подтверждения направления в любую стратегию/шаблон, а затем также работает как чистый интерактивный интерфейс для быстрого переключения графика на другую пару или таймфрейм. Групповой чат: https://www.mql5.com/en/users/conorstephenson Пожалуйста, свяжитесь со мной после покупки, чтобы получи
FREE

This is the Chandelier Exit trend indicator applied to heiken ashi candles based on "G TREND GUNBOT" by "LUIS_GANDATA_G_TREND" on tradingview. Heiken ashi candles filter out many of the chops and therefore as an input to Chandelier Exit you achieve well filtered Buy and Sell signals. Also you can choose to apply the trend indicator to normal candles via input tab. (two in one indicator) This is a non-repaint and light processing load indicator. You can message in private chat for further change
FREE

The Supertrend etradro indicator is volatility based and is more of a trend following indicator in function. The ATR indicator, which is integrated into the calculation of the super trend, also calculates course gaps (gaps) and does not overlook them. This allows more accurate values to be calculated. When measuring volatility, the mean value of the current price serves as the basis. Since the Supertrend indicator features sliding stop and reversal lines, it is quite similar in function to the P
FREE

Описание :
мы рады представить наш новый бесплатный индикатор, основанный на одном из профессиональных и популярных индикаторов на рынке форекс (PSAR), этот индикатор является новой модификацией оригинального индикатора Parabolic SAR, в индикаторе pro SAR вы можете видеть пересечение между точками и графиком цены, это пересечение не является сигналом, а говорит о возможности окончания движения, вы можете начать покупать с новой синей точки, и разместить стоп-лосс за один атр до первой синей
FREE

This indicator is the converted Metatrader 5 version of the TradingView indicator "ATR Based Trendlines - JD" by Duyck. This indicator works by automatically and continuously drawing trendlines not based exclusively on price, but also based on the volatility perceived by the ATR. So, the angle of the trendlines is determined by (a percentage of) the ATR. The angle of the trendlines follows the change in price, dictated by the ATR at the moment where the pivot point is detected. The ATR percentag
FREE

PreCogniTrade : Un Indicador Técnico Avanzado para Predecir el Mercado (Fase Beta) El PreCogniTrade es un indicador técnico revolucionario diseñado para los traders que buscan una ventaja competitiva en los mercados financieros. Este indicador no solo analiza las tendencias actuales, sino que también predice los movimientos futuros de los precios con una precisión asombrosa, lo que lo convierte en una herramienta de incalculable valor para cualquier estrategia de trading. Características Pr
FREE

Revolution Martingale — это индикатор, предназначенный для торговли бинарными опционами на временном интервале M5. Особенности: Тайм-фрейм M5: Рекомендуется использовать индикатор на временном интервале M5 для оптимальной торговли. Открытие сделки: Сделки следует открывать только при появлении сигнала на 1-й свече после открытия. Сигналы: Синий ромбик указывает на возможность покупки по направлению вверх, а красный ромбик — на возможность покупки опциона по направлению вниз. Настроен для эффект
FREE

Индикатор PivotPointSuperTrend отлично показывает данные Тренд на основе мат данных от Pivot и ATR и очень удобен для входа в сделку и выставления стопов. Если кто то сможет добавить в код мултитаймфрем, я и многие пользователи будут очень Благодарны, то есть чтобы ондикатор показывал значение старшего таймафрема на графике младшего таймфрема, Заранее Спасибо!
FREE

Are you tired of trading without a clear direction ? Do market fluctuations and noise leave you feeling overwhelmed ?
Here is the solution you've been searching for! Imagine an indicator that simplifies trading, cuts through market noise, and provides crystal-clear signals. The Heiken Ashi OHLC Indicator does just that!
What does the Heiken Ashi OHLC Indicator do? It transforms traditional candlestick charts into a trader's dream. Instead of dealing with erratic price movements, you'll wi
FREE

这是一个组合指标分析趋势、支撑阻力、买卖点。运用了均线MA、布林带、KDJ、CCI、RSI。
主图上下线是布林带上下线,采用的是20周期和2.3标准差可以用来支撑阻力。 中间的是分析趋势的均线,趋势分析是用均线多周期: 为涨趋势,反之为下跌趋势。在同一种颜色,基本说明趋势没有发生变化。 子图是由 KDJ、CCI、RSI三个指标组成,大于70超买,小于30超卖, 智能提示是运用了算法,主要计算布林带, KDJ、CCI、RSI指标
有三个或四个指标超出市场常态就会发出提示行情可能反转。 子图指标运用了很多数据,刚刚开始加载会有点慢,耐心等待就可以 这个指标是子图指标,还要再下我发布的MMB分析,这样就刚刚好组成一套分析
电脑分辨率的文本大小请设置100%,不然字体会不一样
FREE

Volume Weighted Average Price (VWAP) is a trading benchmark commonly used by Big Players that gives the average price a Symbol has traded throughout the day. It is based on both Volume and price. This indicator contains Daily VWAP and MIDAS' VWAP, which means you are able to anchor the beggining of MIDAS' calculations and, therefore you will be able to use this methodology to study price versus volume moves after anchor point. You will be able to anchor up to 3 HIGH MIDAS VWAP's and 3 LOW.
Wis
FREE

Индикатор тренда (флета) с ценовым каналом.
Торговля Покупка - цена пересекла центральную линию снизу вверх (свеча закрылась выше линии), канал ориентирован горизонтально (желтая линия) или вверх (зеленая линия). Перевод в безубыток после достижения ценой противоположной границы канала. Закрытие позиции после формирования условий для продажи. Продажа - цена пересекла центральную линию сверху вниз (свеча закрылась ниже линии), канал ориентирован горизонтально (желтая линия) или вниз (красная ли
FREE

The Stochastic Oscillator is one of the main indicators used in the analysis of financial assets. It is one of the highlights in the study of price movements and can be an important indicator of changing trends in the capital market. Stochastic is an oscillator used to identify when an asset is overbought or oversold. It consists of two lines: %K, which is calculated from the highs and lows of a period, and %D, which is a moving average of %K. Our version contains color filling, which facilitate
FREE

Totally linked to the result of a movement and the duration he had. Its height records how many ticks the asset walked during a given movement, its width shows us the duration that movement had. Its configuration must be in line with the Weis Wave Indicator configuration to observe the movement force and can indicate a possible accumulation or distribution of the movement;
FREE

Overview The Time Trading Indicator AWT is designed for traders who often miss or overlook their trading opportunities. This tool helps users stay on top of their trading windows by providing timely alerts. Key Features User-friendly interface: Simple and intuitive design for easy navigation. Easy to use: Set it up quickly and start receiving notifications instantly. Alert and Push Notifications: Stay informed with real-time alerts and push notifications. Customizable Objects: Adjust the i
FREE

Highly configurable RSI indicator. Features: Highly customizable alert functions (at levels, crosses, direction changes via email, push, sound, popup) Multi timeframe ability Color customization (at levels, crosses, direction changes) Linear interpolation and histogram mode options Works on strategy tester in multi timeframe mode (at weekend without ticks also) Adjustable Levels Parameters:
RSI Timeframe: You can set the current or a higher timeframes for RSI. RSI Bar Shift: you can set th
FREE
Узнайте, как легко и просто купить торгового робота в MetaTrader AppStore - магазине приложений для платформы MetaTrader.
Платежная система MQL5.community позволяет проводить оплату с помощью PayPal, банковских карт и популярных платежных систем. Кроме того, настоятельно рекомендуем протестировать торгового робота перед покупкой, чтобы получить более полное представление о нем.
Вы упускаете торговые возможности:
- Бесплатные приложения для трейдинга
- 8 000+ сигналов для копирования
- Экономические новости для анализа финансовых рынков
Регистрация
Вход
Если у вас нет учетной записи, зарегистрируйтесь
Для авторизации и пользования сайтом MQL5.com необходимо разрешить использование файлов Сookie.
Пожалуйста, включите в вашем браузере данную настройку, иначе вы не сможете авторизоваться.