Смотри обучающее видео по маркету на YouTube
Как купить торгового робота или индикатор
Запусти робота на
виртуальном хостинге
виртуальном хостинге
Протестируй индикатор/робота перед покупкой
Хочешь зарабатывать в Маркете?
Как подать продукт, чтобы его покупали
Платные технические индикаторы для MetaTrader 4 - 97

Представляем индикатор Hull Crossover Alert для MT4, мощный инструмент, предназначенный для улучшения ваших торговых решений. Этот индикатор использует Hull Moving Average (HMA) и включает в себя расширенные функции для фильтрации ложных сигналов и предоставления быстрых и надежных предупреждений.
С помощью индикатора Hull Crossover Alert вы можете воспользоваться уникальными характеристиками скользящей средней корпуса. Его чувствительность к изменениям цен и плавная кривая помогают

Tendenceris - Индикатор тренда для MT4 Усилите свою торговлю с помощью Tendenceris ! Этот невероятный индикатор для MetaTrader 4 показывает вам тренды в режиме реального времени на разных таймфреймах. Не упустите ни одной возможности для торговли! Основные возможности: Определение и визуализация трендов на разных таймфреймах, от 1 минуты до 1 дня . Интуитивно понятный и простой интерфейс, который предоставляет четкую и конкретную информацию на графике. Обновление в режиме реального времени, чтоб
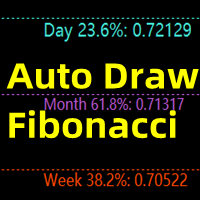
This indicator is mainly used to analyze future support and resistance levels for better trade analysis.
If the support level is effectively supported for many times, the market will break through the previous high point, and the effective trend breakout will be long.
After the down, the market cannot overshoot the pressure level for many times, and then goes down and breaks through the previous low price again, and the effective trend breaks through the short position.
When the marke
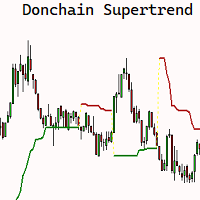
The SuperChannel indicator for MQL4 is a POWERFUL technical analysis tool designed to help you make informed trading decisions. BASED ON the popular SUPERTREND indicator, this indicator offers a UNIQUE approach Using HIGHS and LOWS over an n-period instead of the Average True Range (ATR) to construct the line. The SuperChannel indicator allows you to easily identify market trends and pinpoint optimal entry and exit points for your trades. By using historical highs and lows, the indicator plots a

Discover PM - Your Ultimate Precision Forex Indicator for Informed Trading Decisions! In the fast-paced and ever-changing world of Forex trading, having a reliable and accurate indicator can make all the difference between success and missed opportunities. Say hello to PM, the revolutionary Precision Momentum indicator, engineered to empower traders with unparalleled insights into market dynamics, volatility, and trends. At the heart of PM's power lies its ability to precisely identify moments

Pips forex - готовая торговая система . Этот индикатор показывает стрелками на графике когда и в каком направлении нужно открывать ордер. Если зеленая стрелка, значит открываем сделку на покупку, а если красная стрелка, значит открываем сделку на продажу. Все очень просто и достаточно эффективно. ТейкПрофит ставим 15-25 пунктов. СтопЛосс ставим на уровне точек. Когда точки передвигаются, мы сразу передкигаем СтопЛосс. Рекомендуемый таймфрейм для торговли М1 и М5. Это скальпинговая стратегия и он

"TOP G ARROWS" shows price reversal points designed for scalping and intraday trading.
Contains internal reversal filters (ATR, HHLL, RSI). Can be used on all time frames and trading instruments. Can be used on M1, M5, M15 time frames for scalping or M30, H1, H4 for intraday trading, Recommended for M30 and H1. The arrows are built on candle close (appears on previous bar at the open of the new candle)

Thanks to this indicator, you can easily see the new ABCD harmonic patterns in the chart.
If the two price action lengths are equal, the system will give you a signal when it reaches the specified level.
You can set the limits as you wish. For example, You can get the signal of the price, which occurs in the Fibonaci 38.2 and 88.6 retracements, and then moves for the same length, at the level you specify. For example, it will alarm you when the price reaches 80% as a percentage.
In vertic
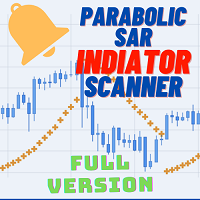
Welcome to the world of advanced trading with the Parabolic SAR Scanner Full! Maximize your trading experience with our powerful MT4 indicator designed for seamless analysis and real-time insights. Key Features: Effortless Parabolic SAR Scanning: Unlock the full potential of the Parabolic SAR Scanner Full by effortlessly scanning multiple currency pairs. Receive instant alerts when specific Parabolic SAR conditions are met, ensuring you stay ahead of market movements. Comprehensive Dashboard In
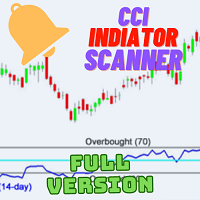
Welcome to the world of advanced trading with the CCI Multicurrency Scanner! Elevate your trading experience with our powerful MT4 indicator designed for seamless analysis and real-time insights. Key Features: Effortless CCI Scanning: Unlock the full potential of the CCI Multicurrency Scanner by effortlessly scanning multiple currency pairs. Receive instant alerts when specific Commodity Channel Index (CCI) conditions are met, ensuring you stay ahead of market movements. Comprehensive Dashboard

If you have been anywhere near Forex forums or social media lately, you have no doubt been hearing people talk about Smart Money Concepts (SMC) trading. You may be wondering what SMC is, and whether it deserves all the hype. In this post, we will introduce Smart Money Concepts trading to you so you can make an informed decision about whether or not to give this strategy a try in your own trading. What is SMC Forex trading? Smart Money Concepts (SMC) is one of many forex trading methods. SMC
The "Wilder's Average True Range (ATR)" tool is used to measure the volatility of a financial instrument. It was developed by J. Welles Wilder Jr. and is commonly used by traders to assess the potential price range and volatility of an asset. The ATR indicator provides valuable information for setting stop loss levels, determining position sizes, and identifying potential breakouts. Here's how to use the "Wilder's Average True Range (ATR)" tool: Install the indicator: Add the ATR indicator to yo

The Time Segmented Volume (TSV) is a technical indicator that measures the volume of a financial instrument within specific time segments. It helps traders identify buying and selling pressure based on volume analysis. The TSV indicator can be used as part of a trading strategy to generate trade signals and confirm market trends. Let's explore how to use the TSV indicator as a trading strategy. To begin, add the TSV indicator to your trading platform. The TSV is typically represented as a line o

The Chaikin Oscillator is a technical indicator developed by Marc Chaikin that combines price and volume data to measure the accumulation and distribution of a financial instrument. It aims to identify potential buying and selling opportunities in the market. The Chaikin Oscillator is calculated by subtracting a 10-day exponential moving average of the Accumulation Distribution Line (ADL) from a 3-day exponential moving average of the ADL. Here's how to use the Chaikin Oscillator indicator in tr

Indicator show best signals for buy and sell orders. Indicator uses only 2 inputs: DEMA Fast Period - fast double exponential moving average period DEMA Slow Period - slow double exponential moving average period Crossings of fast and slow double double exponential moving averages shows buy and sell signals, which are drawn as green and magenta arrows respectively.

Indicator show best signals for buy and sell orders. Indicator uses only 3 inputs: DEMA Fast Period - fast double exponential moving average period DEMA Slow Period - slow double exponential moving average period DEMA Trend Period - trend double exponential moving average period
Position of price according to trend double double exponential moving average and crossings of fast and slow double double exponential moving averages shows buy and sell signals, which are drawn as gree

Indicator show best signals for buy and sell orders. Indicator uses only 2 inputs: PEMA Bounce Period - bounce percentage exponential moving average period PEMA Confirm Period - confirm percentage exponential moving average period Positions of price according to bounce and confirm percentage exponential moving averages and directions of bounce and confirm percentage exponential moving average shows buy and sell signals, which are drawn as green and magenta arrows respectively.
Automated Supply and Demand Trading Edge MT4 These videos demonstrate how we apply the supply and demand system to our latest trading review and market analysis. US Tech 100 Index Trade Setup time laps 12/6/2023. https://youtu.be/zHdjHnr3GNo https://youtu.be/JJanqcNzLGM , https://youtu.be/l70MIHaQQa4 , https://youtu.be/pg0oiT5_8y0 Enhance your Trading Strategy with the Supply and Demand Trading Edge MT4. Gain a competitive market advantage with the Supply and Demand Trading Edge MT4

The indicator has been designed to function on any time-frame and any pair. This regime filter will help the trader better evaluate whether the current market is trending, and in which direction. It quickly reacts to changes in market dynamics using a series of advanced calculations. The user is able to select whether the calculation remains standard, or if a further filter constraint is added to the calculation. A Yellow moving average of the signal has been included for the trader to smoot
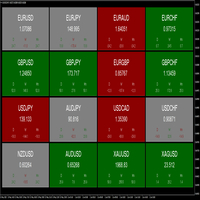
The dashboard indicator has been designed to quickly show the trader the price movements of various currency pairs. The user is able to select 3 different timeframes to analyse. When the pip difference for each respective timeframe is either positive or negative, the pair block will be coloured green or red respectively. This allows the trader to view which timeframes are in agreement, as well as the pip movements therein. A good visual tool to view multiple pairs and timeframes at once. T
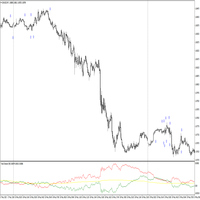
The indicator has been designed to function on any time-frame and any pair, although it is best suited for 5-minute charts. This trend filter will help the trader better evaluate whether the current market is trending, and in which direction. A dynamic filter threshold has been added to help the trader avoid choppy market conditions, and add greater confidence when entering, with an added functionality of plotting signal arrows on the chart to aid in detecting possibly entries. The Yellow in
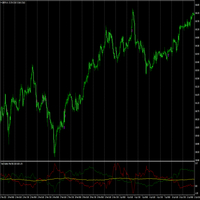
The indicator has been designed to function on any time-frame and any pair, although it is best suited for currency pairs on 5-minute charts, and used in conjunction with the Trend Direction Filter Indicator . This trend volatility filter will help the trader better evaluate whether the current market is trending, and in which direction. A dynamic filter threshold has been added to help the trader avoid choppy market conditions, and add greater confidence when entering, with an added functiona
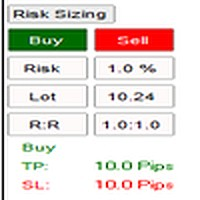
The indicator has been designed to function on any time-frame and any pair. The user is able to input their desired risk percentage per trade based on their account size, and choose whether they wish to calculate risk based on a limit order or market order. When initialised, a non-invasive button will appear on the left-hand side of the chart. Upon selection, a drop down will appear with a Buy and Sell button, these will in turn place movable lines on the chart that are used to appropriately
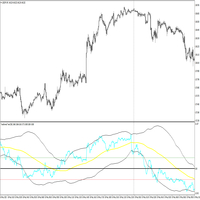
The indicator has been designed to function on any time-frame and any pair, although it is best suited for 5-minute charts. This price transformation will help the trader better evaluate whether the current market is trending, and in which direction. A dynamic filter has been added to help the trader avoid possibly entering against the trend. Two filter threshold lines may enable the trader to avoid choppy or flat market conditions. The Yellow indicator line is the filter and the Blue indica
Хотите улучшить свою торговлю с помощью индикатора блоков ордеров? Блоки ордеров — это области рынка, в которых скапливаются ордера на покупку или продажу, которые могут вызвать изменение тренда или сильные движения. Выявление этих блоков ордеров может быть очень полезным для поиска возможностей входа и выхода, а также для управления рисками и прибылью. Но поиск этих блоков заказов вручную может быть трудным и утомительным. Вот почему мы создали Oberis, индикатор блоков ордеров для MetaTrader 4,
Supply and Demand Tracker MT4
US PPI, Fed Interest Rates, and FOMC Trade Setup Time Lapse: U.S. dollar(DXY) and Australian dollar vs U.S. dollar(AUD/USD) https://youtu.be/XVJqdEWfv6s May CPI Trade Setup Time Lapse: Gold, Euro/US dollar, US Tech 100, and USDX Experience the power of our cutting-edge supply and demand system as we delve into the captivating world of market dynamics surrounding the release of the consumer price index (CPI). Our system, built on the principles of supply and dema
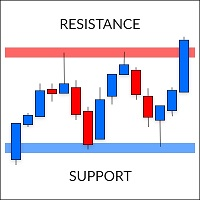
Supports and Resistances is a quick and easy tool for finding support and resistance levels. It was created according to the "run and forget" idea to automate daily routines and speed up the decision-making process.
The indicator analyzes the chart and determines all the zones found with the power assigned to them. Power in this case means the amount of confirmation. The zones are classified into three types: weak, normal and strong - each with a different color. The program implements two ty

Представляем Hull Moving Average Scanner , продвинутый мультисимвольный и мультитаймфреймный индикатор для MT4. Этот мощный и универсальный инструмент предназначен для улучшения ваших торговых решений. Индикатор включает в себя Hull Moving Average (HMA) и предлагает дополнительные функции для быстрого и надежного оповещения. С помощью сканера скользящей средней корпуса вы можете воспользоваться уникальными характеристиками скользящей средней корпуса для нескольких валютных пар и таймфре

Introducing the Gold Multiply Funds EA - a revolutionary trading tool that is based on the powerful principle of compounding. MT4 Version : https://www.mql5.com/en/market/product/90177
MT5 Version : https://www.mql5.com/en/market/product/95784
Brief description EA for XAUSUD: AI & machine learning detect/respond to market trends with precision. Trading Strategy Advanced pattern recognition using AI and Machine learning for profitable trades 65-70% correct prediction accuracy in 10
Представляем индикатор Draw On Chart: раскройте свою креативность на графиках!
Устали бороться с проблемами аннотирования ваших торговых графиков, пытаясь понять свои анализы или эффективно передать свои идеи? Вам больше не придется искать решение! Мы рады представить индикатор Draw On Chart - революционное средство, позволяющее легко рисовать и аннотировать непосредственно на графиках всего лишь несколькими щелчками или движениями вашего пера.
Наш инновационный индикатор Draw On Chart разр
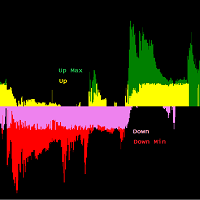
Trend Reversal Identifier es un indicador de análisis profundo que no repinta de alto rendimiento que sirve para detectar y confirmar Pullbacks, Soportes y Resistencias. También posee un alto valor para detectar divergencias al tener los movimientos alcista y bajistas dados por separado con mucha claridad. Debido a la estructura implícita del algoritmo es plenamente válido para cualquier par/periodo y no necesita configuración. Tenemos dos zonas principales: Zona Up y Zona Down, las cuales a s

URGENT REMINDER> Only 5 remaining Copies for next unlimited price to be 360$ (THIS IS A SPECIAL OFFER TOOL) If you are looking for FAST , RELIABLE and PROFITABLE indicator to help you take easy trades then this is the tool to go with. Trading is very tricky, frustrating, confusing, embarrassing and even can make you go broke if you approach the market with gambling mindset, poor entry and exit strategies, unreliable indicators or signals, poor money management skills and lack of knowledge. Many
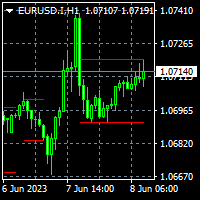
To get access to MT5 version please contact via private message. This indicator is not a standard indicator and you may get into trouble installing it. Please contact via private chat if you face trouble. This is exact conversion from TradingView: "Consolidation Zones - Live" by "LonesomeTheBlue". This is a light-load processing indicator. Updates are available only upon candle closure. Buffers are available for processing in EAs. It is a repaint indicator. So previous buffer values do not repre
Вы устали от использования ненадежных индикаторов бинарных опционов, которые дают ложные сигналы, приводящие к потерям и разочарованию? Ищите не дальше, чем индикатор CLOCK - лучший индикатор бинарных опционов, доступный для торговой платформы MT4!
Благодаря своему передовому алгоритму и мощным инструментам технического анализа, индикатор CLOCK - это идеальный инструмент для торговли как для новичков, так и для опытных трейдеров. Он точно предсказывает тенденции на рынке и определяет прибыльн

The Binary Tend Follower indicator has been designed especially for Binary options trading. The best time frame to use the indicator on is a 1M chart with 1Min expiry's as soon as the signal candle closes. There is no need to over complicate your trading as all the thinking has been done for you. The indicator was designed as simple as possible to take out all the subjectivity of trying to follow a complicated strategy, and allowing the trader to focus on extremely simple entry's. Buy: When th

Испытайте мощь Parabolic Breakout Scanner Pro, усовершенствованного мультисимвольного и мультитаймфреймового индикатора, который изменит ваше торговое путешествие. С непревзойденной точностью этот индикатор позволяет определять прорывы SAR и получать своевременные оповещения об оптимальных точках входа и выхода. Откройте для себя удобство удобной панели инструментов, настраиваемых параметров, автоматического открытия графиков и всеобъемлющей системы оповещений, которая позволяет вам оставаться н

Scalping Entry Points - ручная торговая система, которая может подстраиваться под движения цены и давать сигналы для открытия сделок без перерисовки. Направление тренда индикатор определяет центральным уровнем поддержки и сопротивления. Точечный индикатор предоставляет сигналы для входов и выходов. Подходит для ручной торговли внутри дня, скальпинга и бинарных опционов. Работает на всех тайм-фреймах и торговых инструментах.
Индикатор дает несколько типов оповещений.
Как использовать продукт

Jerk Trend это новый продукт, который позволяет идентифицировать текущую рыночную фазу (восходящий тренд, нисходящий тренд или флет). Представляет собой типичную стратегию инвесторов, которая обычно указывает на изменение тренда от медвежьего к бычьему. Инструмент, который позволяет определить направление и силу тренда. В отличие от большинства индикаторов Jerk Trend находит более длительные тренды и дает меньше ложных сигналов.
Данный индикатор отображает стрелки разных цветов в зависимости
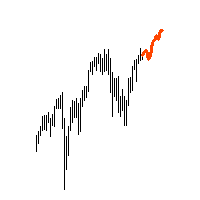
"AV Forecast" is a preview or forecast indicator for MetaTrader 4, which draws forecast future price changes on the chart from historical data. To do this, it primarily uses the everyday rhythm and the seasonality of the year. For timeframes below H1 closer dates can be selected. The lines for calculation can be made visible.
Settings:
- Draw line for x candles: draw x candles in the future
- Show all lines: yes/no
- Look back years or mixed (> H1 same): one year back or less beneath H

Представляем вам индикатор самолета F-16, передовой инструмент MT4, разработанный для революционизации вашего торгового опыта. Вдохновленный беспрецедентной скоростью и точностью истребителя F-16, этот индикатор объединяет передовые алгоритмы и передовую технологию, чтобы обеспечить беспрецедентную производительность на финансовых рынках. С индикатором самолета F-16 вы будете парить над конкурентами, так как он обеспечивает анализ в реальном времени и генерирует высокоточные торговые сигналы. Ег

Готовая торговая стратегия на сигналах индикатора "Myforexfunds":
1. Точка входа на рынок: Когда индикатор рисует синюю линию, открываем крышку на покупку (длинную). Когда индикатор рисует красную линию, открываем крышку на продажу (короткую). Входить на рынок можно при закрытии бара, когда образуется новый сигнал.
2. Точка выхода с рынка: Установить-стоп-лосс (стоп-лосс) на старое расстояние от входной точки, исключающие потенциальные потери в случае неправильного направления рынка. Наприм

Индикатор Accurate Werewolf отслеживает рыночные тренды игнорируя резкие колебания и рыночный шум. Индикатор может работать как для точек входа, так и как фильтр.
Индикатор Accurate Werewolf отражает информацию в наглядном виде. Поможет в поиске точек входа при анализе. Подходит для торговли на малых таймфреймах, потому как он игнорирует внезапные скачки цен или коррекции ценового движения благодаря снижению рыночного шума вокруг среднего значения цены.
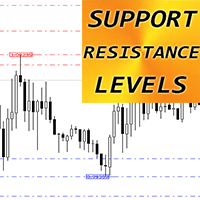
Forex Indicator "Support Resistance Levels" for MT4 Indicator " Support Resistance Levels" is very useful auxiliary indicator for trading 'Support' and 'Resistance' are important zones on chart respected by price
Support level is where the price regularly stops falling and bounces back up
Resistance level is where the price normally stops rising and dips back down I ndicator " Support Resistance Levels" shows the recent levels: Resistance levels - red lines. S upport levels - blue lines

Индикатор тренда Shock Trend, показывает моменты для входа в рынок стрелками. Это гибридный индикатор, так как основывается на сигналах нескольких двух достаточно известных продуктов - индикатор среднего истинного диапазона, который определяет диапазон минимальных и максимальных ценовых колебаний, а также цен закрытия. В результате - указывает текущую рыночную волатильность. Также индикатор семейства осцилляторов. Индикатор помогает рассчитать уровни перепроданности и перекупленности торгового

Love Trend индикатор, показывающий области покупок и продаж. Индикатор следует за движением цены вокруг цены открытия. Он также отображает информацию о тренде, следующем за пробоем минимума и максимума. У индикатора очень простая, но эффективная графика: выше цены открытия отображается оранжевая точка цвет, ниже цены открытия - синяя. Индикатор включает также звуковое оповещение и всплывающее окно, оповещающие о закрытии свечи в этих важных уровнях. Индикатор позволит всегда быть в курсе тренда

The ICT Concepts indicator regroups core concepts highlighted by trader and educator "The Inner Circle Trader" (ICT) into an all-in-one toolkit. Features include Market Structure (MSS & BOS), Order Blocks, Imbalances, Buyside/Sellside Liquidity, Displacements, ICT Killzones, and New Week/Day Opening Gaps. It’s one kind of Smart money concepts. USAGE: Please read this document ! DETAILS Market Structure Market structure labels are constructed from price breaking a prior extreme
Market screener: Spread and Swap, for selected Symbols. You can customize the list: set only the Symbols (currency pairs) that are needed. The number of Symbols is unlimited. The list can be sorted in ascending or descending order (Symbol name). The panel can be moved to any place on the chart. You can also minimize the panel. Displayed values: Current market price (BID); Spread size; Swap, for Long positions; Swap, for Short positions; Overall P/L of the entire account; My #1 Utility : includ

TrendXplorer indicator is designed to provide valuable insights into market trends, helping you navigate the dynamic world of trading with confidence. Key Features: Accurate Trend Analysis: TrendXplorer utilizes a special algorithm to analyze trends combined with price action. This enables easier trend detection and is less prone to change during price manipulation. Built-in Risk Calculator: Take control of your risk management with TrendXplorer's built-in risk calculator. This feature assesses

Форекс-индикатор "Search for a reversal" представляет собой технический инструмент, разработанный для трейдеров, занимающихся скальпингом на валютном рынке Форекс. Скальпинг - это стратегия торговли, которая направлена на получение небольших прибылей от частых сделок на краткосрочных временных интервалах. Индикатор "Search for a reversal" помогает трейдерам идентифицировать оптимальные точки входа и выхода из рынка, учитывая краткосрочные тренды и колебания цен.
Основная цель индикатора "Sear

The indicator is like a mother-in-law, who talks often, talks a lot and often inappropriately.
The indicator, in addition to giving us an entry signal on parameters which I will then list, monitors the trend of the hourly timeframe, OSMA to understand the entry direction, RSI to sense any overbought or oversold conditions from which to abstain, ATR for the volatility and ADX for the trend.
Indicator not recommended for newbies.
Only the human judgment of these parameters, combined with the e

Индикатор Structural Trend помогает анализировать рынок на выбранном временном интервале. Он определяет господствующую тенденцию. Прост в настройке и работает на всех парах и всех временных интервалах. Индикаторы тренда дают возможность классифицировать направление ценового движения, определив его силу.
Structural Trend решение для торговли по трендам и фильтрации со всеми важными функциями инструмента тренда, встроенными в один инструмент! Индикатор Structural Trend является разработкой для

"Dragon's Tail" представляет собой интегрированную торговую систему, а не просто индикатор. Эта система анализирует каждую свечу по минутам, что особенно эффективно в условиях высокой волатильности рынка. Система "Dragon's Tail" определяет ключевые моменты на рынке, обозначенные как "сражения быков и медведей". Основываясь на этих "сражениях", система дает рекомендации по направлению сделки. В случае появления стрелки на графике, это сигнализирует о возможности открытия двух сделок в указанном н

TruRange is a Next-Level trend and range detection created from algorithms based on price action. No other indicator apart from ATR is used in the computing of the main line indicator
It separates Trending and Ranging market conditions without any lag. It's good to separate mean reverting strategies from trending/breakout strategies.
Settings : Bars : number of bars to compute Sensitivity : a lower value will have longer range periods while a higer value will have more smaller ranging peri
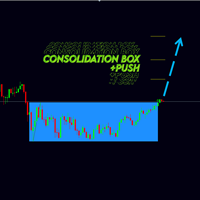
Новая версия индикатора консолидаций Consolidation box Generator. Предыдущая версия тут . Примеры настроек на индикатор тут . На данный момент этот инструмент анализа рынка уже нельзя назвать просто индикатором. Потому как это торговая стратегия. Наше ноу-хау заключается в том, что данный индикатор не требует огромного количества тестов в тестере стратегий. В индикаторе реализован блок статистики - при нанесении на график вам сразу будет видна результативность работы стратегии. Вы можете настро
The Relative Currency Strength Indicator is a tool designed to analyze and compare the strength of a quote currency against four different currency pairs on a selected timeframe. It provides a visual representation of the relative strength of currencies, helping traders identify potential trading opportunities. Key Features: Customizable quote currency: Select a specific currency to measure its strength against multiple currency pairs. Multi-timeframe analysis: Choose the desired timeframe to ev

С помощью алгоритма форекс индикатора Arrow Effect, вы можете достаточно быстро понять, какая именно тенденция в данный момент развивается на рынке.Индикатор Elephant сопровождает длинные тренды, можно использовать без ограничений по инструментах или таймфреймах. При помощи этого индикатора можно пытатся прогнозировать будущие значения. Но основное применение индикатора заключается в генерации сигналов на покупку и продажу. Индикатор отслеживает рыночный тренд с игнорируя резкие колебания рынка
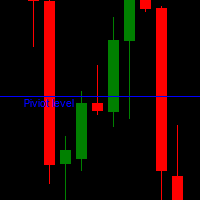
Уважаемый Форекс Трейдер,
Мы все знаем, что наши валютные продукты остаются в центре внимания рынка форекс с момента его создания. Спасибо нашим подписчикам, которые присылают нам результаты своей торговой истории в удобном для просмотра формате. Вы также видели сумасшедшие стабильные пипсы, которые эти подписчики генерируют ежедневно. Все сводится к тому, готовы ли вы изменить свою торговлю к лучшему в этом году. Почему бы не включить какой-либо из наших торговых пакетов в свой инвестиционны

XP Speed Meter the best indicator that measures the price/tick’s currency speed for you. It will give you the ability to know when the pair moving fast or slow . So, you can trade or not trade. It’s very important tool for scalper traders – news traders. Even for trend traders it will be useful to know if the market is trending fast or slow . XP Speed Meter is better than the volume type indicators of course. Because it shows the currency speed on the run-time without any lacking like what the v

Dear traders I am happy to introduce to you my new tool called "Brilliant Oscillator" Indicator. This is one of the indicators that can be used as a stand alone indicator. WHAT I LIKE ABOUT THIS TOOL IS Fast and reliable signals Purpose The purpose of this tool is to assist both newbie and Advanced traders to analyze the market with high level of accuracy in both bearish and bullish market trends. The inputs In the input section you will be able to change colors of the indicator only. Currency p

Dear Traders here is my another tool called the "Sell Index". My goal is to come up with different tools to help you trade successfully. No matter the strategy and trading style you use but what matters most at the end is "making money out of the market". Go with a strategy that works for you and it should be the one you find easy to use. The philosophy behind this tool is "Focus only on sell signals" meaning that if the market is currently bearish why should you focus on buy signals?. Sometime

Dear Traders here is my another tool called the "Buy Index". My goal is to come up with different tools to help you trade successfully. No matter the strategy and trading style you use but what matters most at the end is "making money out of the market". Go with a strategy that works for you and it must be the one you find easy to use. The philosophy behind this tool is "Focus only on buy signals" meaning that if the market is currently bullish why should you focus on sell signals?. Someti
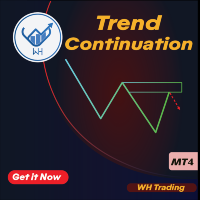
Вы устали упускать выгодные рыночные тренды? Вы хотели бы иметь надежный инструмент, который мог бы точно и точно определять продолжение тренда?
Не смотрите дальше! Наш индикатор продолжения тренда призван усилить вашу торговую стратегию и помочь вам опережать конкурентов.
Индикатор продолжения тренда — это мощный инструмент, специально созданный для помощи трейдерам в выявлении и подтверждении паттернов продолжения тренда на различных финансовых рынках.
Независимо от того, торгуете ли в
Candles Fusion is a powerful MT4 indicator that enhances your trading analysis by displaying higher timeframe candles on the current timeframe.
This unique feature provides traders with a comprehensive view of price action across different timeframes, enabling them to make more informed trading decisions.
Features:
Multi-Timeframe Overlay. Customizable Timeframe Selection. Clear Visualization and color candle selection . Real-Time Updates. User-Friendly Interface.
Candles Fusion is

Индикатор тренда Riko Trend - революционное решение для торговли по трендам и фильтрации со всеми важными функциями инструмента тренда, встроенными в один инструмент! Индикатор Riko Trend хорош для любого трейдера, подойдет любому трейдеру как для форекс так и для бинарных опционов. Ничего настраивать не нужно все отточено времинем и опытом, отлично работает на во время флета та и в тренде.
Индикатор тренда Riko Trend это инструмент технического анализа финансовых рынков, отражающий текущие о

ForceX Trend - трендовый индикатор который позволяет эффективно определять направление текущего тренда, а также выявлять потенциальные точки его разворота. Индикатор дает возможность классифицировать направление ценового движения, определив его силу. Решение этой проблемы помогает вовремя войти в рынок и получить желаемый результат.
Начнем с преимуществ.
Позволяет определить текущий тренд. Вы можете достаточно быстро понять, какая именно тенденция в данный момент развивается на рынке; Может
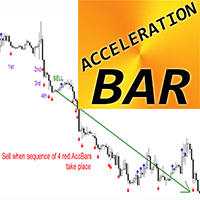
Forex Indicator Acceleration Bar for MT4 - able to catch huge trends Indicator " Acceleration Bar" is very powerful tool for Trend trading - market flat influence is minimized Bullish Acceleration Bar (blue) is bar on chart which has Max higher than max of previous 5 bars and which has Min lower than min of next 5 bars Bearish Acceleration Bar (red) is bar on chart which has Min lower than min of previous 5 bars and which has Max higher than max of next 5 bars TREND TRADING: Buy signal - w
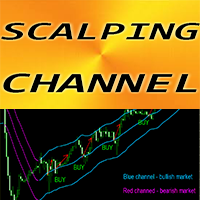
Forex Indicator "Scalping Channel" for MT4 Scalping Channel has ATR-based volatility borders Great to use for scalping trading: Enter in trades via arrangement pending limit order on middle line Consider Bullish entries when green steady upward channel takes place and at least 1 candle was closed above top border (see pictures) C onsider Bearish entries when red steady downward channel takes place and at least 1 candle was closed below bottom border (see pictures) // More great Expert Advisors
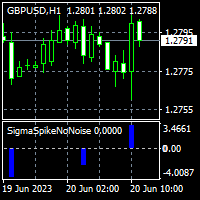
To get access to MT5 version please click here . - This is the exact conversion from TradingView: "Sigma Spikes No Noise" by "irdoj75" - This is a light-load processing and non-repaint indicator. - All input options are available. - Buffers are available for processing in EAs. - You can message in private chat for further changes you need. Thanks for downloading

Super Scalp Indicator MT4 is a unique trend reversal 100% non-repainting multi-algo indicator that can be used on all symbols/instruments: forex, commodities, cryptocurrencies, indices, stocks . Super Scalp Indicator MT4 will determine the current trend at its early stages, gathering information and data from up to 10 standard algos When indicator give a valid buy or sell signal, a corresponding arrow will be printed on the chart, open trade at start of the next candle/bar
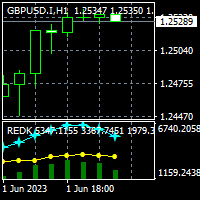
To get access to MT5 version please click here . This is the exact conversion from TradingView: "RedK_Supply/Demand Volume Viewer v3.0" by "RedKTrader" This is a light-load processing and non-repaint indicator. All input options are available. Buffers are available for processing in EAs. You can message in private chat for further changes you need. Thanks for downloading
MetaTrader Маркет предлагает каждому разработчику торговых программ простую и удобную площадку для их продажи.
Мы поможем вам с оформлением и подскажем, как подготовить описание продукта для Маркета. Все продаваемые через Маркет программы защищаются дополнительным шифрованием и могут запускаться только на компьютере покупателя. Незаконное копирование исключено.
Вы упускаете торговые возможности:
- Бесплатные приложения для трейдинга
- 8 000+ сигналов для копирования
- Экономические новости для анализа финансовых рынков
Регистрация
Вход
Если у вас нет учетной записи, зарегистрируйтесь
Для авторизации и пользования сайтом MQL5.com необходимо разрешить использование файлов Сookie.
Пожалуйста, включите в вашем браузере данную настройку, иначе вы не сможете авторизоваться.