DI Support resistance
- Indicadores
- Dmitry Iglakov
- Versão: 1.20
- Atualizado: 29 setembro 2022
- Ativações: 5
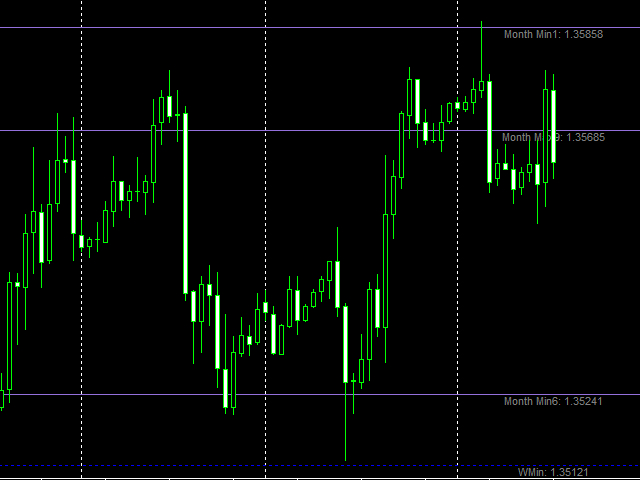
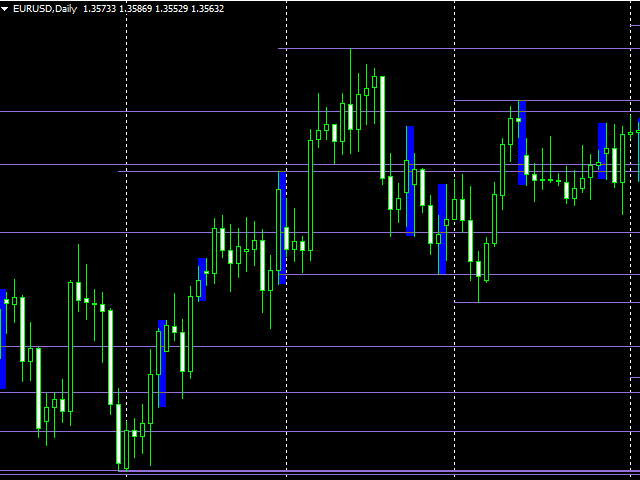
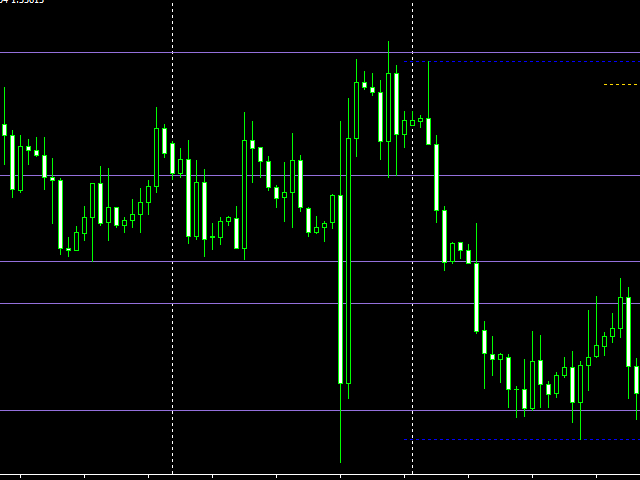
O indicador exibe os níveis de suporte e resistência no gráfico.
Características:
- Ele exibe os níveis de suporte e resistência para os últimos 12 meses.
- Mostra a máxima e a mínima da última semana.
- Mostra o valor da "MA 200".
- Mostra lacunas com um filtro pré-definido.
As definições do indicador:
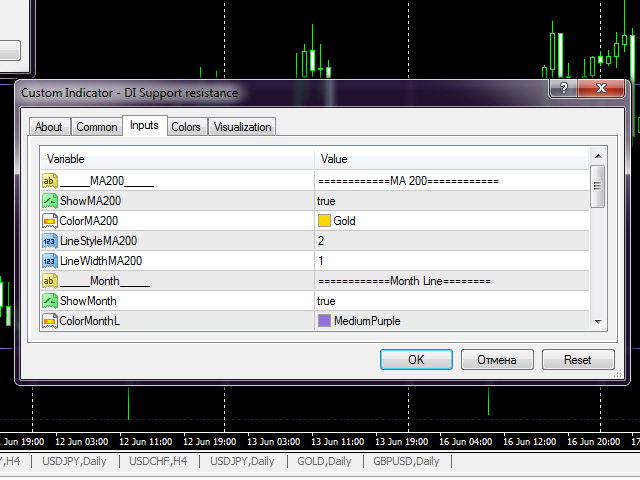
- ShowMA200 - mostra/oculta o valor MA 200.
- ColorMA200 - a linha de cor MA 200.
- LineStyleMA200 - estilo de linha da MA 200.
- LineWidthMA200 - largura da linha MA 200.
- ShowMonth - mostra/oculta os níveis de suporte/resistência.
- ColorMonthL - cor da linha.
- LineStyleMonthL - estilo de linha.
- LineWidthMonthL - largura da linha.
- ShowWeek - mostra/oculta os níveis da máxima/mínima da semana passada.
- ColorWeekL - cor da linha.
- LineStyleWeekL - estilo de linha.
- LineWidthWeekL - largura da linha.
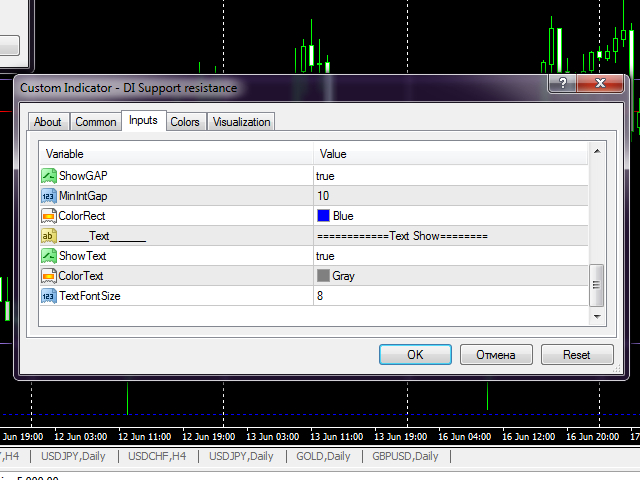
- ShowGAP - mostra/oculta os gaps
- MinIntGap - diferença de preço mínimo em pontos para mostrar.
- ColorRect - cor da linha.
- ShowText - mostra/oculta as descrições do nível.
- ColorText - cor do texto.
- TextFontSize - o tamanho da fonte do texto.


O usuário não deixou nenhum comentário para sua avaliação