Dmitry Iglakov / Vendedor
Produtos publicados

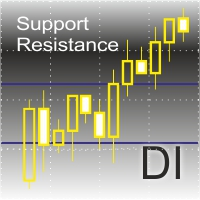
O indicador exibe os níveis de suporte e resistência no gráfico.
Características: Ele exibe os níveis de suporte e resistência para os últimos 12 meses. Mostra a máxima e a mínima da última semana. Mostra o valor da "MA 200". Mostra lacunas com um filtro pré-definido.
As definições do indicador: ShowMA200 - mostra/oculta o valor MA 200. ColorMA200 - a linha de cor MA 200. LineStyleMA200 - estilo de linha da MA 200. LineWidthMA200 - largura da linha MA 200. ShowMonth - mostra/oculta os níveis

The indicator searches Price Action patterns and puts corresponding labels on a chart. It can display only certain selected patterns.
Determined Patterns: Inside Bar. Determinative bullish bar Inside Bar. Determinative bearish bar BUOVB (engulfing). Bullish setup BEOVB (engulfing). Bearish setup DBLHC. Bullish setup (bars with similar Lows and higher closure) DBHLC. Bearish setup (bars with similar Highs and lower closure) Pin Bar. Bullish setup Pin Bar. Bullish setup Pin Bar. Bearish setup Pi

Данный индикатор показывает объем каждого бара (видимый диапазон) в пунктах. Гибкие настройки отображения значений. Возможна настройка параметров показа. Индикатор создавался для личного пользования, анализа графиков. Параметры: Color - цвет текстовых меток; Position - позиция метки: 0 - снизу, 1 - сверху; FontSize - размер шрифта; Angle - угол наклона текста; GapPoints - отступ по вертикальной оси.
FREE

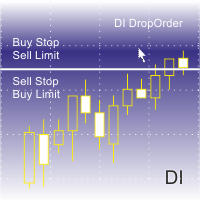
This is a script for quick and easy placement of orders (Buy Stop, Sell Stop, Buy Limit, Sell Limit) to the user's choice. Simply drop the script on a chart part where you want to place the selected order. You can also set the automatic calculation of the lot size for the position, depending on the risk as a percentage. Also, you can use the script as a supplement to your trading strategy, since it is possible to specify a magic number. Features Fast placing of a required order (Buy Stop, Sell S
FREE

This indicator displays each bar's volume in points as a histogram. The second version of the indicator. Now it is represented as an oscillator. It is more informative and functional. At that it does not load the main chart. GitHub It displays: bar's volume in points as a histogram (buffer 0) average value of the volume for the whole period (buffer 1) bars upper than the client average value with another color (buffer 2) average value of the amount of bars set by a user (buffer 3) Also: setting
FREE

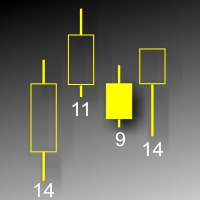
Este indicador mostra o volume de cada barra (intervalo visível) em pontos. Os parâmetros de exibição são customizáveis. O indicador foi desenvolvido para uso pessoal (análise de gráfico). Parâmetros: ColorL - cor dos rótulos de texto. Position - rótulo da posição: 0 - abaixo, 1 - acima. FontSize - tamanho da fonte. ANGLE - ângulo de inclinação do texto.
FREE