• Visão global
  • Comentários (6)
  • Discussão (6)

Multi Time Frame Moving Average Indicator

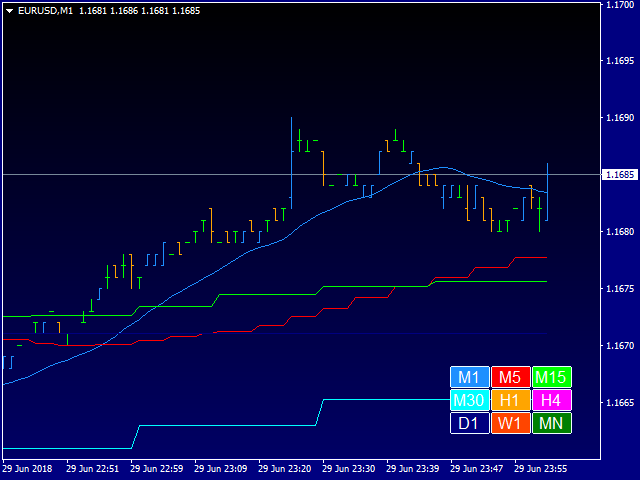
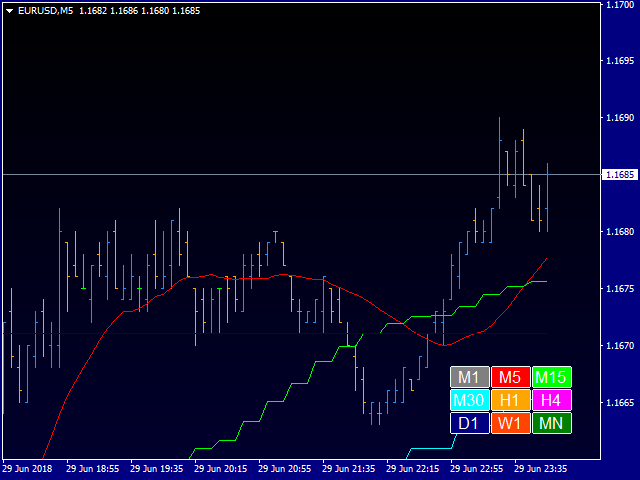
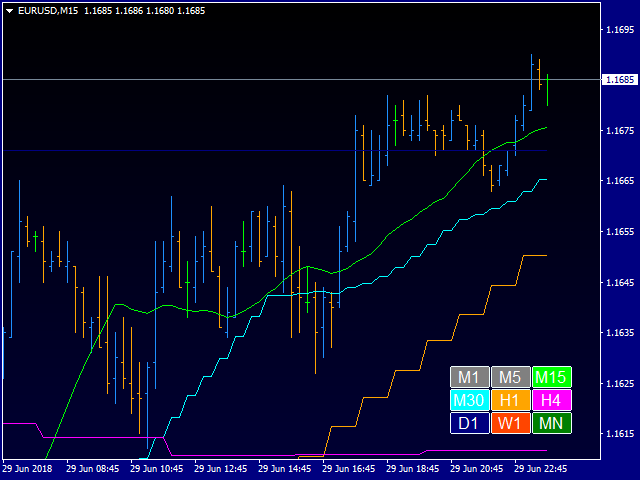
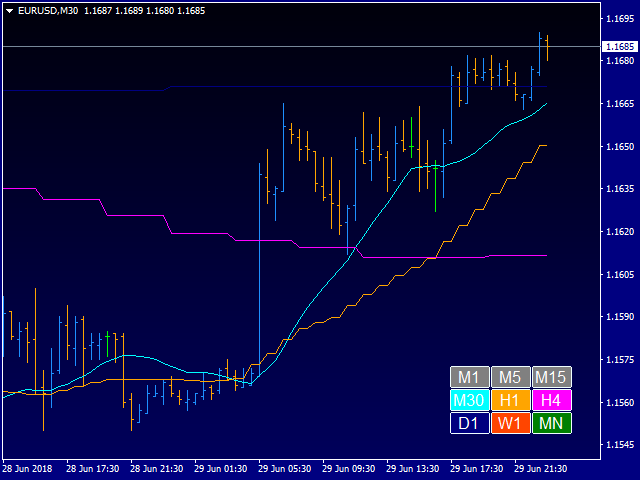
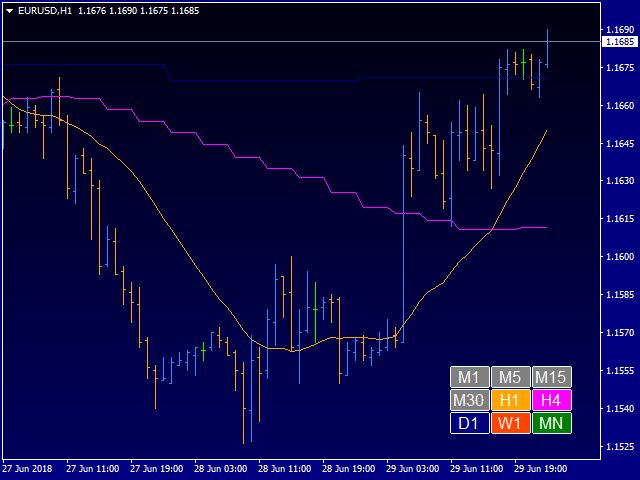
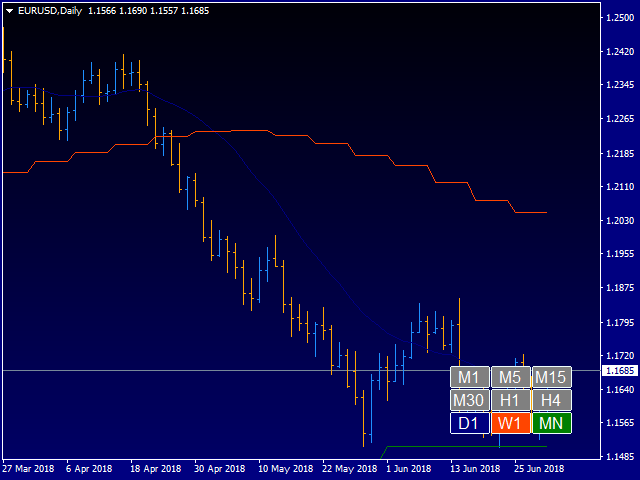
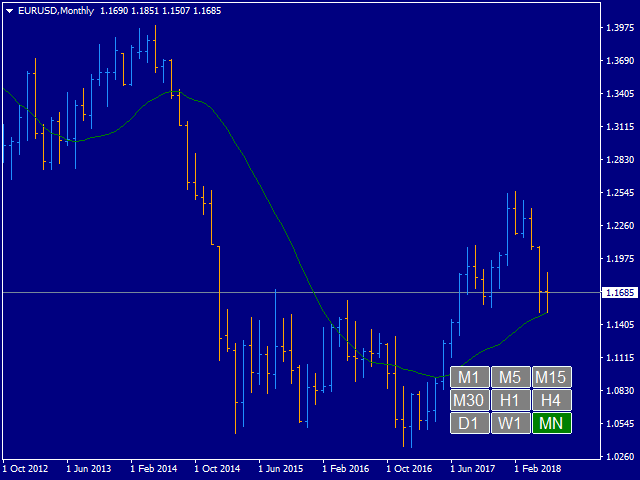
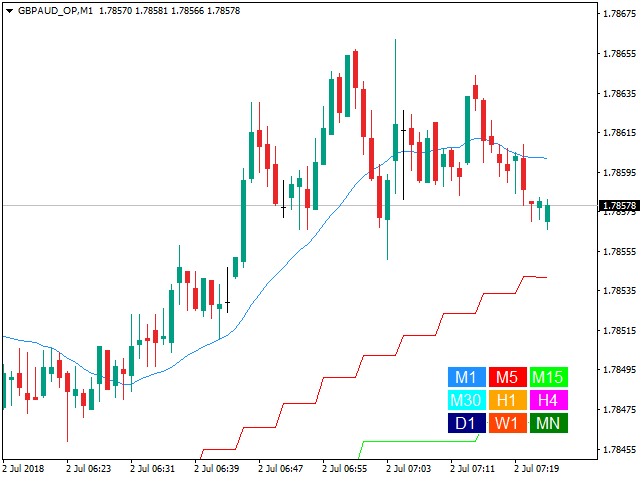
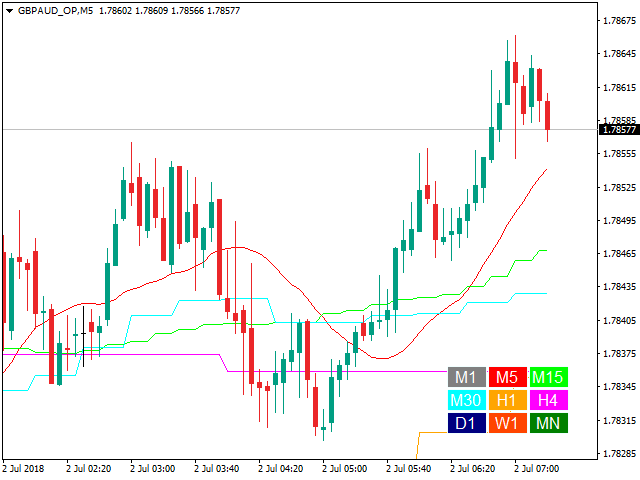
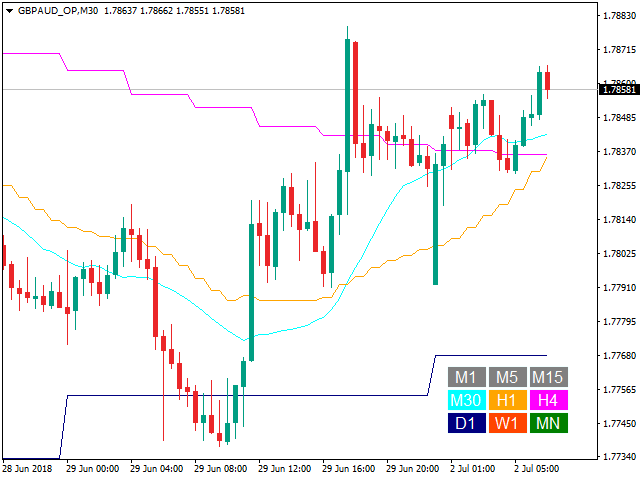
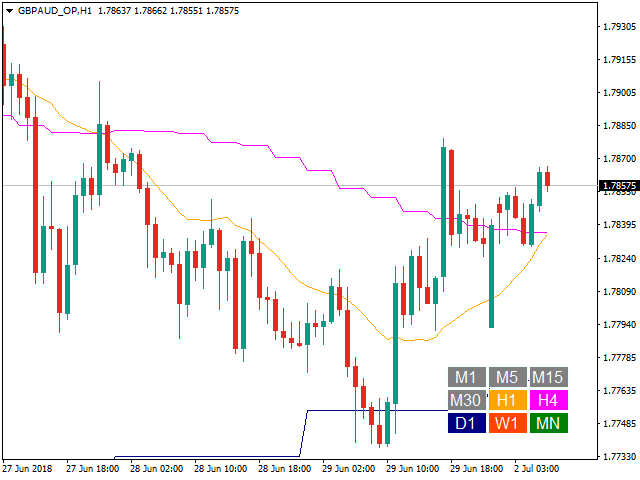
This indicator displays a set of moving average lines across all higher timeframes. The indicator can be installed on any financial instrument and any timeframe. For the analysis of the lines, a panel with timeframe values is provided in the lower right corner. Using the panel, you can easily enable/disable the display of the MA line of any higher timeframe. This allows a more thorough analysis of the market situation. The color of the button matches the color of the moving average line.


Parameters

  • "___| Settings of the main indicator "
  • Moving Average Period - default is 20;
  • Moving Average Method - simple averaging;
  • Moving Average Applied Price- default is Close price;
  • Moving average shift - default is 0;
  • "___| Color palette "
  • Text color - default is White;
  • ColorM1 - the color of the M1 timeframe line (default is DodgerBlue);
  • ColorM5 - the color of the M5 timeframe line (default is Red);
  • ColorM15 - the color of the M15 timeframe line (default is Lime);
  • ColorM30 - the color of the M30 timeframe line (default is Aqua);
  • ColorH1 - the color of the H1 timeframe line (default is Orange);
  • ColorH4 - the color of the H4 timeframe line (default is Magenta);
  • ColorD1 - the color of the D1 timeframe line (default is Navy);
  • ColorW1 - the color of the W1 timeframe line (default is OrangeRed);
  • ColorMN - the color of the MN timeframe line (default is Green);

Specify the MA calculation period and its parameters, and the indicator will show you MA on all higher periods. Alternatively, you can set the display of MA of required timeframes.

Produtos recomendados
"Giant" is a flexible system in relation to trading strategies. It consists of two high-quality indicators that are installed on five different timeframes of the same currency pair (see screenshot). It monitors the trend and gives signals to open. The system passed a large number of checks and showed high accuracy. Indicators are sold separately. The second word in the main name is the indicator itself. This issue sells the indicator  "Attention" .                                                
The indicator sends messages to e-mail and mobile terminal when the price approaches the horizontal levels and trend lines that are drawn using the handy panel! The levels and trend lines are deleted and placed to the chart using one click on the panel, and they can be dragged on the chart by mouse! It is possible to set the interval between messages in the settings, the interval is applied to each object separately! Indicator Settings ===*** Main settings ***=== - below is the list of the mai
ForexGumpUltra
Andrey Kozak
3.25 (4)
ForexGumpUltra is a new and more advanced indicator of the ForexGump series. This indicator easily determines the price direction on any currency pair and any timeframe. The indicator draws its signals on the zero bar and does not redraw them (see the video). In the 34th second of the video it can be seen that this indicator uses new filters to determine the changes in price movement direction without delay, despite the market noise present at the moment (see the video on the 34th second). Once
After purchasing, you can request and receive any two of my products for free! После покупки вы можете запросить и получить два любых моих продукта бесплатно! Simple fully automatic trading robot with simple default settings for currency pairs: EURUSD, GBPUSD working timeframe H1. The EA has averaging with the  d'Alembert  rate system for each subsequent order in the grid. Settings: Magic Number is a magic number. SL - Fixed Stop Loss. TP - Fixed Take Profit. Lot% - market entry (lot) as a pe
FREE
The Momentum indicator drawn using a tick chart. After launching it, wait for enough ticks to come. Parameters: period - period of the indicator calculation. levels count - number of displayed levels (no levels are displayed if set to 0) calculated bar - number of bars for the indicator calculation.
KT Candlestick Patterns Scanner is a Multi-Symbol and Multi-Timeframe scanner that fetches and shows various candlestick patterns on 28 currency pairs and 9 time-frames concurrently . The scanner finds the candlestick patterns by loading the KT Candlestick Patterns indicator as a resource in the background. Features The scanner can find the candlestick patterns on 252* combinations of symbols and time-frames from a single chart. Open the signal's chart loaded with a predefined template with
Oscillator helps determine the direction of the market Shows the direction of the price movement and is painted in the appropriate color. Allows you to conduct trend and counter trend trading It works on all timeframes, on any currency pairs, metals and cryptocurrency Can be used when working with binary options Distinctive features Does not redraw; Simple and clear settings; It works on all timeframes and on all symbols; Suitable for trading currencies, metals, options and cryptocurrency (Bitco
PTW NON REPAINT TRADING SYSTEM + HISTOGRAM Non-Repainting ,   Non-Redrawing   and   Non-Lagging  Trading System. Does the following: - Gives Accurate Entry and Exit Points - Scalping, Day and Swing Trading  - 95% Accuracy  - Targets, where to take profits. - Shows Trends, Support and resistance levels - Works on All Brokers - Works on All Currencies, CFDs and Stocks - It does not place trades for you, it only shows you what trades to place. - It works on All Timeframes - It is for Trend or ra
The indicator is like a mother-in-law, who talks often, talks a lot and often inappropriately. The indicator, in addition to giving us an entry signal on parameters which I will then list, monitors the trend of the hourly timeframe, OSMA to understand the entry direction, RSI to sense any overbought or oversold conditions from which to abstain, ATR for the volatility and ADX for the trend. Indicator not recommended for newbies. Only the human judgment of these parameters, combined with the e
Cloud Power
Andriy Sydoruk
Implementation of indication of trend movement with moments for potential stops in the Cloud Power indicator. The transition to the shadow warns of a possible reversal. The entry of the price inside the shadow speaks of a flat movement. The indicator tracks the market trend with unmatched reliability, ignoring sharp market fluctuations and noise around the average price. Simple, visual and efficient use. The indicator does not redraw and does not lag. It can be easily used as an independent
MetaForecast M4
Vahidreza Heidar Gholami
5 (1)
MetaForecast prevê e visualiza o futuro de qualquer mercado com base nas harmonias nos dados de preços. Embora o mercado nem sempre seja previsível, se houver um padrão nos preços, o MetaForecast pode prever o futuro com a maior precisão possível. Em comparação com outros produtos similares, o MetaForecast pode gerar resultados mais precisos ao analisar as tendências do mercado. Parâmetros de entrada Past size (Tamanho do passado) Especifica o número de barras que o MetaForecast usa para criar
Note : The slow loading of the indicator issue has been addressed . This new version loads fast and does not slow the platform. Version 1.3 : We have updated the indicator to include an historical bar scanning option . So instead of scanning all bars in the history (which can make the indicator slow sometimes ) , you can select the maximum number of bars it can scan which can increase the performance and make the indicator faster. This indicator scans the 1-3 Trendline pattern . The indic
Drawing Pack
John Louis Fernando Diamante
4 (1)
This indicator provides several drawing tools to assist in various methods of chart analysis. The drawings will keep their proportions (according to their handle trendline) across different chart scales, update in real time, and multiple drawings are supported. # Drawing Option Description  1 Grid box draggable boxed grid, user defines rows x colums, diagonal ray option  2 Grid partial or fullscreen grid, sized by handle line  3 Grid flex a diagonal grid, sized and sloped by handle line
Th3 BarPlay Signals Mt4
Nnamdi Kennedy Ifeorah
Esta é uma estratégia baseada em ação de preço conhecida como 3Bar_Play e é baseada na formação do padrão de velas 3Bar. Indicadores adicionais são adicionados para filtro e confirmações antes de aparecer as setas de sinal de compra/venda. Pode ser negociado em um mercado de tendência de alta, tendência de baixa ou lateral. Os indicadores adicionados incluem: Estocástico - Momento Fisher - Tendência ATR - Volatilidade que também define claramente a colocação de Stop-Loss na base da seta de sina
Bergland Gold MT4
Matthias Bessler
This fully automated trading system is part of the Bergland signal. It features a highly efficient trading logic, and a money management system. Reasonable calculated stop loss and take profit levels. It is easy to install and do not require a special setfile. XAUUSD, M15 Live Signal: Bergland Gold You can rent the Bergland signal here. If you like my product, please write a review.
Power Average
Khurram Mustafa
4.25 (8)
This Indicator is a  affordable trading tool  because with the help of  Popular Developers & Support of M Q L Platform  I have programmed this strategy. I tried to combine logic of  Moving Averages, Parabolic Stop And Reverse, Trend Strength, Oversold, Overbought . Furthermore, I have also care about  Support Resistance  that Trader can easily get in touch with market by selecting one indicator only. What is in for Trader? Trading Modes:  This selection is for  activate whole strategy  "Power
FREE
Welcome to the world of advanced trading with the CCI Multicurrency Scanner! Elevate your trading experience with our powerful MT4 indicator designed for seamless analysis and real-time insights. Key Features: Effortless CCI Scanning: Unlock the full potential of the CCI Multicurrency Scanner by effortlessly scanning multiple currency pairs. Receive instant alerts when specific Commodity Channel Index (CCI) conditions are met, ensuring you stay ahead of market movements. Comprehensive Dashboard
Este indicador multi-quadro de tempo e multi-símbolo identifica topo / fundo duplo, cabeça       E       ombros, flâmula / triângulo e padrões de bandeira. Também é possível configurar alertas apenas quando uma ruptura do decote / triângulo / mastro tiver ocorrido (ruptura do decote = sinal confirmado para parte superior / inferior e cabeça e ombros).   O indicador também pode ser usado no modo de gráfico único. Por favor, leia mais sobre esta opção no produto   blog .       Combinado com suas p
Indicators 14 in 1
Makarii Gubaydullin
5 (1)
14 Indicators and auxiliary tools for convenient trading This utility contains 14 additional tools that can be useful for certain actions of the trader,   thereby simplifying and speeding up the trading process. My   #1 Utility : includes 65+ functions  |   Contact me  if you have any questions Due to the different monitor resolutions, some users may encounter the fact that the labels will be displayed with an overlay or be too small. If you encounter such a problem, you can adjust the font size
A trading range takes place when a financial instrument (stocks, indices, bonds, commodities, Forex currencies or cryptocurrencies) oscillates between two upwards and downwards boundaries for a period of time. This Indicator tool help us to view range on the chart bar per bars, also set range in percent and get clean posicion.  Range trading works best in the absence of a trend. When the markets lack a clear direction, that’s when these consolidation periods settle in. Alternatively, more exper
Anemone
Sean Christian Hammond
Criado usando inteligência artificial, IA, para incorporação de padrões de comportamento visíveis de um organismo vivo na análise de tendências. A Teoria do Caos encontra a Média Móvel. O filtro que alimenta a Anêmona do Mar estende suas gavinhas em um mar de nutrientes para enriquecer-se. Não vou perder o seu tempo com descrições demasiado longas, o conceito é compreensível nestes termos. É uma média móvel rotativa de período personalizável que alterna entre Simples, Exponencial, Ponderada e Su
Hello all The expert works by hanging pending deals moving with the price when activating a transaction It closes on the stop loss or on a profit from the pursuit of profit Work on low spread currency pairs Like dollar yen currency The work is done with the same settings as the expert, or it can be modified as the user likes Work on a timing of 15M or more as the user likes parameters: Transaction_Movement : Movement =true  . no Movement=false . Lot1: Manual Lot Size Auto_Lot: Set true to aut
Adaptive SSA
Jean Francois Le Bas
SSA stands for ' Singular Spectrum Analysis '. It combines elements of classical time series decomposition, statistics, multivariate geometry, dynamical systems and signal processing. SSA decomposes time series into a sum of components (ETs), with each component representing a lower smoothing, using several SVD ( Singular Value Decompositions ). It is a powerful filtering process used in many fields of research (climatology, biomedical, aerospace, etc), where high quality forecasting and smoo
NIGHTCrusher Lite FREE
Christian Opperskalski
4.5 (2)
NIGHTCRUSHER is a fully automated expert advisor, designed for scalping on quite market situation. The Lite - Version is limited to minimal Lot per Pair and dont has lot mulitplier and dynamic function you can also run different strategies like swing trading or grid different Trade Entry Signals different Exit Strategies included (MA Cut / Signal Change / Trailing TP) clever Risk & Money management - Balance based - Longrun trades tracking You can also use a Grid function or Lot multipier, if n
FREE
Waves Follower
Mihails Babuskins
5 (1)
Contact me after payment to send you the User-Manual PDF File. This indicator gives a signal when the probability of starting a trend is high. To calculate entry points, it uses a combination of some indicators like "Moving Average", "ADX", RSI with support and resistance points. This indicator is a trend follower and it doesn't determine that TP because it is not necessary, it uses the stop-loss trailing system (Of course, the indicator determines the SL, but you have to move it yourself becau
Smart Math EA
Erik Shahazizyan
4 (2)
The advisor is a flexible solution with a grid strategy. Easy to operate and at the same time effective. It can be used both for accelerating a deposit and for conservative trading, depending on the settings. Uses auto lot and averaging to optimize trading. It is an excellent tool in skillful hands, providing stable results. Those who write a comment and rate honestly will get a Pro Set. Recommendations: Currency Pair: EURUSD Timeframe: M15 Minimum Deposit: $500 Brokers: Exness, Alpari, RoboFore
FREE
Sto Trigger 2 AM
Andriy Matviyevs'kyy
The indicator determines entry points basing on data of the Stochastic indicator. When the indicator crosses the zero line, the trend is changed. If the oscillator's value is 1.5 - the price grows, the trend remains; If the oscillator's value is 0.5 - the price grows, the trend is absent; If the oscillator's value is -1.5 - the price falls, the trend remains; If the oscillator's value is -0.5 - the price falls, the trend is absent; The best entry moment is crossing the High/Low of the bar where
FREE
Rebate gnome
Vasilii Konovalov
Robô de desconto. O dinheiro no depósito gira em torno de zero, enquanto muitas transações são feitas e um desconto é acumulado. Não carrega o depósito, há um stop loss e take profit, o que é claramente uma tendência no gráfico diário. Com reversões longas, o robô perde, mas acontece de forma muito lenta e relativamente segura, por isso é recomendável acompanhar a tendência pelo menos uma vez ao dia e desligá-la se houver sinais de reversão no gráfico diário. Como um indicador da direção do comé
Trend Suffer
Philip Effiong Philip
Alerts you on new trends, with ENTRY and EXIT points. INSTRUCTIONS  Select asset of choice, activate the indicator on the chart and just follow the signals from the arrows. ITS FREE, GIVE ME A GOOD RATING! Platform : Metatrader4 Asset : All Currencies, Gold, BTCUSD, NASDAQ PS : F or newbie and pro traders. Used by more 3,000 traders around the world. Send  a mail for further help and information...........
QuantumAlert Stoch Navigator is a free indicator available for MT4/MT5 platforms, its work is to provide "alerts" when the market is inside "overbought and oversold" regions in the form of "buy or sell" signals. This indicator comes with many customization options mentioned in the parameter section below, user can customise these parameters as needful. Join our   MQL5 group , where we share important news and updates. You are also welcome to join our private channel as well, contact me for the p
FREE
Os compradores deste produto também adquirem
Gann Made Easy
Oleg Rodin
4.88 (100)
Gann Made Easy é um sistema de negociação Forex profissional e fácil de usar, baseado nos melhores princípios de negociação usando a teoria do sr. W. D. Gann. O indicador fornece sinais precisos de COMPRA e VENDA, incluindo níveis de Stop Loss e Take Profit. Você pode negociar mesmo em movimento usando notificações PUSH. Entre em contato comigo após a compra! Vou compartilhar minhas dicas de negociação com você e ótimos indicadores de bônus de graça! Provavelmente você já ouviu muitas vezes sobr
Trend Punch
Mohamed Hassan
4.91 (23)
This indicator is unstoppable when combined with our other indicator called  Support & Resistance . After purchase, send us a message and you will get it   for  FREE as a BONUS! Introducing Trend Punch , the revolutionary forex trend indicator that will transform the way you trade! Trend Punch is uniquely designed to provide precise buy and sell arrows during strong market trends, making your trading decisions clearer and more confident. Whether you're trading major currency pairs or exotic sym
Gold Stuff
Vasiliy Strukov
4.9 (270)
Gold Stuff-um indicador de tendência projetado especificamente para o ouro, também pode ser usado em qualquer instrumento financeiro. O indicador não é redesenhado ou atrasado. O timeframe recomendado é H1. O EA Gold Stuff Expert Advisor está escrito neste indicador, você pode encontrá-lo no meu perfil. Importante! Entre em contato comigo imediatamente após a compra para obter instruções e bônus!  Você pode obter uma cópia gratuita do nosso indicador Strong Support e Trend Scanner, envie um
FX Power MT4 NG
Daniel Stein
5 (13)
Receba a sua atualização diária do mercado com detalhes e screenshots através do nosso Morning Briefing aqui no mql5 e no Telegram ! O FX Power MT4 NG é a próxima geração do nosso medidor de força de moeda muito popular de longa data, o FX Power. E o que é que este medidor de força da próxima geração oferece? Tudo o que adorou no FX Power original MAIS Análise de força GOLD/XAU Resultados de cálculo ainda mais precisos Períodos de análise configuráveis individualmente Limite de cálculo personal
LEIA AS INFORMAÇÕES ABAIXO ANTES DE COMPRAR O PRODUTO! Apollo Pips PLUS SP é um produto único! É PARA QUEM QUER ADQUIRIR MEU NOVO INDICADOR "APOLLO PIPS" MAIS BÔNUS "SUPER PACK" COM ACESSO A TODOS OS MEUS INDICADORES DE NEGOCIAÇÃO! Ao adquirir o produto Apollo Pips PLUS SP você está na verdade adquirindo uma versão absolutamente nova do meu indicador Apollo Pips. Esta versão do indicador possui um algoritmo aprimorado e um parâmetro fácil de usar que lhe dá a oportunidade de usar o indicador em
TPSproTREND PrO
Roman Podpora
4.79 (19)
TPSpro TREND PRO   é um indicador de tendência que analisa automaticamente o mercado e fornece informações sobre a tendência e cada uma de suas mudanças, além de dar sinais para entrar em negociações sem redesenhar! O indicador utiliza cada vela, analisando-as separadamente. referindo-se a diferentes impulsos - impulso para cima ou para baixo. Pontos de entrada exatos em transações de moedas, criptomoedas, metais, ações, índices! Versão MT5                   DESCRIÇÃO COMPLETA DO INDICADOR    
Trend Pulse
Mohamed Hassan
5 (5)
Please contact me after purchase to immediately get your PDF strategy + documentation for Trend Pulse !  Official release price of $89  (2 /50 copies left). Next price is $199 . Introducing Trend Pulse , a unique and robust indicator capable of detecting bullish, bearish, and even ranging trends! Trend Pulse uses a special algorithm to filter out market noise with real precision. If the current symbol is moving sideways, Trend Pulse will send you a ranging signal, letting you know that it'
Scalper Inside PRO
Alexey Minkov
4.75 (60)
An exclusive indicator that utilizes an innovative algorithm to swiftly and accurately determine the market trend. The indicator automatically calculates opening, closing, and profit levels, providing detailed trading statistics. With these features, you can choose the most appropriate trading instrument for the current market conditions. Additionally, you can easily integrate your own arrow indicators into Scalper Inside Pro to quickly evaluate their statistics and profitability. Scalper Inside
Atomic Analyst
Issam Kassas
5 (3)
Primeiramente, vale ressaltar que este Indicador de Negociação não repinta, não redesenha e não apresenta atrasos, tornando-o ideal tanto para negociação manual quanto automatizada. Manual do utilizador: configurações, entradas e estratégia. O Analista Atômico é um Indicador de Ação de Preço PA que utiliza a força e o momentum do preço para encontrar uma vantagem melhor no mercado. Equipado com filtros avançados que ajudam a remover ruídos e sinais falsos, e aumentam o potencial de negociação.
Trend Screener
STE S.S.COMPANY
4.82 (92)
Indicador de tendência, solução única inovadora para negociação e filtragem de tendências com todos os recursos de tendências importantes construídos dentro de uma ferramenta! É um indicador multi-timeframe e multi-moedas 100% sem repintura que pode ser usado em todos os símbolos/instrumentos: forex, commodities, criptomoedas, índices e ações. O Trend Screener é um indicador eficiente que segue a tendência do indicador que fornece sinais de tendência de seta com pontos no gráfico. Os recursos qu
Currency Strength Wizard é um indicador muito poderoso que fornece uma solução completa para uma negociação bem-sucedida. O indicador calcula o poder deste ou daquele par forex usando os dados de todas as moedas em vários intervalos de tempo. Esses dados são representados em uma forma de índice de moeda fácil de usar e linhas de energia de moeda que você pode usar para ver o poder desta ou daquela moeda. Tudo o que você precisa é anexar o indicador ao gráfico que deseja negociar e o indicador mo
- Real price is 80$ - 40% Discount ( It is 49$ now ) Contact me for instruction, any questions! Introduction The breakout and retest strategy is traded support and resistance levels. it involves price breaking through a previous level.  The break and retest strategy is designed to help traders do two main things, the first is to avoid false breakouts. Many false breakouts start with a candlestick that breaks out of a level but ends with an immediate candlestick that brings the price back into t
Actualmente 20% OFF ! A melhor solução para qualquer novato ou comerciante especializado! Este software de painel de instrumentos está a funcionar em 28 pares de moedas. É baseado em 2 dos nossos principais indicadores (Advanced Currency Strength 28 e Advanced Currency Impulse). Dá uma grande visão geral de todo o mercado Forex. Mostra valores avançados de força da moeda, velocidade de movimento da moeda e sinais para 28 pares de divisas em todos os (9) períodos de tempo. Imagine como a sua
Clear Breakout
Martin Alejandro Bamonte
5 (1)
O indicador "Breakout Buy-Sell" foi desenvolvido para identificar e destacar potenciais oportunidades de compra e venda com base em rompimentos de preços durante diferentes sessões de mercado (Tóquio, Londres e Nova York). Este indicador ajuda os traders a visualizar claramente as zonas de compra e venda, bem como os níveis de take-profit (TP) e stop-loss (SL). Estratégia de Uso O indicador pode ser usado da seguinte maneira: Configuração Inicial : Selecione a sessão do mercado e ajuste o offset
ACTUALMENTE COM 26% DE DESCONTO A melhor solução para qualquer novato ou comerciante especializado! Este Indicador é uma ferramenta comercial única, de alta qualidade e acessível, porque incorporámos uma série de características proprietárias e uma nova fórmula. Com apenas UM gráfico, pode ler a força da moeda para 28 pares de Forex! Imagine como a sua negociação irá melhorar porque é capaz de apontar o ponto exacto do gatilho de uma nova tendência ou oportunidade de escalada? Manual do u
O sistema PRO Renko é um sistema de negociação altamente preciso especialmente concebido para a negociação de gráficos RENKO. Trata-se de um sistema universal que pode ser aplicado a vários instrumentos de negociação. O sistema neutraliza eficazmente o chamado ruído de mercado, dando-lhe acesso a sinais de inversão precisos. O indicador é muito fácil de usar e tem apenas um parâmetro responsável pela geração de sinal. Você pode facilmente adaptar a ferramenta a qualquer instrumento de negoc
Gold Channel   é um indicador baseado na volatilidade, desenvolvido com um algoritmo de tempo especifico para o par XAUUSD que consiste em encontrar possíveis correções no mercado. Este indicador mostra duas linhas exteriores, uma interior (linha de retração) e um sinal de seta, onde a teoria do canal consiste em ajudar a identificar condições de sobrecompra e sobrevenda no mercado. O preço do mercado cairá geralmente entre os limites do canal. Se os preços tocarem ou se moverem para fora do can
Antes de tudo, vale ressaltar que esta Ferramenta de Negociação é um Indicador Não Repintante, Não Redesenhante e Não Atrasado, o que a torna ideal para negociação profissional. Curso online, manual do utilizador e demonstração. O Indicador de Conceitos de Ação de Preço Inteligente é uma ferramenta muito poderosa tanto para traders novos quanto experientes. Ele combina mais de 20 indicadores úteis em um único, combinando ideias avançadas de negociação como Análise do Trader do Círculo Interno e
ACTUALMENTE 31% DE DESCONTO!! A melhor solução para qualquer novato ou comerciante especializado! Este indicador é uma ferramenta comercial única, de alta qualidade e acessível, porque incorporámos uma série de características proprietárias e uma fórmula secreta. Com apenas UM gráfico, dá alertas para todos os 28 pares de moedas. Imagine como a sua negociação irá melhorar porque é capaz de identificar o ponto exacto de desencadeamento de uma nova tendência ou oportunidade de escalada! Con
NAM Order Blocks
NAM TECH GROUP, CORP.
5 (1)
Indicador de detecção de blocos de pedidos de multi-timeframe MT4. Características - Totalmente personalizável no painel de controle do gráfico, fornece interação completa. - Oculte e mostre o painel de controle onde quiser. - Detectar OBs em vários períodos de tempo. - Selecione a quantidade de OBs para exibir. - Interface de usuário de OBs diferente. - Filtros diferentes em OBs. - Alerta de proximidade OB. - Linhas ADR de alta e baixa. - Serviço de notificação (alertas de
RelicusRoad Pro
Relicus LLC
4.73 (141)
Agora US $ 147 (aumentando para US $ 499 após algumas atualizações) - Contas ilimitadas (PCs ou Macs) Manual do usuário do RelicusRoad + vídeos de treinamento + acesso ao grupo de discórdia privado + status VIP UMA NOVA FORMA DE OLHAR PARA O MERCADO O RelicusRoad é o indicador de negociação mais poderoso do mundo para forex, futuros, criptomoedas, ações e índices, oferecendo aos traders todas as informações e ferramentas necessárias para se manterem rentáveis. Fornecemos análises técnica
PZ Trend Trading
PZ TRADING SLU
4.8 (5)
O Trend Trading é um indicador projetado para lucrar o máximo possível com as tendências que ocorrem no mercado, cronometrando retrocessos e rupturas. Ele encontra oportunidades de negociação analisando o que o preço está fazendo durante as tendências estabelecidas. [ Guia de instalação | Guia de atualização | Solução de problemas | FAQ | Todos os produtos ] Negocie mercados financeiros com confiança e eficiência Lucre com as tendências estabelecidas sem ser chicoteado Reconhecer retrocesso
TPSpro RFI Levels
Roman Podpora
4.83 (24)
Reversal First Impulse levels (RFI)    INSTRUCTIONS        RUS       -       ENG              R ecommended to use with an indicator   -   TPSpro  TREND PRO -  Version MT5 A key element in trading is zones or levels from which decisions to buy or sell a trading instrument are made. Despite attempts by major players to conceal their presence in the market, they inevitably leave traces. Our task was to learn how to identify these traces and interpret them correctly. Main functions: Displaying activ
Break and Retest
Mohamed Hassan
4.17 (18)
This Indicator only places quality trades when the market is really in your favor with a clear break and retest. Patience is key with this price action strategy! If you want more alert signals per day, you increase the number next to the parameter called: Support & Resistance Sensitivity.  After many months of hard work and dedication, we are extremely proud to present you our  Break and Retest price action indicator created from scratch. One of the most complex indicators that we made with ove
Order Block Hunter
Noha Mohamed Fathy Younes Badr
5 (2)
Order block hunter indicator is the best indicator for  hunt the order blocks that area where there has been a large concentration of limit orders waiting to be executed Order blocks are identified on a chart by observing previous price action and looking for areas where the price experienced significant movement or sudden changes in direction .This indicator does that for you by using very complicated codes and helps you to take the best areas To buy and sell because it make marks at the best a
Scalper Vault
Oleg Rodin
5 (29)
Scalper Vault é um sistema profissional de escalpelamento que fornece tudo o que você precisa para um escalpelamento bem-sucedido. Este indicador é um sistema de negociação completo que pode ser usado por comerciantes de forex e opções binárias. O período de tempo recomendado é M5. O sistema fornece sinais de seta precisos na direção da tendência. Ele também fornece sinais superiores e inferiores e níveis de mercado Gann. Os indicadores fornecem todos os tipos de alertas, incluindo notificações
IX Power MT4
Daniel Stein
5 (6)
O IX Power traz finalmente a precisão imbatível do FX Power para símbolos não-Forex. Determina com exatidão a intensidade das tendências a curto, médio e longo prazo nos seus índices, acções, mercadorias, ETFs e até criptomoedas favoritos. Pode analisar tudo o que o seu terminal tem para oferecer. Experimente e veja como o seu timing melhora significativamente quando negoceia. Características principais do IX Power Resultados de cálculo 100% precisos e sem repintura - para todos os símb
M1 Arrow
Oleg Rodin
4.73 (15)
Uma estratégia intradiária baseada em dois princípios fundamentais do mercado. O algoritmo é baseado na análise de volumes e ondas de preços usando filtros adicionais. O algoritmo inteligente do indicador dá um sinal apenas quando dois fatores de mercado se combinam em um. O indicador calcula ondas de um determinado intervalo no gráfico M1 usando os dados do período de tempo mais alto. E para confirmar a onda, o indicador utiliza a análise por volume. Este indicador é um sistema de negociação pr
Backtest and Read Overview before purchase. Chart patterns have been a topic of debate among traders; some believe they are reliable signalers, while others do not. Our Chart Patterns All-in-One indicator displays various chart patterns to help you test these theories for yourself. The profitability of these patterns is not a reflection of the indicator's effectiveness but rather an evaluation of the patterns themselves. The Chart Patterns All-in-One indicator is an excellent tool for visualizin
Advanced Supply Demand
Bernhard Schweigert
4.9 (314)
Atualmente com 33% de desconto! A melhor solução para qualquer Trader Novato ou especialista! Este indicador é uma ferramenta de negociação exclusiva, de alta qualidade e acessível porque incorporamos uma série de recursos proprietários e uma nova fórmula. Com esta atualização, você poderá mostrar fusos horários duplos. Você não só será capaz de mostrar um TF mais alto, mas também mostrar ambos, o TF do gráfico, MAIS o TF mais alto: MOSTRANDO ZONAS ANINHADAS. Todos os traders de Oferta e Demanda
Mais do autor
This is an interactive and easy-to-set indicator which allows to form seven equally spaced channels which have your settings simultaneously. All seven channels are enabled by default. But you can easily enable one or another channel using control buttons located in the upper case of the indicator's control panel. You can change a period of the indicator calculation by clicking one of buttons indicating number of the channel in the lower case of the control panel. Two other buttons (one of them i
The purpose of the indicator is drawing an equidistant channel. It is somewhat different from the traditional model. The choice of control parameters is simple and does not require any special description. Enter the calculation interval in hours and the solution to the problem will appear on the screen. Please note that the time involved in calculation of the channel must be greater than the timeframe it will be displayed on. If the parameters you enter are beyond the allowable limits, you will
This indicator is designed for drawing equidistant channels. Two options are available: based on the number of hours in the indicator calculation and by the number of bars. To draw a channel, enter a number 1 or greater. The maximum value is limited by the amount of visible bars. If the parameters you enter are beyond the allowable limits, you will get notified if the indicator restrictions. Please note that the time involved in calculation of the channel must be greater than the timeframe it wi
This is a well-known ZigZag indicator. But it differs by the fact that its plot is based on values of the middle line which is set by a user. It can display Andrews’ Pitchfork and standard or Bobokus Fibo levels. NO REPAINTING. Parameters Period МА — middle line period. Default value is 34. Minimum value is 4. Maximum value is set at your discretion. Used to calculate price - base price to calculate the middle line. The averaging method - method of smoothing the middle line. Turning pitchfork
The indicator displays the moving average of all periods on one chart. It shows the MA of a one step lower timeframe and all the MAs equal to and higher than it. Parameters Period moving average - Moving Average period (default is 34); Used to calculate price - price used for the MA calculation (default is the average price = (high+low)/2); The averaging method - default is linear-weighted; Moving average shift - MA shift (default is 0). Just enter the MA calculation period and its parameters,
This indicator is designed for analyzing your positions on 30 financial instruments with the font size of the output information between 8 and 10. If the font size is 11 you will see only 26 instruments and so on: 12-25, 13-24, 14-20. The font size can range from 8 to 14. The main window contains buttons with names of financial instruments and lines where brief information about all open positions is displayed. Two columns show the total volumes in lots of positions in each trading direction: BU
This is a prototype of the famous Control and management of transactions panel. There are two main differences: Allows to work with all the variety of financial instruments opened by a user and not only with instruments it was attached to; To activate levels of order closure hidden from a broker, it uses not lines but modifiable virtual levels. To enjoy the full functionality of the panel you are advised to have: Desk analytical table . Their combined operation allows to keep the situation under
This is a prototype of the famous Control and management of transactions panel. There are two main differences: Allows to work with all the variety of financial instruments opened by a user and not only with instruments it was attached to; To activate levels of order closure hidden from a broker, it uses not lines but modifiable virtual levels. The EA will independently determine a total number of involved financial instruments, display them in the upper left window and locate the pointer on the
It is widely known that colors affect the emotional state of a human, especially if this human is a trader. Psychologists recommend that you follow your instincts and select the color of your environment that is most comfortable to you. In order to reduce emotional stress, impact of colors on a person should be considered. The optimal range of the most beneficial colors includes green, yellow-green and green-blue ones. This indicator allows you to manage your emotional state and health. Choose a
The indicator is based on the two-buffer scheme and does not require any additional settings. It can be used on any financial instrument without any restrictions. The indicator is a known ZigZag, but it does not redraw . The indicator allows to easily detect significant levels on the price chart, as well as demonstrates the ability to determine the probable direction of a price movement. The calculations are based on the candles' Close prices, thus improving the reliability of the levels. Para
The idea of the indicator stems from the necessity to clearly define the borders of support and resistance levels, which helps to plan the opening and closing of positions in the areas that most appropriately determine the process. Look at the breakdowns of the resistance level that confirm the intention of the price to continue the upward movement, after it passed the support level and entered the channel formed by the two levels. The same is for the case when the price enters the channel downw
This indicator is a logical extension of the product at https://www.mql5.com/en/market/product/12526 . The only difference is that price movement is displayed using a histogram with levels, allowing to assess the direction and strength of the movement. How to interpret the signal: 0 - the middle of the channel; above 0.5 - the breakdown of the channel up; below -0.5 - the breakdown of the channel down. Both indicators are displayed in the attached screenshots. Install the indicator and you will
Simple Line
Valeriy Medvedev
The indicator shows the levels of the past week and day. In addition, it draws a level in percentage. This level is specified relative to the difference between the High and Low of the past month and week. For the daily levels of the past day, the Close levels are additionally displayed. All you need to do is configure the display parameters of the levels to your liking. Parameters Over the past months installations - settings for the last months; PasteMonthsLines - the level display mode is
This indicator is the logical continuation of the well-known equidistant channel indicator: https://www.mql5.com/en/market/product/8723 . The main purpose of the indicator is the visualization of price levels relative to the parallel channel using Fibo Bobokus levels in a separate window and the price history. This often allows forecasting the future price movement with a sufficiently high degree of probability. The Fibo levels calculation equation is as follows: FiboLevel = (50-(100*((Close[i]-
This simple to use utility allows opening charts from the list of financial instruments by left clicking their names. The chart window is opened using the Default template. The template name can be changed to one of those stored in Charts-Templates section of the terminal. It is possible to customize the background colors of panels and their labels, and also to select the display type for a more comfortable working environment. This is all you need to know in order to see the result quickly. P
If you need to quickly evaluate the results of trading on a current financial instrument by hypothetical price movement in the chosen direction and up to a certain level, set the indicator on any chart that contains open positions and move the line to the desired level after it appears together with the results tab. This is all you need to understand what happens to your deposit if the price is at this level without taking into account existing stop loss and take profit. Enable considering pendi
This is an individual tool for analyzing the market situation. It is very simple to use. After attaching the indicator to the chart, you will see three vertical lines named "VLine 1", "VLine 2" and "VLine 3", following in this order from left to right. For the utility to operate correctly, this sequence should always be observed. Please note: at the first start, the lines are not bound to specific price levels on the chart. This should be done by user in accordance with the following rule: if li
This indicator is designed for monitoring RSI levels on the current and higher timeframes. The control panel is user friendly and consists of buttons, with which you can control the display of lines as per the names of the buttons. The button color matches the line color. Parameters "___| Settings of the main indicator " RSI Period - averaging period for index calculation (default is 14); RSI Price type - price used for calculations (default is the Close price); "___| Color palette " Text colo
Этот индикатор предназначен для контроля уровней CCI на текущем и старших от него таймфреймах. Панель управления проста в понимании и состоит из кнопок, с помощью которых можно управлять отображением линий, соответствующим указанным на наименовании кнопок. Цвет кнопки совпадает с цветом линии. Этот индикатор из серии подобных индикаторов, которые уже успели завоевать популярность: https://www.mql5.com/ru/market/product/30276 и https://www.mql5.com/ru/market/product/30403 Параметры "___| Set
This is a well-known ZigZag indicator. But it differs by the fact that its plot is based on values of the middle line which is set by a user. It can display Andrews’ Pitchfork and standard or Bobokus Fibo levels. NO REPAINTING. Parameters Period МА — middle line period. Default value is 34. Minimum value is 4. Maximum value is set at your discretion. Used to calculate price — type of price used for the midline calculations. The averaging method — type of smoothing for the middle line. Turning
The indicator is similar to https://www.mql5.com/en/market/product/12330 . However, it considers the MQL5 platform features. Peaks and bottoms are calculated based solely on external bars. After a swing is formed, the indicator does not redraw providing opportunities for traders working on horizontal level breakthroughs. Traffic can be reduced by changing the amount of calculated bars in the MinBars variable (default value is 500). All you need is to select the output options, so that you can se
The indicator is based on the two-buffer scheme and does not require any additional settings. It can be used on any financial instrument without any restrictions. The indicator is a known ZigZag, but it does not redraw . The indicator allows to easily detect significant levels on the price chart, as well as demonstrates the ability to determine the probable direction of a price movement. The calculations are based on the candles' Close prices, thus improving the reliability of the levels. Para
It is an analogue of the indicator of levels at https://www.mql5.com/en/market/product/24273 for the MetaTrader 5 platform. The indicator shows the levels of the past month, week and day. In addition, it draws a level in percentage relative to the difference between the High and Low of the past month and week. For the daily levels of the past day, the Close levels are additionally displayed. All you need to do is to configure the display parameters of the levels to your liking. In some cases, af
Filtro:
jetztea1
174
jetztea1 2021.12.03 12:57 
 

O usuário não deixou nenhum comentário para sua avaliação

Andreas Opitz
1993
Andreas Opitz 2021.10.13 14:14 
 

O usuário não deixou nenhum comentário para sua avaliação

takashi hasebe
295
takashi hasebe 2020.10.08 11:29 
 

O usuário não deixou nenhum comentário para sua avaliação

Shaheen Hassanali
6615
Shaheen Hassanali 2018.12.03 13:22 
 

O usuário não deixou nenhum comentário para sua avaliação

Tim Eubanks
5762
Tim Eubanks 2018.07.14 17:53 
 

O usuário não deixou nenhum comentário para sua avaliação

Erdinç Yıldız
539
Erdinç Yıldız 2018.07.06 22:21 
 

O usuário não deixou nenhum comentário para sua avaliação

Responder ao comentário