Multi Time Frame Moving Average Indicator
- Göstergeler
- Valeriy Medvedev
- Sürüm: 1.0
- Etkinleştirmeler: 5
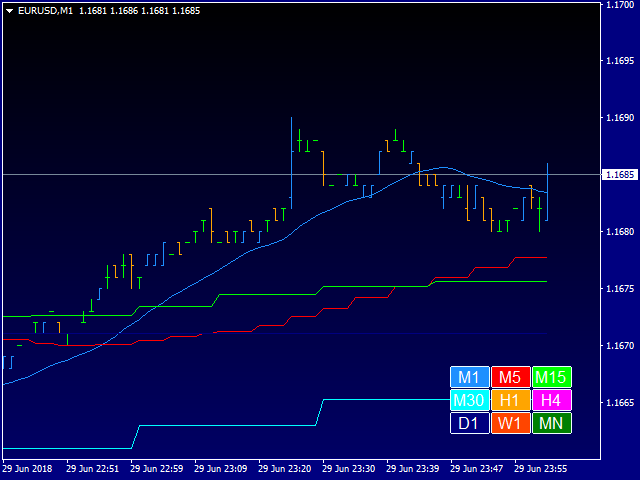
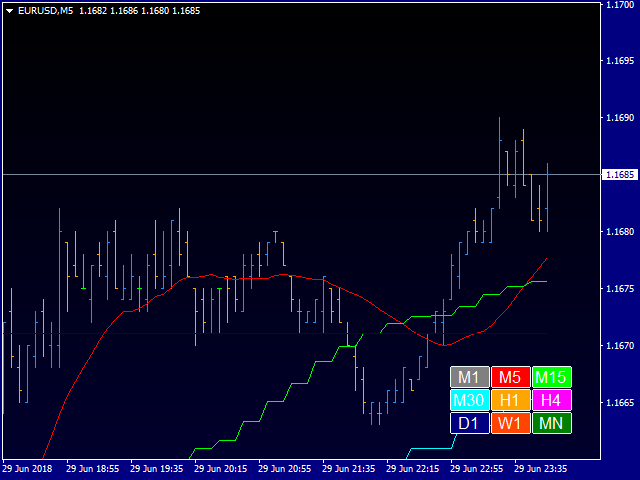
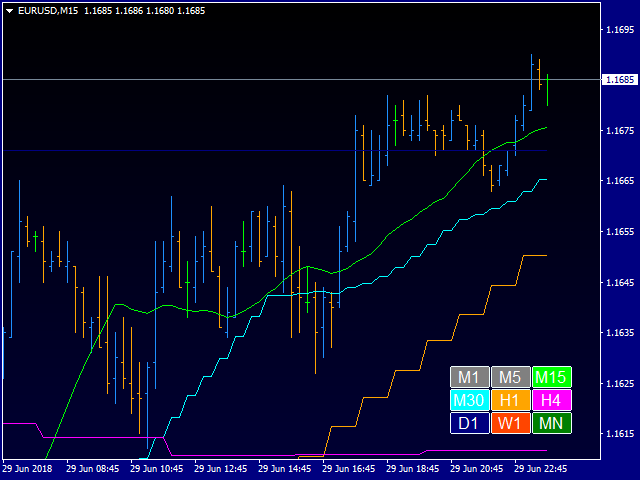
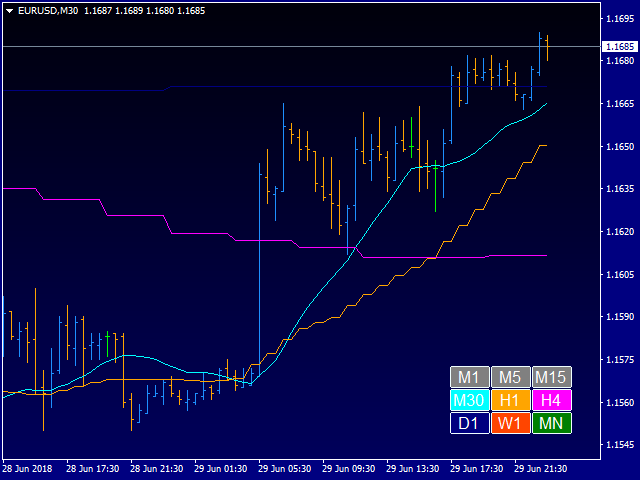
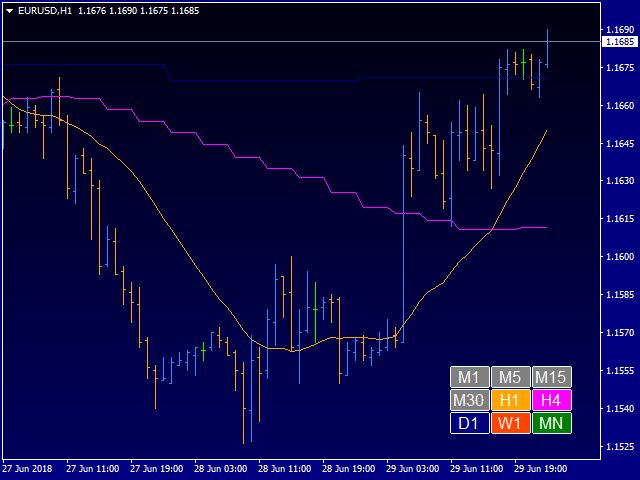
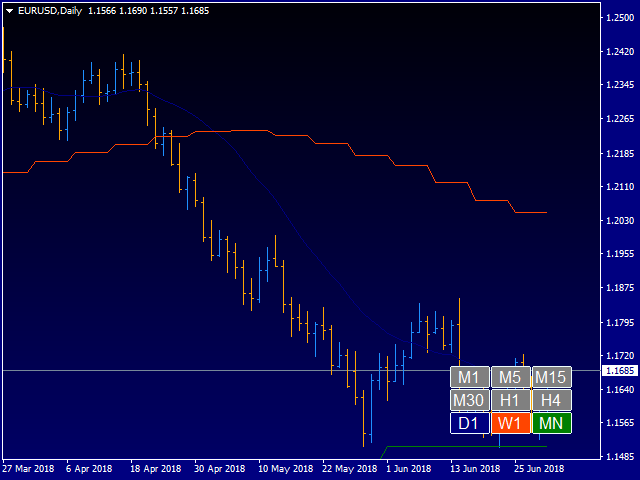
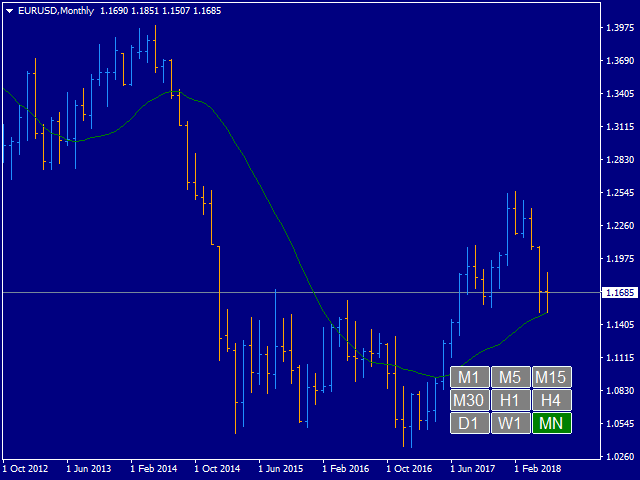
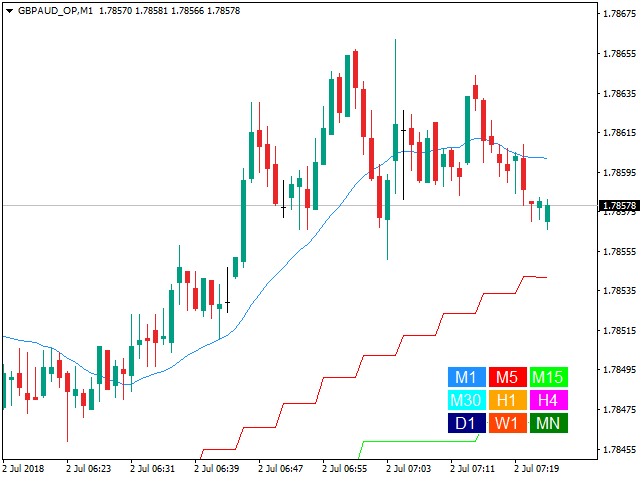
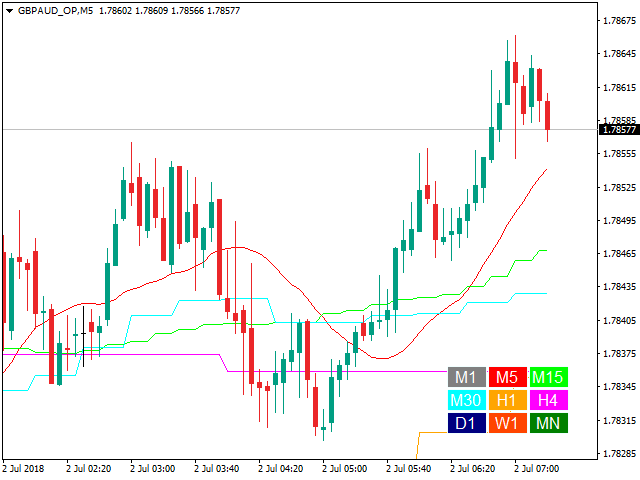
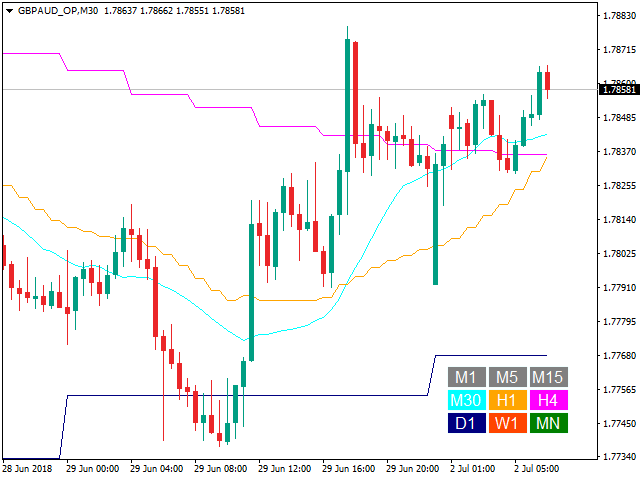
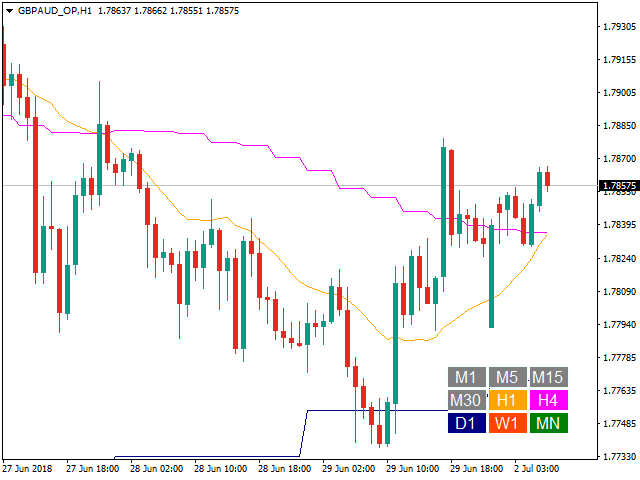
This indicator displays a set of moving average lines across all higher timeframes. The indicator can be installed on any financial instrument and any timeframe. For the analysis of the lines, a panel with timeframe values is provided in the lower right corner. Using the panel, you can easily enable/disable the display of the MA line of any higher timeframe. This allows a more thorough analysis of the market situation. The color of the button matches the color of the moving average line.
Parameters
- "___| Settings of the main indicator "
- Moving Average Period - default is 20;
- Moving Average Method - simple averaging;
- Moving Average Applied Price- default is Close price;
- Moving average shift - default is 0;
- "___| Color palette "
- Text color - default is White;
- ColorM1 - the color of the M1 timeframe line (default is DodgerBlue);
- ColorM5 - the color of the M5 timeframe line (default is Red);
- ColorM15 - the color of the M15 timeframe line (default is Lime);
- ColorM30 - the color of the M30 timeframe line (default is Aqua);
- ColorH1 - the color of the H1 timeframe line (default is Orange);
- ColorH4 - the color of the H4 timeframe line (default is Magenta);
- ColorD1 - the color of the D1 timeframe line (default is Navy);
- ColorW1 - the color of the W1 timeframe line (default is OrangeRed);
- ColorMN - the color of the MN timeframe line (default is Green);
Specify the MA calculation period and its parameters, and the indicator will show you MA on all higher periods. Alternatively, you can set the display of MA of required timeframes.










Kullanıcı incelemeye herhangi bir yorum bırakmadı