• Visão global
  • Comentários
  • Discussão

Wave Synchronizer MT5

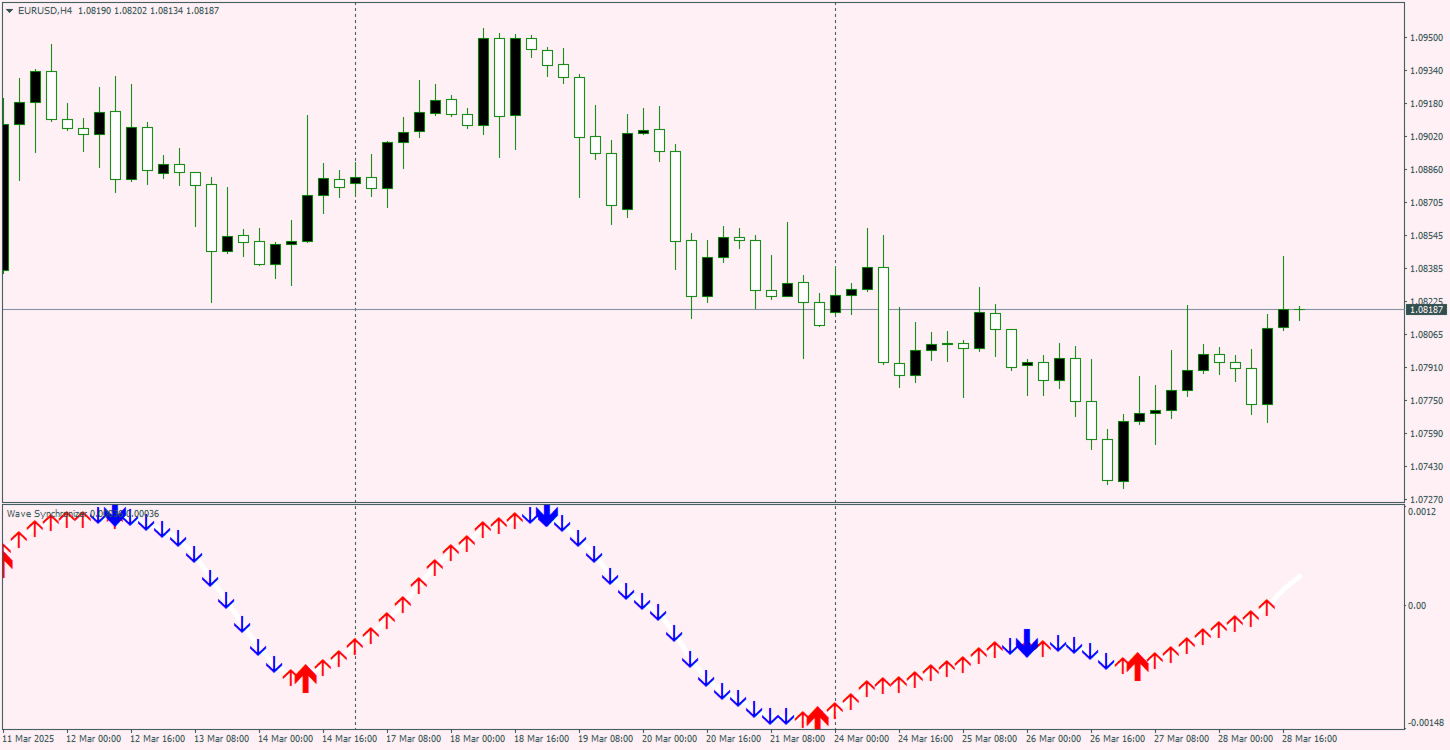
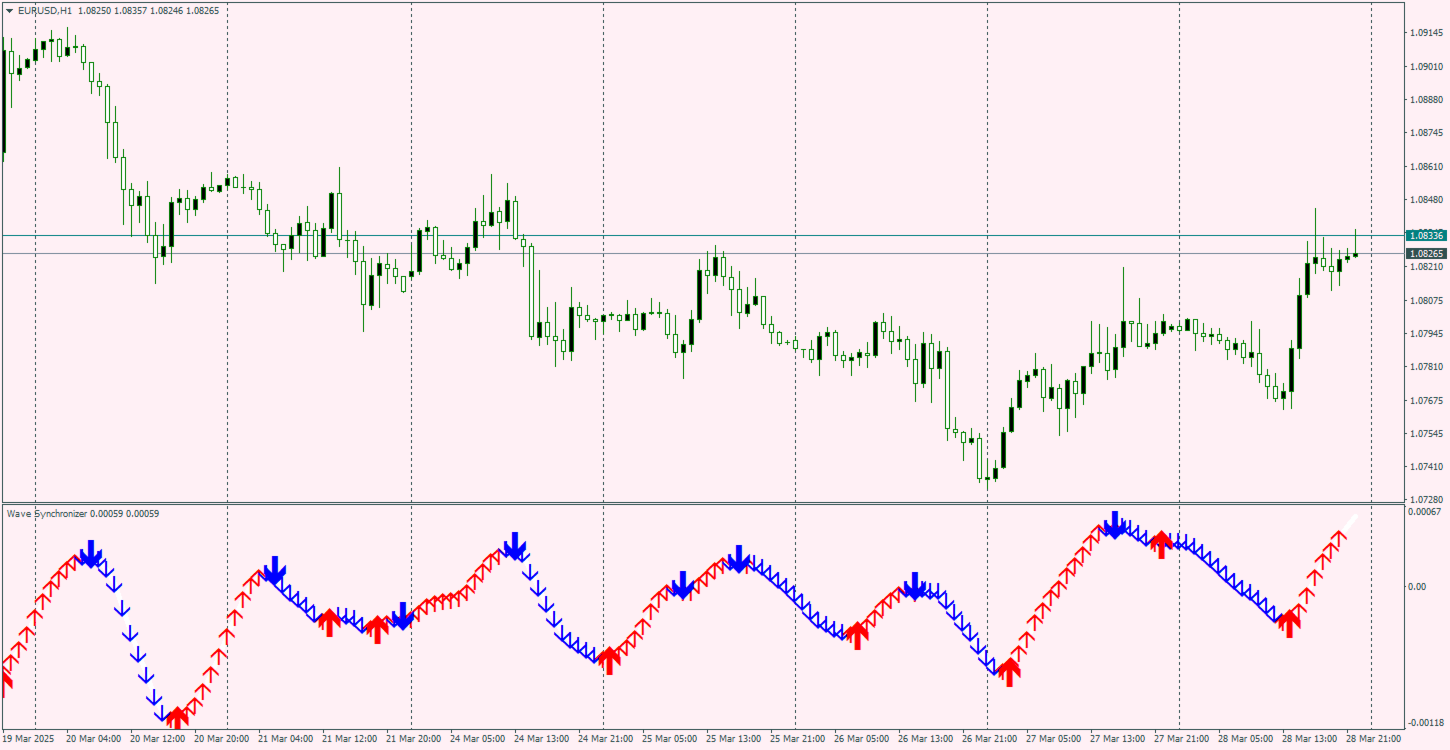
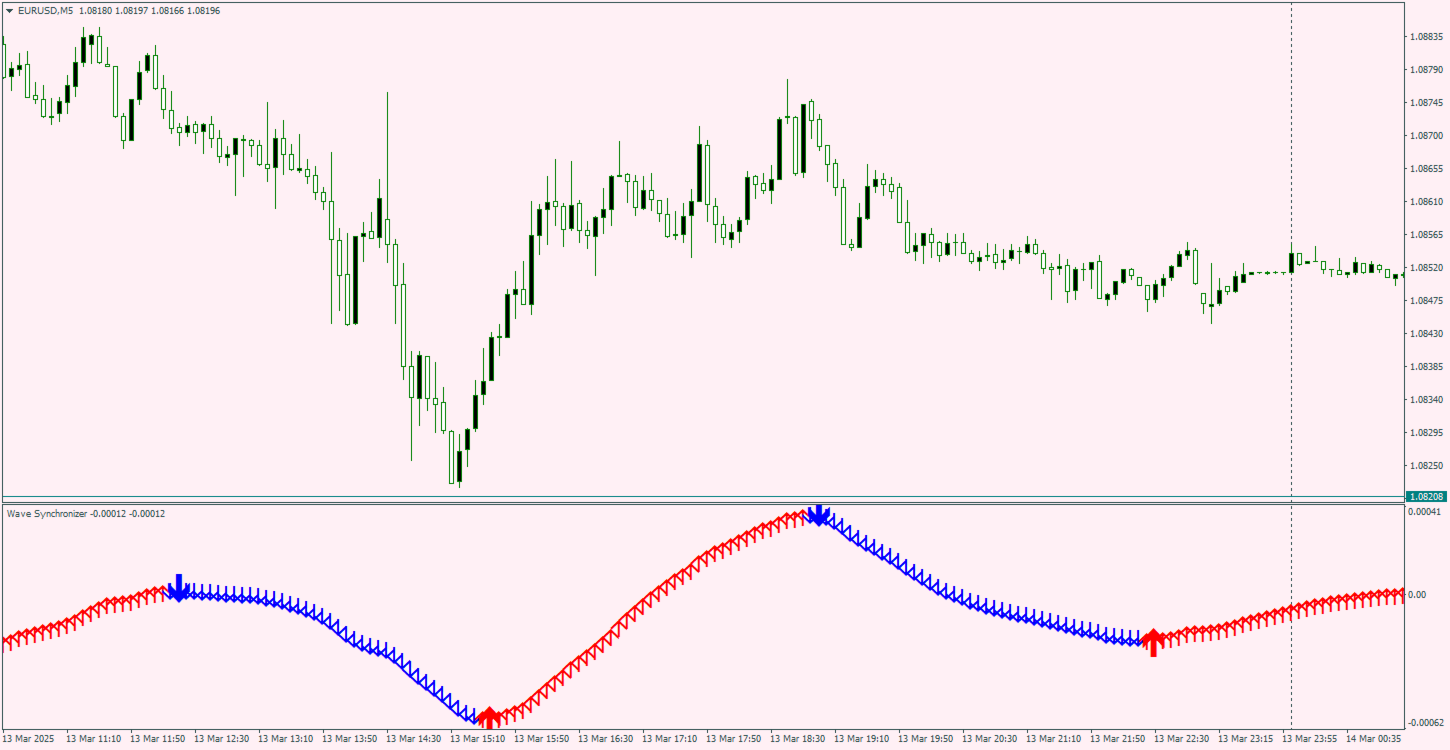
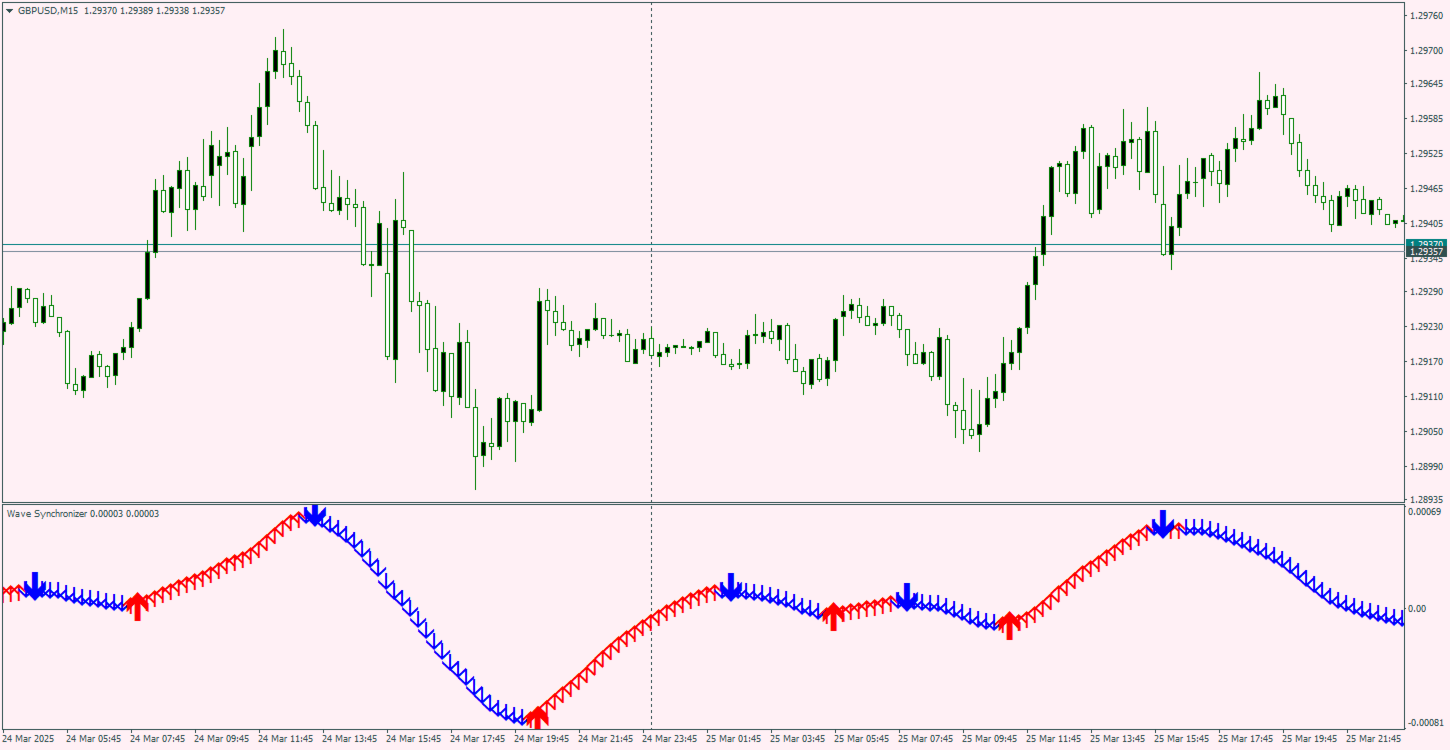
O Wave Synchronizer é um indicador visual de análise de ondas. Combina sequências de movimentos de velas e cria ondas direcionais, produzindo movimentos sincronizados juntamente com o mercado.
O início de cada onda começa com uma seta de sinalização, existindo também alertas.

O indicador nunca redesenhará ou moverá as setas no histórico anterior.
Aparecem setas de sinal no fecho da vela.
Adapta-se para trabalhar com quaisquer instrumentos de negociação e prazos.
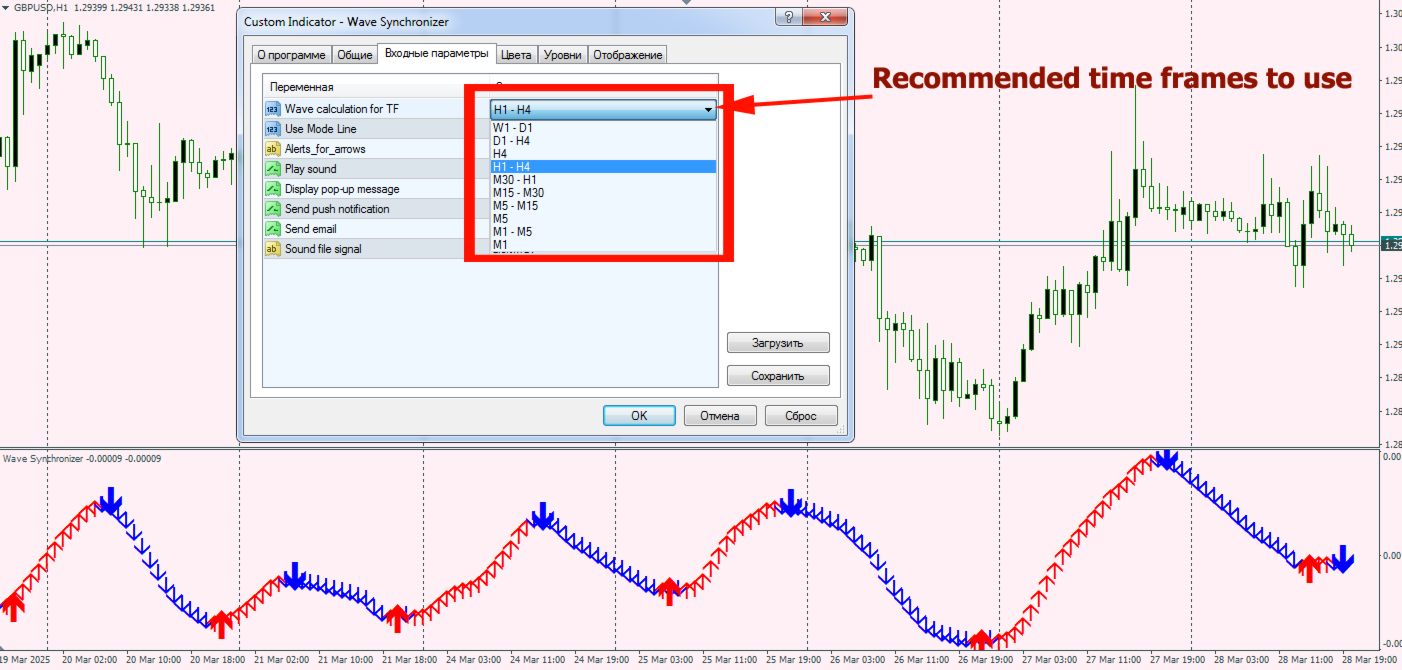
Fácil de utilizar e configurar, contém apenas 2 parâmetros de entrada: seleção de um período de tempo para utilização com os parâmetros selecionados e o método para calcular linhas de MA.
Os parâmetros recomendados podem ser alterados em 1-2 períodos.

Direção vermelha das setas para efetuar uma compra de um ativo de negociação.
Direção azul das setas para efetuar uma venda de um ativo de negociação.

Produtos recomendados
Signal Eskiya, in addition to channel lines, reflects entry signals in the form of arrows. Trading strategies using the channel indicator belong to the classic methods of technical analysis, are easy to execute, and therefore available even to beginners. Price ranges work equally well on any trading assets and timeframes, they can be used both independently and with additional confirmation from oscillators and market volumes. American traders say: “Trend is your friend”, which means “Trend is
The indicator ‘Probability Range Bands’ gives a prediction of the amount, how much the asset is moving from its current price. The range bands give probabilities, that the candle close will not exceed this certain price level. It is also called the expected move for the current candle close.   This Indicator is based on statistical methods, probabilities and volatility. Asset price is assumed to follow a log-normal distribution. Therefore, log returns are used in this indicator to determine the
SMA Fibonacci EA
Christoph Kreher
Simple EA with 1 SMA and Fibonacci. The Expertadvisor opens positions in the direction of the trend when price levels have exceeded or fallen below the Fibonacci levels. It depends on the market in question and which parameters to use. The EA is programmed in such a way that optimization runs consume little time. A news filter and filter by day of the week are built in.
ReSu mt5
Daniel Opoku
The Wamek Support and Resistant (WSR) Indicator is a remarkable tool that stands out in the world of technical analysis. It sets itself apart by cleverly combining price action and leading indicators to delineate support and resistance levels with a high degree of accuracy. Its unique feature is its adaptability; users can fine-tune the indicator by adjusting input parameters, enabling them to create customized support and resistance levels that suit their trading strategies. Notably, one of WSR
Seasonal Pattern Trader
Dominik Patrick Doser
Disclaimer : Keep in mind that seasonal patterns are not always reliable. Therefore, thoughtful risk management is crucial to minimize losses.  Seasonal patterns in the financial world are like a well-guarded secret that successful investors use to their advantage. These patterns are recurring price movements that occur during specific periods or around special events. Additionally, there are also intraday patterns that repeat. For example, Uncle Ted from Forex Family suggests examining previou
FIBO Trend PRO mt5
Evgenii Aksenov
4.5 (2)
O indicador permite determinar instantaneamente a tendência atual por cor e níveis de Fibonacci. O painel HTF mostra a tendência atual de períodos mais altos, ajudando a determinar a força da tendência. Negocie na tendência ao mudar a cor das velas ou negocie contra a tendência quando o preço rompe os níveis extremos do indicador FIBO Trend PRO Benefícios do FIBO Trend PRO: O indicador nunca repinta ou altera seus valores Muito fácil de usar e intuitivo Aplicável a qualquer símbolo: FX-moedas, a
This indicator calculates and displays Murrey Math Lines on the chart. This MT5 version is similar to the МТ4 version: It allows you to plot up to 4 octaves, inclusive, using data from different time frames, which enables you to assess the correlation between trends and investment horizons of different lengths. In contrast to the МТ4 version, this one automatically selects an algorithm to search for the base for range calculation. You can get the values of the levels by using the iCustom() funct
As estruturas de mercado são aquelas que, quando quebradas em um período de tempo mais alto, podem ajudar a limpar uma tendência para um trader. 1. Este indicador irá desenhar o ZigZag para apenas 2 últimas estruturas (alta e baixa anterior do ZigZag) e uma nova barra do ZigZag só será formada quando ocorrer a quebra da estrutura 2. Dá notificação de terminal e push sobre quebra de estrutura 3. Aumente e diminua a profundidade do ZigZag das teclas [ e ] para ajustar o balanço 4. Altere as co
Glider
Vitalii Zakharuk
The Glider indicator gives accurate and timely signals to enter and exit the transaction that appear on the current candle. Using the indicator is very simple. When a dot and a blue line appear, open a buy deal. When a dot and a red line appear, open a sell deal. The main purpose of this indicator is to determine the moments of entry and exit from transactions, therefore the Glider indicator will display only the trend line and entry points, i.e. displays displays the entry points to the marke
CCI Profesional
Ignacio Agustin Mene Franco
CCI Professional, has the simple fact of being able to do a scalping or intraday without using any other indicator to take some operation taking advantage of the rebounds in the lines of -200 for long and +200 for short, it is very easy to use and very practical for each market, it can be used for crash and boom since it works very well to hunt spikes, for volatiles and jumps, also for forex. It is used in any temporality.
Considering the main theories of Forex (Dow Theory, support lines, chart patterns, and Fibonacci retracements), It tells you the price range where whales (large investors) are likely to appear. You can trade at the price points that professionals also aim for. You no longer have to warry about where to aim next. We are live-streaming the actual operation of the system. Please check for yourself if it is usable. Please check it out for yourself. https://www.youtube.com/@ganesha_forex We do not
Este indicador do painel de controle de zona de oferta e demanda com vários períodos e vários símbolos envia alertas quando o preço atinge uma zona de oferta / demanda. Também é possível usá-lo para ser alertado sobre topos / fundos duplos regulares em vez de zonas. Ele pode ser usado com todos os intervalos de tempo de M1 a MN.       No máximo 9 períodos de tempo podem ser mostrados no painel ao mesmo tempo.   É possível usar RSI, divergência (MACD, OsMA, RSI ou Awesome) e filtros de padrões de
Simple indicator to calculate fibonacci retracement levels on time. Add to chart and move trend line to set the fibonacci retracement levels. Inputs Levels  - levels for which to calculate values, separated by space, default are fibonacci levels Show time  - if true, time will be shown on levels Show date  - if true, date will be shown on levels Show fibonacci level  - if true, value of levels will be shown Fibonacci lines color  - color of levels Trend line color  - color of trend line which de
FREE
DM IND Exclusive
Sergio Vidal Prado
Indicador Para Opções Binarias. Indicator for Binary Options Usa dois gales. Instalar em mt5 Esse indicador é para ser usado no tempo de vela de 5 minutos e em M5. Este também funciona em M1, porém é mais eficiente em M5. Só descompactar e copiar os arquivos na pasta de dados do seu MT5. Arquivos indicator na pasta MQL5 - Indicator. Baixe também a Media Movel totalmente gratis: https://www.mql5.com/pt/market/product/50400 Esse Indicador é para a próxima vela. Apareceu a seta, só aguardar a próx
Padrões harmônicos EA se você preferir ver isso em um gráfico ao vivo em vez de ler a descrição,   você pode baixar instantaneamente uma demonstração gratuita aqui. Padrões incluídos: Padrão ABCD Padrão Gartley Padrão de morcego Padrão de cifra 3Padrão de acionamentos Padrão Cisne Negro Padrão de cisne branco Padrão Quasimodo ou padrão Over Under Padrão de morcego alternativo Padrão de borboleta Padrão de caranguejo profundo Padrão de caranguejo Padrão de tubarão Padrão de cinco O Padrão de ca
Titan Backup
Elies Noah Siebenpfeiffer
Introducing Titan Backup : Are you ready to enhance your trading game with an automated system built for precision and flexibility? Meet Titan Backup , your expert trading assistant designed to capture high-profit breakouts by identifying accumulation zones . This powerful Expert Advisor (EA) excels in high-volatility markets such as the Nasdaq 100 and Crypto 10 , offering both hands-free automation and manual assistance to support your trading strategies. How Titan Backup Works: Titan Backup ru
Moving pivot Average Fibonacci The  indicator compares the selected period with its counterpart from the previous period. The indicator determines the moving Fibonacci levels for the day or any time interval to assess the price movement range from the time average. The indicator helps predict the expected high or low for the day based on historical time data. The pivot line can be considered an average trend line and use it in a variety of trading strategies. If you have any question about the
Product Description: Adaptive Y-Axis Scaling is a powerful MT5 indicator designed to enhance your trading experience by providing precise control over the Y-axis (price) scaling of your charts. This innovative tool allows you to customize the price scaling by specifying the number of pips from the visible chart's highs and lows. The calculated price range from this input is then used to set the maximum and minimum prices for the open chart, ensuring an optimized and comprehensive view of market
FREE
Expert Market Edge is scalping, trending, reversal indicator, with alerts . You can use it all and fit with your strategy whatever it fits you. My recommendation is to combine with my Colored RSI , and when 2 signals are matched, and pointing same direction (for example buy on this indicator, and green on RSI, you can take a long position, stop loss should be last local low, if you want to be more conservative, add ATR. ) you can take position. If you using moving averages, that's even better i
DYJ WITHDRAWAL PLAN: Sistema de Negociação de Reversão de Tendência   1. O que é o DYJ WITHDRAWAL PLAN? O   DYJ WITHDRAWAL PLAN   é um   sistema inteligente de negociação de reversão de tendência , capaz de   abrir e fechar ordens automaticamente   quando o mercado muda de direção, ajudando os traders a capturar as principais oportunidades de movimentação dos preços. Este sistema é compatível com   todos os instrumentos de negociação   e   todos os corretores , incluindo   Forex   e   Ín
Highest High and Lowest Low (HH_LL) Indicator Description: The HH_LL Indicator is a trading tool designed to help traders identify key market points by automatically drawing Higher High (HH) and Lower Low (LL) lines across multiple timeframes. This indicator allows traders to easily spot significant levels on the chart, facilitating more accurate trading decisions. Key Features: Multi-Timeframe Analysis: The indicator supports various timeframes, including M30, H1, and H4. This enables traders t
FREE
Boom Rocket
Cairo Neto Sergio Ndava
This Expert Advisor is designed exclusively for trading the Boom market on the 1-minute timeframe. It operates solely in the sell direction, focusing on precise exits at specific moments in time. Unlike typical signal bots, this EA doesn’t generate buy/sell alerts but executes trades based on a well-defined strategy to take advantage of price movements during market pullbacks. Key Features: Works exclusively for Boom market : The EA is tailored for Boom markets and functions only on the Boom as
Description of the Indicator Trend Stop shows the highest/lowest value of the last N periods. Can help traders identify the trend direction and potential stop levels.    Use Trend Stop indicator to detects the trend direction. Downtrend if the price crosses the Trend Stop line upwards  Uptrend if the price crosses the Trend Stop line downwards  Use Trend Stop indicator to  define  optimal stop levels. Downtrend Place your stops  above the Trend Stop line Uptrend Place your stops below the Tren
MasterCharts
Alexander Berger
You can think of these indicators as moving pivot points. MasterChartsTrading Price Action Indicators show good price levels to enter or exit a trade. The Blue indicator line serves as a Bullish Trend setter. If your instrument closes above the Blue line, we think about going Long (buying). When your trading instrument closes below the Red line, we think about Shorting (selling). It is very easy to read price action if you have a reference point. These support/resistance lines are there to help
NTL Pivot Lines
Northen Trading Labs
Pivot Lines (PL) User Guide Overview and Features The Pivot Lines Indicator (PL) provides traders with a powerful tool for identifying potential support and resistance levels based on well-established pivot point calculation methods. By offering insights into possible price turning points, this indicator helps traders make more informed trading decisions and refine their entry and exit strategies. With customizable settings for different timeframes and calculation methods, PL is versatile and a
Introduction to Harmonic Pattern Scenario Planner The present state of Forex market can go through many different possible price paths to reach its future destination. Future is dynamic. Therefore, planning your trade with possible future scenario is an important step for your success. To meet such a powerful concept, we introduce the Harmonic Pattern Scenario Planner, the first predictive Harmonic Pattern Tool in the world among its kind. Main Features Predicting future patterns for scenario
Ric
Sabina Fik
With this indicator, you can   predict future price behavior   for a certain number of bars ahead, giving you the ability to anticipate market dynamics. The indicator draws a   forecast line , which models potential future price values based on sophisticated algorithms analyzing past data. This information can be leveraged not only for market entry and exit decisions but also for setting or adjusting stop-loss levels to better manage your positions. Application of the Forecast The data provided
Zigzag X Fibo
Ian David Emmanuel Bello
The ZigZag indicator's main objective is to highlight significant price movements by filtering out minor price fluctuations. It enables the visualization of trends by eliminating market "noise," which can assist traders in making more informed decisions. Adding the Fibonacci indicator, which is a powerful tool for identifying potential support and resistance levels in financial markets.
mql4 version:  https://www.mql5.com/en/market/product/44606   Simple indicator to calculate profit on fibonacci retracement levels with fixed lot size, or calculate lot size on fibonacci levels with fixed profit. Add to chart and move trend line to set the fibonacci retracement levels. Works similar as default fibonacci retracement line study in Metatrader. Inputs Fixed  - select what value will be fix, lot or profit Fixed value  - value that will be fix on all levels Levels  - levels for which
Os compradores deste produto também adquirem
Este é sem dúvida o indicador de reconhecimento automático de formação de preço harmônico mais completo que você pode encontrar para a MetaTrader Platform. Ele detecta 19 padrões diferentes, leva as projeções de Fibonacci tão a sério quanto você, exibe a Zona de Reversão Potencial (PRZ) e encontra níveis adequados de stop loss e take-profit. [ Guia de instalação | Guia de atualização | Solução de problemas | FAQ | Todos os produtos ] Detecta 19 formações harmônicas de preços diferentes Traça
Quantum TrendPulse
Bogdan Ion Puscasu
5 (13)
Apresentando   Quantum TrendPulse   , a ferramenta de negociação definitiva que combina o poder do   SuperTrend   ,   RSI   e   Stochastic   em um indicador abrangente para maximizar seu potencial de negociação. Projetado para traders que buscam precisão e eficiência, este indicador ajuda você a identificar tendências de mercado, mudanças de momentum e pontos de entrada e saída ideais com confiança. Principais características: Integração SuperTrend:   siga facilmente a tendência predominante do
MTF Supply Demand Zones MT5
Georgios Kalomoiropoulos
5 (1)
Próxima geração de zonas automatizadas de oferta e demanda. Algoritmo novo e inovador que funciona em qualquer gráfico. Todas as zonas estão sendo criadas dinamicamente de acordo com a ação do preço do mercado. DOIS TIPOS DE ALERTAS --> 1) QUANDO O PREÇO ATINGE UMA ZONA 2) QUANDO UMA NOVA ZONA É FORMADA Você não recebe mais um indicador inútil. Você obtém uma estratégia de negociação completa com resultados comprovados.     Novas características:     Alertas quando o preço atinge a zona d
The   Time_Price_SQ9_Degree   indicator is based on the 9 Gann square. Using this indicator, you can identify strong time and price zones. The indicator displays the levels as a degree value. The degrees can be set in the settings. After launching, the MENU button appears. If it is highlighted, it can be moved to any point on the graph, and after double-clicking on it, it stops being highlighted and menu buttons appear. To hide the menu, just double-click on the button, it will become highlight
O Oscilador de Índice de Precisão (Pi-Osc) de Roger Medcalf da Precision Trading Systems A Versão 2 foi cuidadosamente reconfigurada para carregar rapidamente em seu gráfico, e algumas outras melhorias técnicas foram incorporadas para aprimorar a experiência. O Pi-Osc foi criado para fornecer sinais precisos de temporização de negociações projetados para encontrar pontos de exaustão extremos, os pontos para os quais os mercados são forçados a ir apenas para tirar as ordens de todos. Este pro
Indicador único que implementa uma abordagem profissional e quantitativa para significar negociação de reversão. Ele capitaliza o fato de que o preço desvia e retorna à média de maneira previsível e mensurável, o que permite regras claras de entrada e saída que superam amplamente as estratégias de negociação não quantitativas. [ Installation Guide | Update Guide | Troubleshooting | FAQ | All Products ] Sinais de negociação claros Incrivelmente fácil de negociar Cores e tamanhos personalizáveis
Legend mt5
Vladyslava Shaviernieva
This is an indicator that includes the best basic forex indicators , without redrawing. Based on this data, a sell or buy signal is generated. It does not disappear anywhere after the signal, which gives us the opportunity to see the results on the history. It can be used on any currency pair, crypto, metals, stocks It is best used on an hourly chart, but other periods are also acceptable. The best results for the period H1,H4,daily If customers have any questions, I will answer them and af
TPSpro RFI Levels MT5
Roman Podpora
4.55 (20)
Zonas de reversão / Volumes de pico / Zonas ativas de um grande player =       SISTEMA TS TPSPRO INSTRUÇÕES RUS       /       INSTRUÇÕES       ENG       /           Versão MT4        Cada comprador deste indicador recebe adicionalmente GRATUITAMENTE: 6 meses de acesso aos sinais de negociação do serviço RFI SIGNALS - pontos de entrada prontos de acordo com o algoritmo TPSproSYSTEM. Materiais de treinamento com atualizações regulares - mergulhe na estratégia e aumente seu nível profissional. Su
FxaccurateLS
Shiv Raj Kumawat
WHY IS OUR FXACCCURATE LS MT5 THE PROFITABLE ? PROTECT YOUR CAPITAL WITH RISK MANAGEMENT Gives entry, stop and target levels from time to time. It finds Trading opportunities by analyzing what the price is doing during established trends. POWERFUL INDICATOR FOR A RELIABLE STRATEGIES We have made these indicators with a lot of years of hard work. It is made at a very advanced level. Established trends provide dozens of trading opportunities, but most trend indicators completely ignore them! The
KT Trend Trading Suite MT5
KEENBASE SOFTWARE SOLUTIONS
O KT Trend Trading Suite é um indicador multifuncional que combina uma estratégia de acompanhamento de tendência com múltiplos pontos de rompimento como sinais de entrada. Assim que uma nova tendência é estabelecida, o indicador oferece várias oportunidades de entrada para aproveitar o movimento. Um limite de recuo é utilizado para evitar entradas menos significativas. Versão para MT4 disponível aqui  https://www.mql5.com/en/market/product/46268 Recursos Combina diversas dinâmicas de mercad
Blahtech Supply Demand MT5
Blahtech Limited
4.54 (13)
Was: $299  Now: $149  Supply Demand uses previous price action to identify potential imbalances between buyers and sellers. The key is to identify the better odds zones, not just the untouched ones. Blahtech Supply Demand indicator delivers functionality previously unavailable on any trading platform. This 4-in-1 indicator not only highlights the higher probability zones using a multi-criteria strength engine, but also combines it with multi-timeframe trend analysis, previously confirmed swings
TPA True Price Action indicator reveals the true price action of the market makers through 100% non-repainting signals strictly at the close of a candle! TPA shows entries and re-entries, every time the bulls are definitely stronger than the bears and vice versa. Not to confuse with red/green candles. The shift of power gets confirmed at the earliest stage and is ONE exit strategy of several. There are available now two free parts of the TPA User Guide for our customers. The first "The Basics"
MT4 Version SMT Divergences MT5 SMT Divergences is one of the most innovative indicators in the market. It offers the possibility of analyzing price divergences between 2 pairs. These divergences highlight and help to foresee what banks and institutions are planning to do. SMT divergences also provides you with a kill zones indicator and the possibility of filtering divergences occurring during these kill zones.  This indicator is specially powerful if applied in 2 highly correlated pairs. A pri
Volume by Price MT5
Brian Collard
3.25 (4)
Volume Profile, Footprint and Market Profile TPO (Time Price Opportunity). Volume and TPO histogram bar and line charts. Volume Footprint charts. TPO letter and block marker collapsed and split structure charts. Static, dynamic and flexible range segmentation and compositing methods with relative and absolute visualizations. Session hours filtering and segment concatenation with Market Watch and custom user specifications. Graphical layering, positioning and styling options to suit the user's a
CONTACT US  after purchase to get the Indicator Manual. Download Now!  Offer valid only for next 10 Buyers.  Price   will   increase  gradually !  Download the  Metatrader 4 Version Read the product description carefully before purchasing the product.  Due to regulatory restrictions, our service is unavailable in certain countries such as India, Pakistan, and Bangladesh. Disclaimer: • Our products are available only on mql5.com. • We never contact anyone or sell our products privately. • We d
CBT Quantum Maverick Sistema de Negociação de Opções Binárias de Alta Eficiência O CBT Quantum Maverick é um sistema de opções binárias de alto desempenho, projetado para traders que buscam precisão, simplicidade e um enfoque disciplinado. Não exige personalização: o sistema está otimizado para resultados eficazes desde o início. Basta seguir os sinais, que podem ser dominados com um pouco de prática. Principais características: Precisão nos sinais: Sinais baseados na próxima vela, utilizando
This indicator identifies and displays zones, as it were areas of strength, where the price will unfold. The indicator can work on any chart, any instrument, at any timeframe. The indicator has two modes. The indicator is equipped with a control panel with buttons for convenience and split into two modes. Manual mode: To work with manual mode, you need to press the NEW button, a segment will appear. This segment is stretched over the movement and the LVL button is pressed. The level is displayed
MetaForecast M5
Vahidreza Heidar Gholami
5 (3)
MetaForecast prevê e visualiza o futuro de qualquer mercado com base nas harmonias nos dados de preços. Embora o mercado nem sempre seja previsível, se houver um padrão nos preços, o MetaForecast pode prever o futuro com a maior precisão possível. Em comparação com outros produtos similares, o MetaForecast pode gerar resultados mais precisos ao analisar as tendências do mercado. Parâmetros de entrada Past size (Tamanho do passado) Especifica o número de barras que o MetaForecast usa para criar
Super Zone   For several years of observing the principles of the market, Super Zone worked, both then and now, because the indicator  allows you to see the trading range of the  week and even the month that major market participants use. It’s very easy to use, we work on H4 in the weekly range (  in the tester it doesn’t work in the demo mode  ) - we sell from the upper zones, we buy from the lower ones. It marks the zones from the beginning of the week (month) that are  not redrawn  , works on
RelicusRoad Pro MT5
Relicus LLC
4.78 (18)
Agora US $ 147 (aumentando para US $ 499 após algumas atualizações) - Contas ilimitadas (PCs ou Macs) Manual do usuário do RelicusRoad + vídeos de treinamento + acesso ao grupo de discórdia privado + status VIP UMA NOVA FORMA DE OLHAR PARA O MERCADO O RelicusRoad é o indicador de negociação mais poderoso do mundo para forex, futuros, criptomoedas, ações e índices, oferecendo aos traders todas as informações e ferramentas necessárias para se manterem rentáveis. Fornecemos análises técnicas e
PZ Trend Trading MT5
PZ TRADING SLU
3.8 (5)
O Trend Trading é um indicador projetado para lucrar o máximo possível com as tendências que ocorrem no mercado, cronometrando retrocessos e rupturas. Ele encontra oportunidades de negociação analisando o que o preço está fazendo durante as tendências estabelecidas. [ Guia de instalação | Guia de atualização | Solução de problemas | FAQ | Todos os produtos ] Negocie mercados financeiros com confiança e eficiência Lucre com as tendências estabelecidas sem ser chicoteado Reconhecer retrocessos
Berma Bands
Muhammad Elbermawi
5 (3)
O indicador Berma Bands (BBs) é uma ferramenta valiosa para traders que buscam identificar e capitalizar tendências de mercado. Ao analisar a relação entre o preço e os BBs, os traders podem discernir se um mercado está em uma fase de tendência ou de variação. Visite o [ Blog Berma Home ] para saber mais. As Bandas de Berma são compostas por três linhas distintas: a Banda de Berma Superior, a Banda de Berma Média e a Banda de Berma Inferior. Essas linhas são plotadas em torno do preço, criando u
Timeframes Trend Scanner   is a trend analyzer or trend screener indicator that helps you know the trend in   all timeframes of selected symbol you are watching . This indicator provides clear & detailed analysis results on a beautiful dashboard, let you able to use this result right away without need to do any additional analysis. How it works Step 1: Calculate values of 23 selected & trusted technical indicators (Oscillator & Moving Average indicators) Step 2: Analyze all indicators using bes
[ MT4 Version ] Are you tired of spending months on demo or live accounts to test your trading strategies? The Backtesting Simulator is the ultimate tool designed to elevate your backtesting experience to new heights. Utilizing Metatrader historical symbol information, it offers an unparalleled simulation of real market conditions. Take control of your testing speed, test ideas quickly or at a slower pace, and witness remarkable improvements in your testing performance. Forget about wasting tim
Was: $249  Now: $149   Market Profile defines a number of day types that can help the trader to determine market behaviour. A key feature is the Value Area, representing the range of price action where 70% of trading took place. Understanding the Value Area can give traders valuable insight into market direction and establish the higher odds trade. It is an excellent addition to any system you may be using. Inspired by Jim Dalton’s book “Mind Over Markets”, this indicator is designed to suit the
CONTACT US  after purchase to get the Indicator Manual. Try Now—Limited Discount for the next 10 Buyers! Download the  Metatrader 4 Version Read the product description carefully before purchasing the product.  Due to regulatory restrictions, our service is unavailable in certain countries such as India, Pakistan, and Bangladesh. Disclaimer: • Our products are available only on mql5.com. • We never contact anyone or sell our products privately. • We do not provide any personal trading advice.
Visual Heatmap Book Analyzer
Alexandre Moraes De Souza Lima
Visual Heatmap Book Analyser Este indicador revolucionário monitora efetivamente a liquidez do mercado e gera as cores a partir de ordens de padrões de quantidades e atividades de renovações no livro. Isso permite que você visualize o fluxo de ordens e identifique áreas de alta e baixa liquidez e alta e baixa atividade. O indicador utiliza técnicas machine learning para analisar o comportamento das ordens no livro. Isso significa que ele pode detectar padrões e tendências nas ordens, permitind
Malaysian SNR Levels
Matthias Horst Pieroth
This indicator can be used to display Support and Resistance levels according to  the  Malaysian SNR concept , in which Support and Resistance are exact levels of a line chart. Malaysian SNR There are 3 different horizontal levels in Malaysian SNR: A-Level : This level is located at the peak of this line chart. (shape looks like the letter A) V-Level : Level at the valley of a line chart, (shape looks like the letter V) Gap-Leve l: This level is located at the Close/Open gap between two candle
Introduction to Fractal Pattern Scanner Fractal Indicator refers to the technical indicator that makes use of the fractal geometry found in the financial market. Fractal Pattern Scanner is the advanced Fractal Indicator that brings the latest trading technology after the extensive research and development work in the fractal geometry in the financial market. The most important feature in Fractal Pattern Scanner is the ability to measure the turning point probability as well as the trend probabil
Hello I Want to introduce The Forex Buy Sell Arrow Premium MT5 i recently release this premium indicator! its 1000% Non Repaint Indicator, It Work Perfectly Well,, i tested it day by day, Just mind blowing Result,  Including Powerful trend Algorithm! How It Work? well, it work market trend formula, when trend Bullish Or when trend Bearish,  Recommend Timeframe M30, H1 it work all timeframe, and all currency pair, 100% non repaint, How to take signal From Forex Buy Sell Arrow Premium Ind
Mais do autor
Volatility Trend System - um sistema de negociação que dá sinais para entradas. O sistema de volatilidade fornece sinais lineares e pontuais na direção da tendência, bem como sinais para sair dela, sem redesenho e atrasos. O indicador de tendência monitora a direção da tendência de médio prazo, mostra a direção e sua mudança. O indicador de sinal é baseado em mudanças na volatilidade e mostra entradas no mercado. O indicador está equipado com vários tipos de alertas. Pode ser aplicado a vários i
Indicador cíclico para negociação e previsão da direção do mercado. Mostra o comportamento cíclico do preço sob a forma de um oscilador. Emite sinais para a abertura de negociações quando se verifica uma recuperação dos limites superior e inferior do oscilador. Sob a forma de histograma, mostra a força suavizada da tendência.  Complementará qualquer estratégia de trading, desde o scalping ao intradiário.  O indicador não é redesenhado.  Adequado para utilização em todos os símbolos/instrumentos
Indicador para negociação manual e análise técnica para Forex. Consiste em um indicador de tendência com o nível de abertura do dia de negociação e um indicador de seta para determinar os pontos de entrada. O indicador não muda de cor; funciona quando a vela fecha. Contém vários tipos de alertas para setas de sinalização. Pode ser configurado para funcionar em qualquer gráfico, instrumento de negociação ou período de tempo. A estratégia de trabalho baseia-se na busca de movimentos de preços ao
Um indicador técnico que estrutura gráficos e identifica movimentos cíclicos de preços. Pode funcionar em qualquer gráfico. Vários tipos de notificações. Existem setas adicionais no próprio gráfico. Sem redesenhar a história, trabalha no fecho da vela. TF recomendado a partir de M5 e superior. Parâmetros fáceis de utilizar e configurar. Ao utilizar 2 indicadores com parâmetros diferentes, pode utilizá-los sem outros indicadores. Tem 2 parâmetros de entrada Ciclicidade e duração do sinal Estes
Os indicadores de tendência são uma das áreas de análise técnica para utilização em negociações em mercados financeiros. Indicador de Angular Trend Lines - determina de forma abrangente a direção da tendência e gera sinais de entrada. Além de suavizar a direção média das velas Também utiliza o ângulo de inclinação das linhas de tendência. O princípio de construção dos ângulos de Gann foi tomado como base para o ângulo de inclinação. O indicador de análise técnica combina a suavização de velas e
Point Trend Indicator - Um indicador do nível superior e inferior da tendência, que pode determinar a direção da tendência e indicar seu fortalecimento. A direção da tendência é determinada por pontos redondos; se os pontos estiverem acima da linha zero, a tendência é de alta; se estiver abaixo, a tendência é de baixa. O aumento no movimento direcional é indicado por setas. Possui o único parâmetro para ajuste manual - Duração da direção da tendência.   Possibilidades Funciona em todos os prazo
Indicator Waiting Volatility - um indicador para determinar zonas de volatilidade e condições planas. Com o tempo, o preço no gráfico segue tendências diferentes, cai, sobe ou permanece o mesmo. O indicador ajuda o trader a determinar em qual tendência o preço está. Em seu trabalho, utiliza diversas ferramentas de análise técnica, primeiro determina-se a direção da tendência, depois, nessa direção, o indicador monitora as mudanças na volatilidade. Se o preço flutuar dentro do ruído, está em modo
An indicator that determines the point levels of price resistance. The arrows indicate price bounces in the indicated directions. Arrows are not redrawn formed on the current candle, shown on the previous candle for convenience.      It has one setting - the formation intensity: If the parameter is smaller, most of the signals are formed in a wide trend. If the parameter is larger, signals are formed in a narrower trend. Input parameters Formation Intensity - Arrow Formation Intensity Number B
Line Breakouts - Sistema para negociação de tendências. Contém um identificador de tendência que pode ser adaptado a qualquer gráfico e instrumento de negociação usando o período e a função de suavização. E um determinante dos níveis de suporte e resistência. Quando o preço estiver abaixo da linha de resistência, abra negociações de venda e, quando o preço estiver acima da linha de suporte, abra negociações de compra. O Stop Loss deve ser colocado a alguns pontos das linhas, o Take Profit deve s
Arrow indicator with trend filter. Generates trend input without delays or delays - on the emerging candle. Suitable for use on any trading tools and timeframes. Easy to use, contains the direction of the trend in the form of a histogram lines and signal generator. Input parameters Period Trend Line - Period of the Histogram Line Signal Generator Period - If the period is longer, then the arrows are less Play sound Display pop-up message Send push notification Send email Sound file signal - Fi
Um indicador de tendência que mostra a força dos touros e ursos em uma faixa de negociação. Composto por duas linhas: A linha verde é uma condição equilibrada de sobrecompra/sobrevenda. A linha vermelha é a direção da atividade de negociação. Não redesenha cálculos. Pode ser usado em todos os símbolos/instrumentos/quadros de tempo. Fácil de usar e configurar. Como usar o indicador e o que ele determina. A regra básica é seguir a direção da linha vermelha: se cruzar a linha verde de baixo pa
FREE
Lines Channel Pro
Vitalyi Belyh
5 (1)
The "Lines Channel Pro" indicator determines price reversals from the High/Low channel. Contains a built-in trend finder, signal lines, entry and exit points. The recommended timeframe for M15 to work is D1. For each timeframe and trading instrument, depending on the volatility, it is necessary to select individual settings. Does not redraw calculations. Input parameters Use Channel trend filter - Turn on/off the trend filter Channel trend period - Trend filter period (from 8 and above) Line
O indicador " ZigZag on Trend " é um assistente na determinação da direção do movimento dos preços, bem como uma calculadora de barras e pips. É composto por um indicador de tendência que monitora a direção do preço com uma linha de tendência apresentada em forma de zigue-zague e um contador que calcula o número de barras passadas na direção da tendência e o número de pontos na escala vertical. (Os cálculos são realizados abrindo a barra) O indicador não é redesenhado. Para maior comodidade, é d
Channel Cluster
Vitalyi Belyh
5 (1)
Cluster indicator working in the price channel. For operation, the indicator builds a channel line - (dashed line). Inside the channel, cluster sections are determined that determine the direction of the price movement - (histograms in two directions), start with large arrows. Small arrows are plotted above / below each histogram - indicator increase volatility. The indicator does not redraw the values. Works on any tools and timeframes. Entrances are made when large arrows appear, inside small
Oscillatory price direction indicator for Forex. It has 2 operating modes - trend and scalping. The trend mode of operation allows you to determine the direction of the market movement in the medium term. The scalping mode works by determining the price movement in the short term. Consists of a blue line, from which the balance between the directions of the price and signal green / red line. The green line shows the direction of the price up, and the red line shows the direction of the price dow
Zig-Zag indicator with additional signals for inputs. Visually easy to use: The red zig-zag line is an uptrend. The blue zig-zag line is a downward trend. Arrows in the form of additional signals. Works on any trading pairs. On any timeframe. Not redrawn. Input parameters Zig-Zag Period - Zig-zag period (from 5) Signal Period - period of signal arrows (from 3) Alerts for signals Play sound - Sound alert Display pop-up message - Notification by message on the screen Send push notification
Signal indicator that displays price reversals from the upper and lower corners of the chart. It is adjusted for different volatility and timeframes by one parameter - Gradation . Works on any trading pairs. The recommended timeframe for use is from M15 and higher. Not redrawn. If necessary, I will help you choose the optimal setting. Input parameters Gradation - from 0 and higher. If the parameter is larger, arrows are displayed at shorter price intervals. Alerts for signals Play sound - S
Linear indicator for trend trading together with scalping method. The yellow line is used to calculate the long-term price trend. As the yellow line moves, a scalper signal line is applied - a thin red one. A zero level is applied to confirm signals. If the yellow line crossed the zero level upwards, the trend is up. If the yellow line crossed the zero level from top to bottom, the trend is down. The signal red line works in a similar way, only its sensitivity to price movements is higher. Re
A technical indicator that calculates its readings based on trading volumes. It has an oscillatory line that follows the change in volumes. Large arrows on the line indicate reversal values. A channel is built around the line with small arrows showing the strengthening of price movement in the direction of increasing volumes. The indicator does not redraw values. Works on any instrument and timeframe. It can complement any trading strategy by finding a trend or make entries in the direction of a
Este indicador e baseado em uma linha guia de tendencia e um oscilador especial, definir pontos de entrada nos momentos de movimento potencial de precos. O indicador nao redesenha. Funciona em qualquer instrumento. Os prazos mais preferidos para usar sao M5, M15, M30, H1, H4. A linha de tendencia guia do indicador da uma ideia sobre o movimento do mercado. Quando a linha verde cruza o nivel zero de cima para baixo - o mercado e de baixa quando cruza de baixo para cima - mercado de touro. O osc
Desenvolvi metodos para negociacao coletados em um indicador. Na forma de setas, define entradas na direcao da tendencia. Possui 2 tipos de setas - guias de tendencia e de sinal, informando sobre o movimento potencial na direcao da tendencia. Funciona sem redesenho, pronto para uso em todos os simbolos/ferramentas. Os prazos mais adequados para usar sao M15, M30, H1, H4. Como usar O indicador encontra a direcao da tendencia na forma de uma seta de sinal, um retangulo grafico se estende ao long
Max Min Reversal Arrows - an arrow reversal indicator for predicting price movement. The indicator is built on the support and resistance levels at the local lows and highs of the price. Product features Arrows appear on the current candle. The indicator does not redraw. Can be used on all time frames and trading instruments. Recommended timeframes to use M30, H1, H4. The dotted lines are the support and resistance levels within the signal. Price movement from these levels means a reversal. Pr
Scalping Entry Points - é um sistema de negociação manual que pode se ajustar aos movimentos de preços e dar sinais para abrir negociações sem redesenhar. O indicador determina a direção da tendência pelo nível central de suporte e resistência. O indicador de ponto fornece sinais para entradas e saídas. Adequado para negociação intradiária manual, escalpelamento e opções binárias. Funciona em todos os prazos e instrumentos de negociação. O indicador dá vários tipos de alertas. Como usar o produ
Indicador do canal de preço e gerador de breakpoint dentro dele. Dá uma ideia da posição do preço em relação ao período de uso. Ele contém linhas de salto de tendência suavizadas construídas ao longo das bordas do canal e pontos de salto que determinam os momentos de entrada e saída. Funciona em vários instrumentos de negociação e prazos. Como trabalhar com o indicador Siga a linha de quebra de canal, a linha azul é entrada para cima, a linha rosa é entrada para baixo. Os pontos de entrada são
Candle Binary Scalper é um produto de análise técnica para forex e opções binárias. Inclui vários indicadores técnicos combinados em um sistema de negociação. Adequado para negociação manual dentro de uma tendência, para escalpelamento e opções binárias. Funciona em todos os prazos e instrumentos de negociação. Prazos recomendados para negociação M15, M30, H1 e H4, M5 e M1 devem ser usados ​​em caso de alta volatilidade. Existem vários tipos de alertas. Como usar o produto As configurações ide
Binary Lines é um indicador de análise técnica para moedas, commodities, criptomoedas, ações, índices e quaisquer instrumentos financeiros. Pode ser usado para opções binárias ou escalpelamento Forex. Mostra os pontos de entrada e saída em intervalos fixos e fornece comerciantes as informações necessárias sobre os resultados de possíveis transações. Os pontos de entrada são formados no início da vela, na direção da linha MA, duração as negociações em barras podem ser ajustadas manualmente e aju
Um indicador técnico que calcula suas leituras nos volumes de negociação. Na forma de histograma, mostra o acúmulo da força do movimento do instrumento de negociação. Possui sistemas de cálculo independentes para direções de alta e baixa. Funciona em quaisquer instrumentos de negociação e prazos. Pode complementar qualquer sistema de negociação. O indicador não redesenha seus valores, os sinais aparecem na vela atual. É fácil de usar e não carrega o gráfico, não requer cálculos de parâmetros adi
Candle Power Signals é um indicador de tendência que utiliza uma estratégia de busca de potenciais sinais voláteis para tomar decisões de negociação. Ao analisar o mercado, o indicador identifica zonas de aumento e diminuição da volatilidade dentro do movimento de tendência direcional. Os principais parâmetros de geração de sinal já foram configurados, as demais configurações e períodos estão indexados em 2 parâmetros para configuração manual: 1. "Candle calculation method" - 2 modos de geração
Scalping and Binary Signal Detector - Indicador de scalping que fornece sinais direcionais para abertura de posições ao longo da tendência. O indicador é um sistema de negociação completo que pode ser usado para Forex e opções binárias. O sistema de algoritmos permite reconhecer movimentos intensos de preços em diversas barras consecutivas. O indicador fornece vários tipos de alertas para setas. Funciona em quaisquer instrumentos de negociação e prazos (recomendado M5 ou superior). Como usar pa
Level Breakout Indicator é um produto de análise técnica que funciona a partir dos limites superior e inferior, que pode determinar a direção da tendência. Funciona na vela 0 sem redesenhar ou atrasos. Em seu trabalho utiliza um sistema de diversos indicadores, cujos parâmetros já foram configurados e combinados em um único parâmetro - “ Scale ”, que realiza a gradação dos períodos. O indicador é fácil de usar, não requer nenhum cálculo, usando um único parâmetro você precisa selecionar a gradaç
Filtro:
Sem comentários
Responder ao comentário