• Genel bakış
  • İncelemeler
  • Yorumlar

Wave Synchronizer MT5

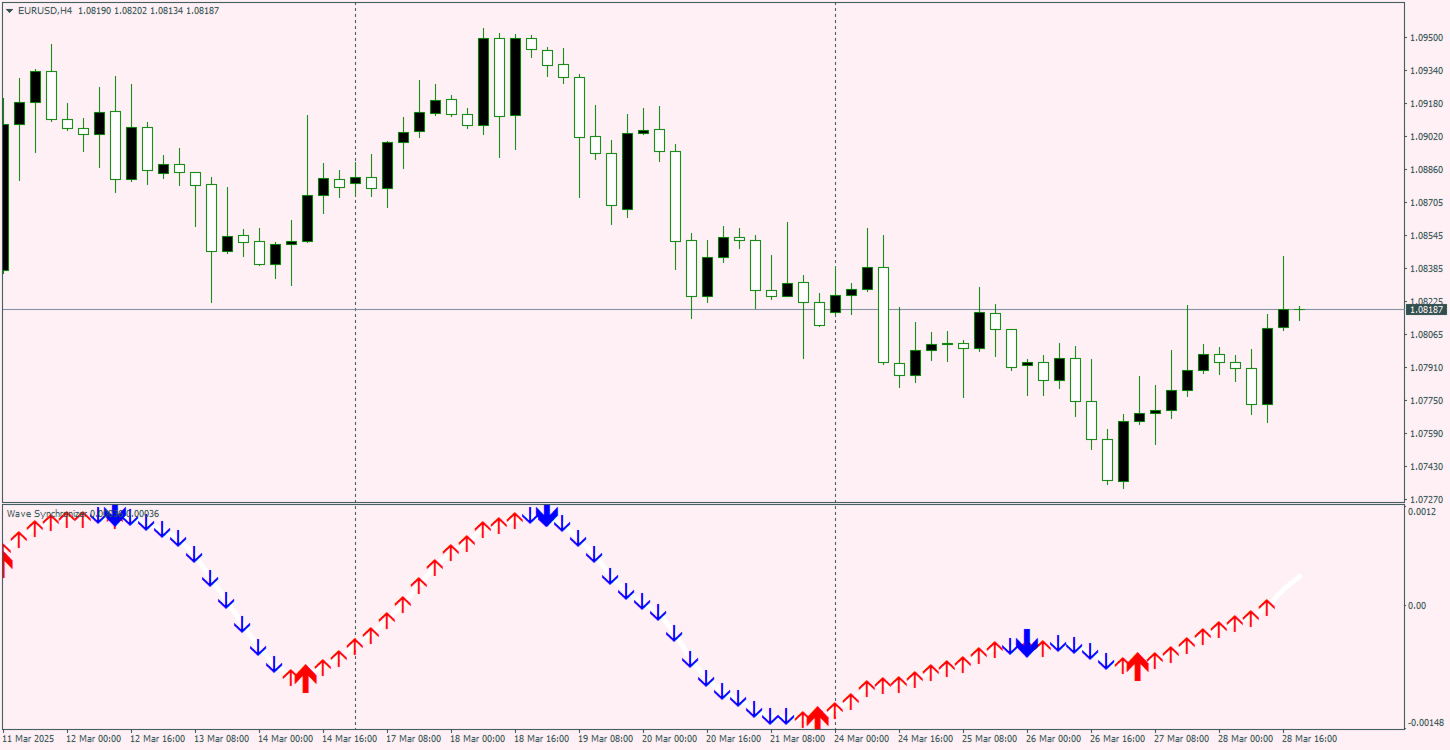
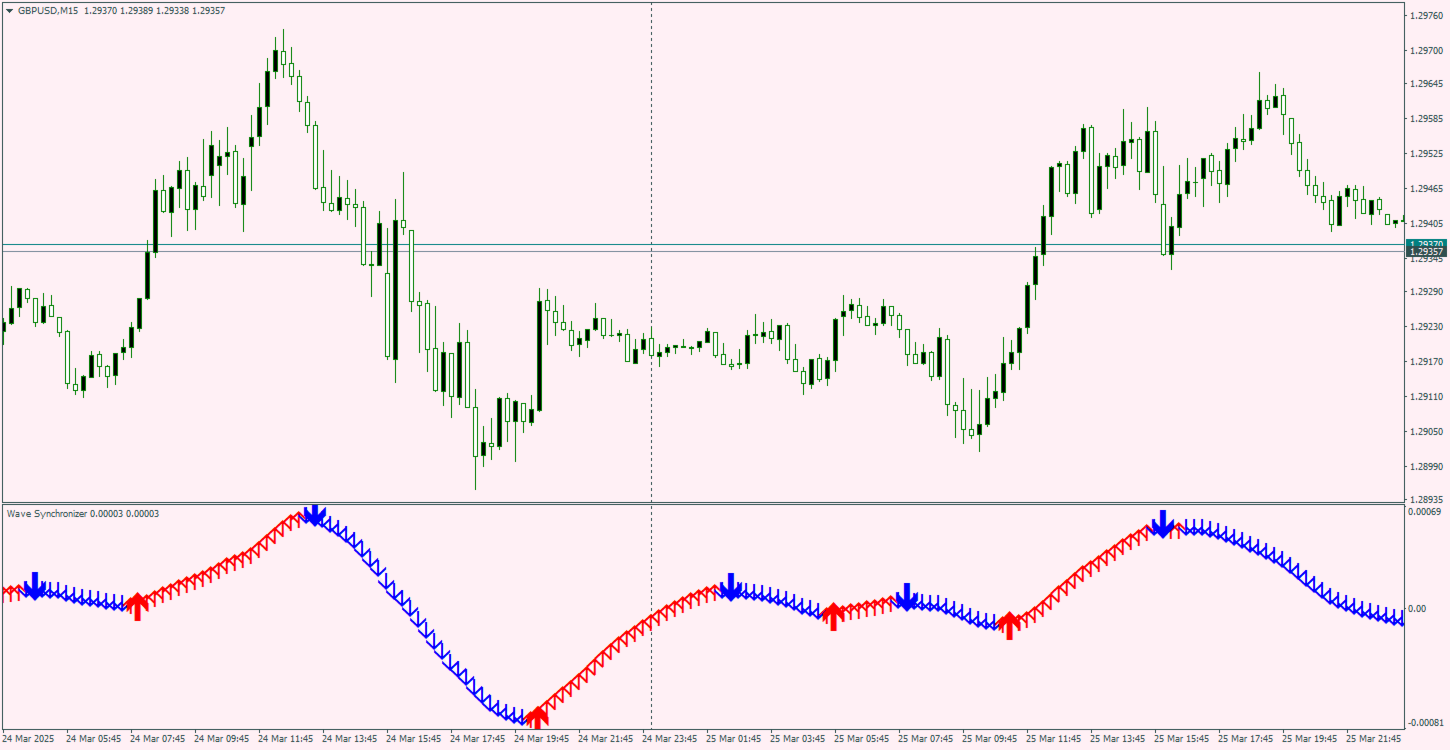
Dalga Senkronizatörü - Dalga analizinin görsel göstergesi. Mum hareket dizilerini birleştirir ve piyasayla senkronize hareketler üreten yönlü dalga desenleri üretir.
Her dalganın başlangıcı bir sinyal okuyla başlar, ayrıca bildirimler de vardır.

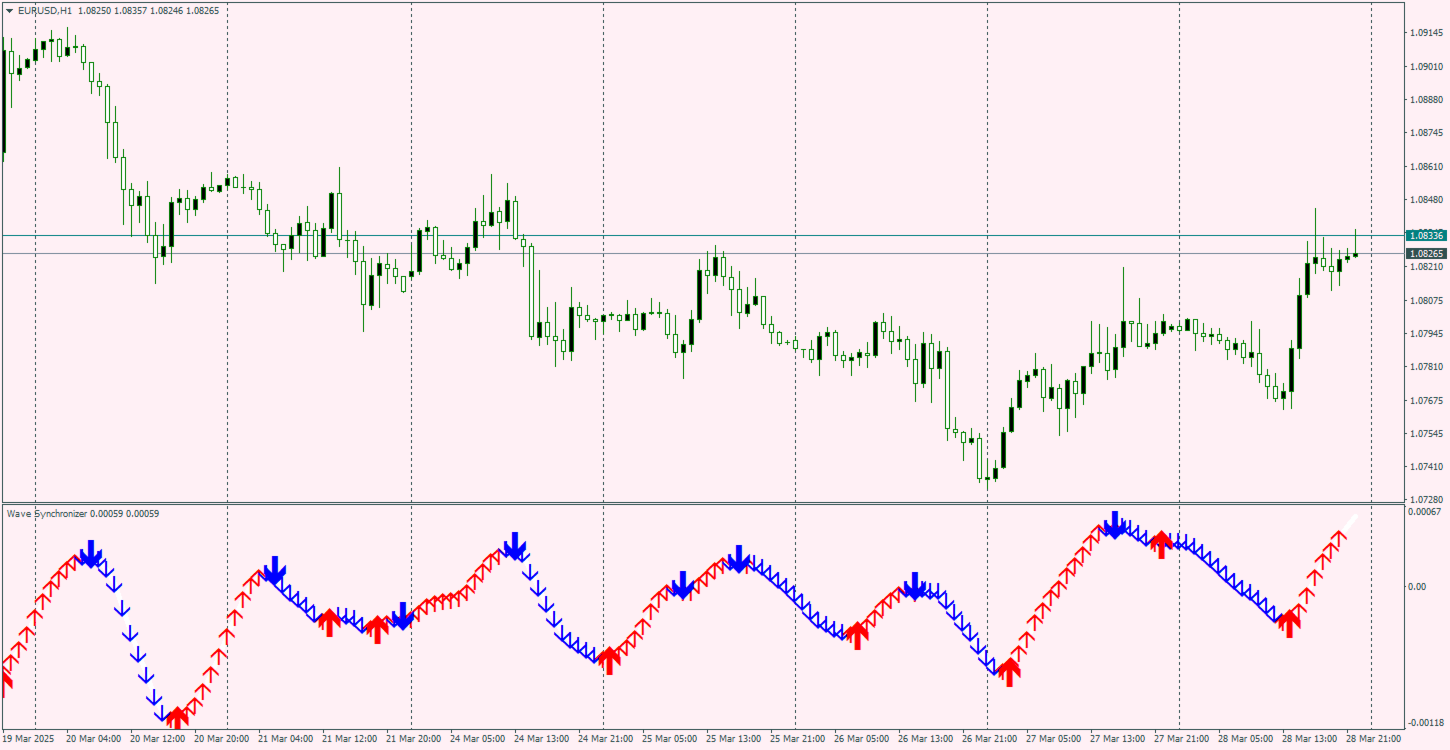
Gösterge geçmiş tarihlerdeki okları asla yeniden çizmeyecek veya hareket ettirmeyecektir.
Mumun kapanışında sinyal okları belirir.
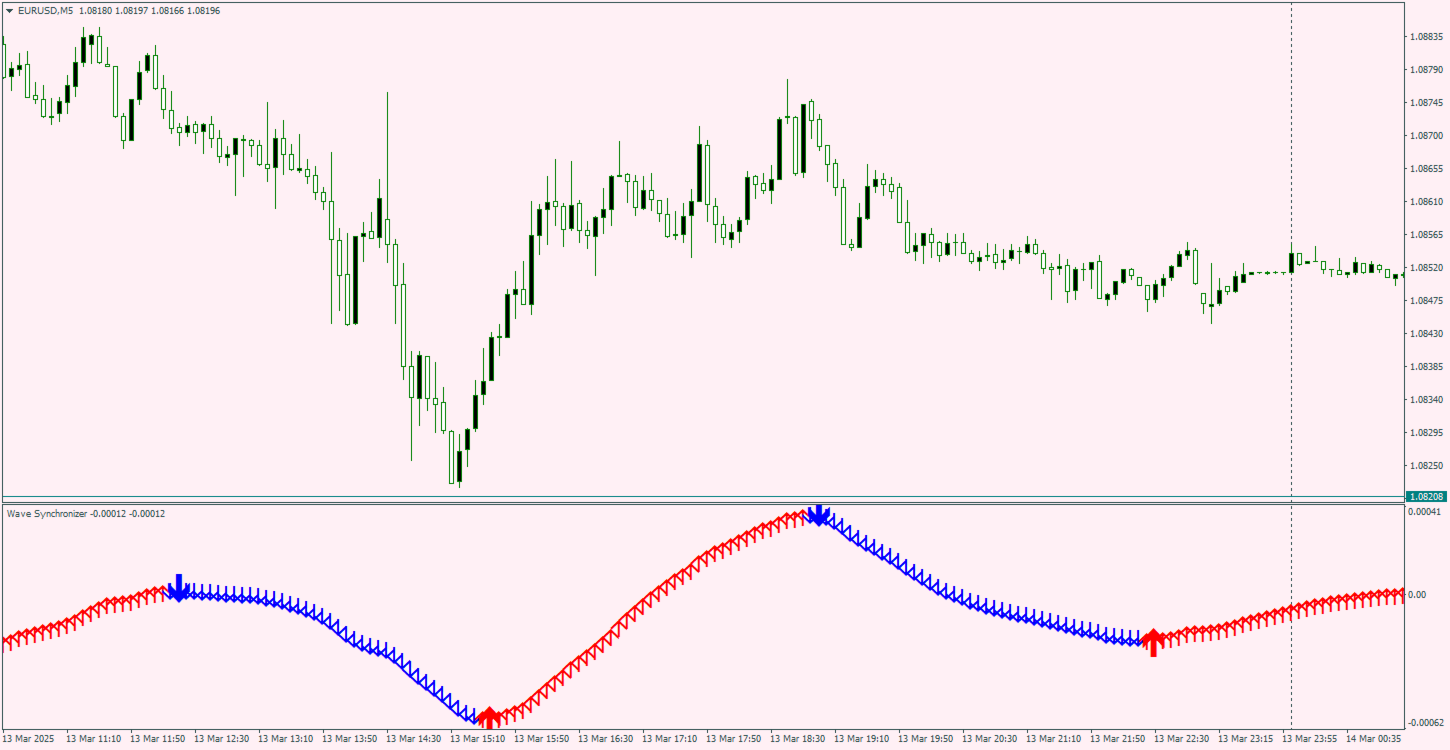
Her türlü işlem enstrümanı ve zaman dilimiyle çalışmaya uygundur.
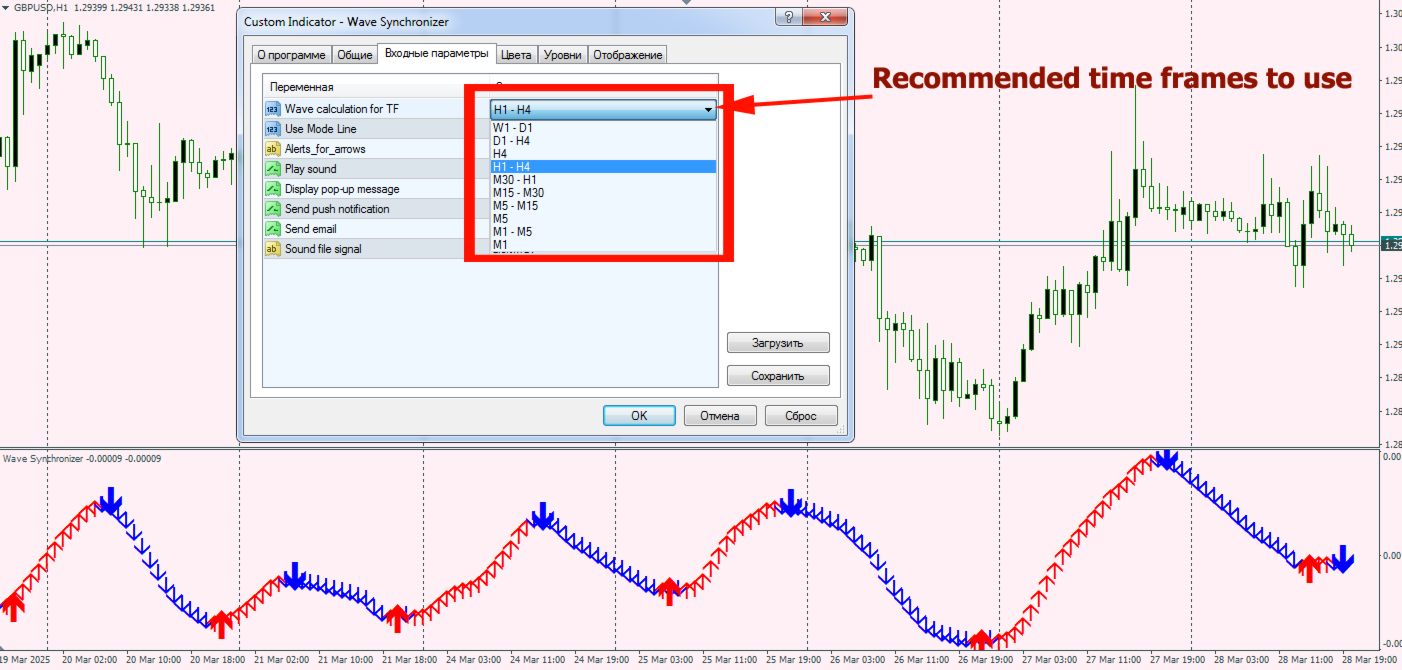
Kullanımı ve yapılandırması kolaydır, sadece 2 giriş parametresi içerir: seçili parametrelerle kullanılacak zaman diliminin seçimi ve MA hatlarının hesaplanma yöntemi.
Önerilen parametreler 1-2 periyot kaydırılabilir.

Bir işlem varlığının satın alınması için kırmızı ok yönü.
Bir işlem varlığının satışı için mavi ok yönü.

Önerilen ürünler
Signal Eskiya, in addition to channel lines, reflects entry signals in the form of arrows. Trading strategies using the channel indicator belong to the classic methods of technical analysis, are easy to execute, and therefore available even to beginners. Price ranges work equally well on any trading assets and timeframes, they can be used both independently and with additional confirmation from oscillators and market volumes. American traders say: “Trend is your friend”, which means “Trend is
The indicator ‘Probability Range Bands’ gives a prediction of the amount, how much the asset is moving from its current price. The range bands give probabilities, that the candle close will not exceed this certain price level. It is also called the expected move for the current candle close.   This Indicator is based on statistical methods, probabilities and volatility. Asset price is assumed to follow a log-normal distribution. Therefore, log returns are used in this indicator to determine the
Simple EA with 1 SMA and Fibonacci. The Expertadvisor opens positions in the direction of the trend when price levels have exceeded or fallen below the Fibonacci levels. It depends on the market in question and which parameters to use. The EA is programmed in such a way that optimization runs consume little time. A news filter and filter by day of the week are built in.
The Wamek Support and Resistant (WSR) Indicator is a remarkable tool that stands out in the world of technical analysis. It sets itself apart by cleverly combining price action and leading indicators to delineate support and resistance levels with a high degree of accuracy. Its unique feature is its adaptability; users can fine-tune the indicator by adjusting input parameters, enabling them to create customized support and resistance levels that suit their trading strategies. Notably, one of WSR
Disclaimer : Keep in mind that seasonal patterns are not always reliable. Therefore, thoughtful risk management is crucial to minimize losses.  Seasonal patterns in the financial world are like a well-guarded secret that successful investors use to their advantage. These patterns are recurring price movements that occur during specific periods or around special events. Additionally, there are also intraday patterns that repeat. For example, Uncle Ted from Forex Family suggests examining previou
FIBO Trend PRO mt5
Evgenii Aksenov
4.5 (2)
The indicator allows you to instantly determine the current trend by color and FIBO levels. Higher Timeframe the panel shows the current trend of higher periods, helping to determine the strength of the trend. Trade according to the trend when changing the color of candles or trade against the trend when the price hit the extreme levels of the FIBO Trend PRO  indicator   Advantages of the FIBO Trend PRO Indicator never repaint and does not change their values Very easy to use and intuitive Appl
This indicator calculates and displays Murrey Math Lines on the chart. This MT5 version is similar to the МТ4 version: It allows you to plot up to 4 octaves, inclusive, using data from different time frames, which enables you to assess the correlation between trends and investment horizons of different lengths. In contrast to the МТ4 version, this one automatically selects an algorithm to search for the base for range calculation. You can get the values of the levels by using the iCustom() funct
Piyasa yapıları, daha yüksek bir zaman diliminde kırıldığında, bir tüccar için bir eğilimi temizlemeye yardımcı olabilecek yapılardır. 1. Bu gösterge ZigZag'ı yalnızca son 2 yapıya çekecektir (önceki ZigZag'ın en yüksek ve en düşük seviyesi) ve yeni bir ZigZag çubuğu yalnızca yapı kırılması gerçekleştiğinde oluşacaktır 2. Yapının bozulması durumunda Terminal ve Push bildirimi verir. 3. Salınımı ayarlamak için [ ve ] tuşlarından ZigZag Derinliğini Artırın ve Azaltın 4. Line AB BC ve CD'nin re
Glider
Vitalii Zakharuk
The Glider indicator gives accurate and timely signals to enter and exit the transaction that appear on the current candle. Using the indicator is very simple. When a dot and a blue line appear, open a buy deal. When a dot and a red line appear, open a sell deal. The main purpose of this indicator is to determine the moments of entry and exit from transactions, therefore the Glider indicator will display only the trend line and entry points, i.e. displays displays the entry points to the marke
CCI Profesional
Ignacio Agustin Mene Franco
CCI Professional, has the simple fact of being able to do a scalping or intraday without using any other indicator to take some operation taking advantage of the rebounds in the lines of -200 for long and +200 for short, it is very easy to use and very practical for each market, it can be used for crash and boom since it works very well to hunt spikes, for volatiles and jumps, also for forex. It is used in any temporality.
Considering the main theories of Forex (Dow Theory, support lines, chart patterns, and Fibonacci retracements), It tells you the price range where whales (large investors) are likely to appear. You can trade at the price points that professionals also aim for. You no longer have to warry about where to aim next. We are live-streaming the actual operation of the system. Please check for yourself if it is usable. Please check it out for yourself. https://www.youtube.com/@ganesha_forex We do not
I recommend you to read the  product's blog  (manual) from start to end so that it is clear from the beginning what the indicator offers. This multi time frame and multi symbol supply and demand zone dashboard indicator sends alerts when the price has reached a supply/demand zone. It is also possible to use it to be alerted about regular double tops/bottoms instead of zones. It can be used with all time frames from M1 to MN. Maximum 9 time frames can be shown in the dashboard at the same time. 
Simple indicator to calculate fibonacci retracement levels on time. Add to chart and move trend line to set the fibonacci retracement levels. Inputs Levels  - levels for which to calculate values, separated by space, default are fibonacci levels Show time  - if true, time will be shown on levels Show date  - if true, date will be shown on levels Show fibonacci level  - if true, value of levels will be shown Fibonacci lines color  - color of levels Trend line color  - color of trend line which de
FREE
DM IND Exclusive
Sergio Vidal Prado
Indicador Para Opções Binarias. Indicator for Binary Options Usa dois gales. Instalar em mt5 Esse indicador é para ser usado no tempo de vela de 5 minutos e em M5. Este também funciona em M1, porém é mais eficiente em M5. Só descompactar e copiar os arquivos na pasta de dados do seu MT5. Arquivos indicator na pasta MQL5 - Indicator. Baixe também a Media Movel totalmente gratis: https://www.mql5.com/pt/market/product/50400 Esse Indicador é para a próxima vela. Apareceu a seta, só aguardar a próx
Harmonik desenler EA Açıklamayı okumak yerine bunu canlı bir grafikte görmeyi tercih ederseniz,   buradan anında ücretsiz bir demo indirebilirsiniz. Dahil edilen desenler: ABCD deseni Gartley deseni yarasa deseni şifre deseni 3Sürücü deseni Siyah Kuğu deseni Beyaz Kuğu deseni Quasimodo deseni veya Üzeri Alt deseni Alternatif Yarasa deseni kelebek deseni Derin Yengeç deseni Yengeç deseni Köpekbalığı deseni FiveO deseni baş ve omuzlar desen Artan Üçgen deseni bir iki üç desen Ve 8 özel desen Voe
Titan Backup
Elies Noah Siebenpfeiffer
Introducing Titan Backup : Are you ready to enhance your trading game with an automated system built for precision and flexibility? Meet Titan Backup , your expert trading assistant designed to capture high-profit breakouts by identifying accumulation zones . This powerful Expert Advisor (EA) excels in high-volatility markets such as the Nasdaq 100 and Crypto 10 , offering both hands-free automation and manual assistance to support your trading strategies. How Titan Backup Works: Titan Backup ru
Moving pivot Average Fibonacci The  indicator compares the selected period with its counterpart from the previous period. The indicator determines the moving Fibonacci levels for the day or any time interval to assess the price movement range from the time average. The indicator helps predict the expected high or low for the day based on historical time data. The pivot line can be considered an average trend line and use it in a variety of trading strategies. If you have any question about the
Product Description: Adaptive Y-Axis Scaling is a powerful MT5 indicator designed to enhance your trading experience by providing precise control over the Y-axis (price) scaling of your charts. This innovative tool allows you to customize the price scaling by specifying the number of pips from the visible chart's highs and lows. The calculated price range from this input is then used to set the maximum and minimum prices for the open chart, ensuring an optimized and comprehensive view of market
FREE
Expert Market Edge is scalping, trending, reversal indicator, with alerts . You can use it all and fit with your strategy whatever it fits you. My recommendation is to combine with my Colored RSI , and when 2 signals are matched, and pointing same direction (for example buy on this indicator, and green on RSI, you can take a long position, stop loss should be last local low, if you want to be more conservative, add ATR. ) you can take position. If you using moving averages, that's even better i
DYJ WITHDRAWAL PLAN: Trend Dönüşüm Ticaret Sistemi   1. DYJ WITHDRAWAL PLAN Nedir? DYJ WITHDRAWAL PLAN , piyasa trendinin yön değiştirdiği anları otomatik olarak tespit eden ve   otomatik alım-satım (pozisyon açma ve kapama)   işlemlerini gerçekleştiren akıllı bir   trend dönüşüm ticaret sistemidir . Sistem,   her türlü işlem enstrümanı ve tüm aracı kurumlarla (broker)   uyumlu çalışır. İster   Forex   ister   Sentetik Endeksler   olsun, her platformda sorunsuz şekilde işlem yapabilir.
Highest High and Lowest Low (HH_LL) Indicator Description: The HH_LL Indicator is a trading tool designed to help traders identify key market points by automatically drawing Higher High (HH) and Lower Low (LL) lines across multiple timeframes. This indicator allows traders to easily spot significant levels on the chart, facilitating more accurate trading decisions. Key Features: Multi-Timeframe Analysis: The indicator supports various timeframes, including M30, H1, and H4. This enables traders t
FREE
Boom Rocket
Cairo Neto Sergio Ndava
This Expert Advisor is designed exclusively for trading the Boom market on the 1-minute timeframe. It operates solely in the sell direction, focusing on precise exits at specific moments in time. Unlike typical signal bots, this EA doesn’t generate buy/sell alerts but executes trades based on a well-defined strategy to take advantage of price movements during market pullbacks. Key Features: Works exclusively for Boom market : The EA is tailored for Boom markets and functions only on the Boom as
Description of the Indicator Trend Stop shows the highest/lowest value of the last N periods. Can help traders identify the trend direction and potential stop levels.    Use Trend Stop indicator to detects the trend direction. Downtrend if the price crosses the Trend Stop line upwards  Uptrend if the price crosses the Trend Stop line downwards  Use Trend Stop indicator to  define  optimal stop levels. Downtrend Place your stops  above the Trend Stop line Uptrend Place your stops below the Tren
MasterCharts
Alexander Berger
You can think of these indicators as moving pivot points. MasterChartsTrading Price Action Indicators show good price levels to enter or exit a trade. The Blue indicator line serves as a Bullish Trend setter. If your instrument closes above the Blue line, we think about going Long (buying). When your trading instrument closes below the Red line, we think about Shorting (selling). It is very easy to read price action if you have a reference point. These support/resistance lines are there to help
NTL Pivot Lines
Northen Trading Labs
Pivot Lines (PL) User Guide Overview and Features The Pivot Lines Indicator (PL) provides traders with a powerful tool for identifying potential support and resistance levels based on well-established pivot point calculation methods. By offering insights into possible price turning points, this indicator helps traders make more informed trading decisions and refine their entry and exit strategies. With customizable settings for different timeframes and calculation methods, PL is versatile and a
Introduction to Harmonic Pattern Scenario Planner The present state of Forex market can go through many different possible price paths to reach its future destination. Future is dynamic. Therefore, planning your trade with possible future scenario is an important step for your success. To meet such a powerful concept, we introduce the Harmonic Pattern Scenario Planner, the first predictive Harmonic Pattern Tool in the world among its kind. Main Features Predicting future patterns for scenario
Ric
Sabina Fik
With this indicator, you can   predict future price behavior   for a certain number of bars ahead, giving you the ability to anticipate market dynamics. The indicator draws a   forecast line , which models potential future price values based on sophisticated algorithms analyzing past data. This information can be leveraged not only for market entry and exit decisions but also for setting or adjusting stop-loss levels to better manage your positions. Application of the Forecast The data provided
Zigzag X Fibo
Ian David Emmanuel Bello
The ZigZag indicator's main objective is to highlight significant price movements by filtering out minor price fluctuations. It enables the visualization of trends by eliminating market "noise," which can assist traders in making more informed decisions. Adding the Fibonacci indicator, which is a powerful tool for identifying potential support and resistance levels in financial markets.
mql4 version:  https://www.mql5.com/en/market/product/44606   Simple indicator to calculate profit on fibonacci retracement levels with fixed lot size, or calculate lot size on fibonacci levels with fixed profit. Add to chart and move trend line to set the fibonacci retracement levels. Works similar as default fibonacci retracement line study in Metatrader. Inputs Fixed  - select what value will be fix, lot or profit Fixed value  - value that will be fix on all levels Levels  - levels for which
Bu ürünün alıcıları ayrıca şunları da satın alıyor
Moneytron — профессиональный сигнальный индикатор тренда Индикатор Moneytron предназначен для тех, кто хочет зарабатывать стабильно и системно, торгуя по тренду. Он автоматически определяет: • Точки входа (Buy/Sell сигналы) • 3 уровня тейк-профита (TP1, TP2, TP3) • 3 уровня стоп-лосса (SL1, SL2, SL3) • Показывает реальную статистику успешности сделок прямо на графике Особенности: • Работает на всех валютных парах и металлах • Идеален для таймфреймов M30, H1 и выше • Подходит как для начинающи
Trade smarter, not harder: Empower your trading with Harmonacci Patterns This is arguably the most complete harmonic price formation auto-recognition indicator you can find for the MetaTrader Platform. It detects 19 different patterns, takes fibonacci projections as seriously as you do, displays the Potential Reversal Zone (PRZ) and finds suitable stop-loss and take-profit levels. [ Installation Guide | Update Guide | Troubleshooting | FAQ | All Products ] It detects 19 different harmonic pri
Quantum TrendPulse
Bogdan Ion Puscasu
5 (13)
SuperTrend   ,   RSI   ve   Stochastic'in   gücünü tek bir kapsamlı göstergede birleştirerek işlem potansiyelinizi en üst düzeye çıkaran nihai işlem aracı olan   Quantum TrendPulse'u   tanıtıyoruz. Hassasiyet ve verimlilik arayan yatırımcılar için tasarlanan bu gösterge, piyasa trendlerini, momentum değişimlerini ve en uygun giriş ve çıkış noktalarını güvenle belirlemenize yardımcı olur. Temel Özellikler: SuperTrend Entegrasyonu:   Güncel piyasa trendlerini kolayca takip edin ve karlılık dalgası
MTF Supply Demand Zones MT5
Georgios Kalomoiropoulos
5 (1)
Yeni Nesil Otomatik Arz ve Talep Bölgeleri. Her Grafikte Çalışan Yeni ve Yenilikçi Algoritma. Tüm Bölgeler Piyasanın Fiyat Hareketine Göre Dinamik Olarak Oluşturulmaktadır. İKİ TÜR UYARI --> 1) FİYAT BİR BÖLGEYE ÇIKTIĞINDA 2) YENİ BİR BÖLGE OLUŞTURDUĞUNDA Bir tane daha işe yaramaz gösterge almazsın. Kanıtlanmış Sonuçlarla eksiksiz bir Ticaret Stratejisi elde edersiniz.     Yeni özellikler:     Fiyat Arz/Talep Bölgesine ulaştığında uyarılar     Yeni bir Arz/Talep Bölgesi oluşturulduğunda
The   Time_Price_SQ9_Degree   indicator is based on the 9 Gann square. Using this indicator, you can identify strong time and price zones. The indicator displays the levels as a degree value. The degrees can be set in the settings. After launching, the MENU button appears. If it is highlighted, it can be moved to any point on the graph, and after double-clicking on it, it stops being highlighted and menu buttons appear. To hide the menu, just double-click on the button, it will become highlight
Precision Index Osilatörü (Pi-Osc) - Precision Trading Systems'dan Roger Medcalf Sürüm 2, grafiklerinizde hızlı bir şekilde yüklenmek üzere dikkatle yeniden kodlandı ve deneyimi artırmak için bazı teknik geliştirmeler de içerdi. Pi-Osc, herkesin stoplarını almak için zorlanan pazarların gitmek zorunda kaldığı aşırı yorgunluk noktalarını bulmak için tasarlanmış doğru ticaret zamanlama sinyalleri sunmak amacıyla oluşturuldu. Bu ürün, aşırı noktaların nerede olduğunu bilmek gibi yaşlı bir sorun
Ortalama geri dönüş ticareti için profesyonel ve nicel bir yaklaşım uygulayan benzersiz gösterge. Fiyatın tahmin edilebilir ve ölçülebilir bir şekilde ortalamaya döndüğü ve yön değiştirdiği gerçeğinden yararlanır, bu da nicel olmayan ticaret stratejilerinden büyük ölçüde daha iyi performans gösteren net giriş ve çıkış kurallarına izin verir. [ Installation Guide | Update Guide | Troubleshooting | FAQ | All Products ] Ticaret sinyallerini temizle Ticaret yapmak inanılmaz derecede kolay Özelleşt
Legend mt5
Vladyslava Shaviernieva
This is an indicator that includes the best basic forex indicators , without redrawing. Based on this data, a sell or buy signal is generated. It does not disappear anywhere after the signal, which gives us the opportunity to see the results on the history. It can be used on any currency pair, crypto, metals, stocks It is best used on an hourly chart, but other periods are also acceptable. The best results for the period H1,H4,daily If customers have any questions, I will answer them and af
TPSpro RFI Levels MT5
Roman Podpora
4.55 (20)
Geri dönüş bölgeleri / Tepe hacimleri / Önemli bir oyuncunun aktif bölgeleri =       TS TPSPROSİSTEMİ TALİMATLAR RUS       /       TALİMATLAR       ENG       /           Sürüm MT4        Bu göstergenin her alıcısı ayrıca ÜCRETSİZ şunları elde eder: RFI SIGNALS servisinden işlem sinyallerine 6 ay erişim - TPSproSYSTEM algoritmasına göre hazır giriş noktaları. Düzenli olarak güncellenen eğitim materyalleri - stratejiye dalın ve profesyonel seviyenizi yükseltin. Hafta içi 7/24 destek ve kapalı ya
FxaccurateLS
Shiv Raj Kumawat
WHY IS OUR FXACCCURATE LS MT5 THE PROFITABLE ? PROTECT YOUR CAPITAL WITH RISK MANAGEMENT Gives entry, stop and target levels from time to time. It finds Trading opportunities by analyzing what the price is doing during established trends. POWERFUL INDICATOR FOR A RELIABLE STRATEGIES We have made these indicators with a lot of years of hard work. It is made at a very advanced level. Established trends provide dozens of trading opportunities, but most trend indicators completely ignore them! The
KT Trend Trading Suite MT5
KEENBASE SOFTWARE SOLUTIONS
KT Trend Trading Suite, trend takibi stratejisini birden fazla kırılma noktasıyla birleştiren çok özellikli bir göstergedir. Bu kırılma noktaları giriş sinyali olarak kullanılır. Yeni bir trend oluştuğunda, bu gösterge o trendi yakalayabilmek için birçok giriş fırsatı sunar. Daha az önemli giriş noktalarını filtrelemek için bir geri çekilme eşiği kullanılır. MT4 sürümüne buradan ulaşabilirsiniz  https://www.mql5.com/en/market/product/46268 Özellikler Piyasa dinamiklerini tek bir denklem içi
Blahtech Supply Demand MT5
Blahtech Limited
4.54 (13)
Was: $299  Now: $149  Supply Demand uses previous price action to identify potential imbalances between buyers and sellers. The key is to identify the better odds zones, not just the untouched ones. Blahtech Supply Demand indicator delivers functionality previously unavailable on any trading platform. This 4-in-1 indicator not only highlights the higher probability zones using a multi-criteria strength engine, but also combines it with multi-timeframe trend analysis, previously confirmed swings
TPA True Price Action indicator reveals the true price action of the market makers through 100% non-repainting signals strictly at the close of a candle! TPA shows entries and re-entries, every time the bulls are definitely stronger than the bears and vice versa. Not to confuse with red/green candles. The shift of power gets confirmed at the earliest stage and is ONE exit strategy of several. There are available now two free parts of the TPA User Guide for our customers. The first "The Basics"
MT4 Version SMT Divergences MT5 SMT Divergences is one of the most innovative indicators in the market. It offers the possibility of analyzing price divergences between 2 pairs. These divergences highlight and help to foresee what banks and institutions are planning to do. SMT divergences also provides you with a kill zones indicator and the possibility of filtering divergences occurring during these kill zones.  This indicator is specially powerful if applied in 2 highly correlated pairs. A pri
Volume by Price MT5
Brian Collard
3.25 (4)
Volume Profile, Footprint and Market Profile TPO (Time Price Opportunity). Volume and TPO histogram bar and line charts. Volume Footprint charts. TPO letter and block marker collapsed and split structure charts. Static, dynamic and flexible range segmentation and compositing methods with relative and absolute visualizations. Session hours filtering and segment concatenation with Market Watch and custom user specifications. Graphical layering, positioning and styling options to suit the user's a
CONTACT US  after purchase to get the Indicator Manual. Download Now!  Offer valid only for next 10 Buyers.  Price   will   increase  gradually !  Download the  Metatrader 4 Version Read the product description carefully before purchasing the product.  Due to regulatory restrictions, our service is unavailable in certain countries such as India, Pakistan, and Bangladesh. Disclaimer: • Our products are available only on mql5.com. • We never contact anyone or sell our products privately. • We d
CBT Quantum Maverick Yüksek Verimli İkili Opsiyon Ticaret Sistemi CBT Quantum Maverick, hassasiyet, basitlik ve disiplinli ticaret arayan yatırımcılar için tasarlanmış yüksek performanslı bir ikili opsiyon ticaret sistemidir. Özelleştirme gerekmez—bu sistem, ilk kullanımda etkili sonuçlar için optimize edilmiştir. Sinyalleri kolayca anlamak için biraz pratik yapmak yeterlidir. Ana Özellikler: Hassas Sinyaller: Yeni mum bazlı ticaret sinyalleri—mevcut mumdan sonra gelecek mum hedeflenir ve sık
This indicator identifies and displays zones, as it were areas of strength, where the price will unfold. The indicator can work on any chart, any instrument, at any timeframe. The indicator has two modes. The indicator is equipped with a control panel with buttons for convenience and split into two modes. Manual mode: To work with manual mode, you need to press the NEW button, a segment will appear. This segment is stretched over the movement and the LVL button is pressed. The level is displayed
MetaForecast M5
Vahidreza Heidar Gholami
5 (3)
MetaForecast, fiyat verilerindeki harmonileri kullanarak herhangi bir piyasanın geleceğini tahmin eder ve görselleştirir. Piyasa her zaman tahmin edilemezken, fiyatlarda bir desen varsa, MetaForecast geleceği mümkün olduğunca doğru bir şekilde tahmin edebilir. Benzer ürünlere göre, MetaForecast piyasa eğilimlerini analiz ederek daha kesin sonuçlar üretebilir. Giriş Parametreleri Past size (Geçmiş boyut) MetaForecast'ın gelecekteki tahminler oluşturmak için kullandığı çubuk sayısını belirtir. Mo
Super Zone   For several years of observing the principles of the market, Super Zone worked, both then and now, because the indicator  allows you to see the trading range of the  week and even the month that major market participants use. It’s very easy to use, we work on H4 in the weekly range (  in the tester it doesn’t work in the demo mode  ) - we sell from the upper zones, we buy from the lower ones. It marks the zones from the beginning of the week (month) that are  not redrawn  , works on
RelicusRoad Pro MT5
Relicus LLC
4.78 (18)
Şimdi 147 $ (birkaç güncellemeden sonra 499 $ 'a yükseliyor) - Sınırsız Hesaplar (PC'ler veya Mac'ler) RelicusRoad Kullanım Kılavuzu + Eğitim Videoları + Özel Discord Grubuna Erişim + VIP Durumu PİYASAYA BAKMAK İÇİN YENİ BİR YOL RelicusRoad, forex, vadeli işlemler, kripto para birimleri, hisse senetleri ve endeksler için dünyanın en güçlü ticaret göstergesidir ve yatırımcılara kârlı kalmaları için ihtiyaç duydukları tüm bilgileri ve araçları sağlar. Başlangıç ​​seviyesinden ileri seviyeye ka
PZ Trend Trading MT5
PZ TRADING SLU
3.8 (5)
Capture every opportunity: your go-to indicator for profitable trend trading Trend Trading is an indicator designed to profit as much as possible from trends taking place in the market, by timing pullbacks and breakouts. It finds trading opportunities by analyzing what the price is doing during established trends. [ Installation Guide | Update Guide | Troubleshooting | FAQ | All Products ] Trade financial markets with confidence and efficiency Profit from established trends without getting whip
Berma Bands
Muhammad Elbermawi
5 (3)
Berma Bantları (BB'ler) göstergesi, piyasa trendlerini belirlemeyi ve bunlardan yararlanmayı amaçlayan yatırımcılar için değerli bir araçtır. Fiyat ile BB'ler arasındaki ilişkiyi analiz ederek, yatırımcılar bir piyasanın trend veya aralıklı fazda olup olmadığını ayırt edebilir. Daha fazla bilgi edinmek için [ Berma Home Blog ] adresini ziyaret edin. Berma Bantları üç belirgin çizgiden oluşur: Üst Berma Bandı, Orta Berma Bandı ve Alt Berma Bandı. Bu çizgiler fiyatın etrafına çizilir ve genel tren
Timeframes Trend Scanner   is a trend analyzer or trend screener indicator that helps you know the trend in   all timeframes of selected symbol you are watching . This indicator provides clear & detailed analysis results on a beautiful dashboard, let you able to use this result right away without need to do any additional analysis. How it works Step 1: Calculate values of 23 selected & trusted technical indicators (Oscillator & Moving Average indicators) Step 2: Analyze all indicators using bes
[ MT4 Version ] Are you tired of spending months on demo or live accounts to test your trading strategies? The Backtesting Simulator is the ultimate tool designed to elevate your backtesting experience to new heights. Utilizing Metatrader historical symbol information, it offers an unparalleled simulation of real market conditions. Take control of your testing speed, test ideas quickly or at a slower pace, and witness remarkable improvements in your testing performance. Forget about wasting tim
Was: $249  Now: $149   Market Profile defines a number of day types that can help the trader to determine market behaviour. A key feature is the Value Area, representing the range of price action where 70% of trading took place. Understanding the Value Area can give traders valuable insight into market direction and establish the higher odds trade. It is an excellent addition to any system you may be using. Inspired by Jim Dalton’s book “Mind Over Markets”, this indicator is designed to suit the
CONTACT US  after purchase to get the Indicator Manual. Try Now—Limited Discount for the next 10 Buyers! Download the  Metatrader 4 Version Read the product description carefully before purchasing the product.  Due to regulatory restrictions, our service is unavailable in certain countries such as India, Pakistan, and Bangladesh. Disclaimer: • Our products are available only on mql5.com. • We never contact anyone or sell our products privately. • We do not provide any personal trading advice.
Visual Heatmap Book Analyzer
Alexandre Moraes De Souza Lima
Visual Heatmap Book Analyser This indicator monitors the market liquidity and generates colors based on order patterns, quantities, and renewal activities in the book. This allows you to visualize the order flow and identify areas of high and low liquidity and activity. The indicator uses machine learning techniques to analyze the order behavior in the book, enabling it to detect patterns and trends in orders, allowing you to make informed decisions about your trading operations. The color pale
Malaysian SNR Levels
Matthias Horst Pieroth
This indicator can be used to display Support and Resistance levels according to  the  Malaysian SNR concept , in which Support and Resistance are exact levels of a line chart. Malaysian SNR There are 3 different horizontal levels in Malaysian SNR: A-Level : This level is located at the peak of this line chart. (shape looks like the letter A) V-Level : Level at the valley of a line chart, (shape looks like the letter V) Gap-Leve l: This level is located at the Close/Open gap between two candle
Introduction to Fractal Pattern Scanner Fractal Indicator refers to the technical indicator that makes use of the fractal geometry found in the financial market. Fractal Pattern Scanner is the advanced Fractal Indicator that brings the latest trading technology after the extensive research and development work in the fractal geometry in the financial market. The most important feature in Fractal Pattern Scanner is the ability to measure the turning point probability as well as the trend probabil
Yazarın diğer ürünleri
Volatility Trend System - girişler için sinyaller veren bir ticaret sistemi. Oynaklık sistemi, trend yönünde doğrusal ve noktasal sinyaller ve ayrıca yeniden çizme ve gecikme olmaksızın trendden çıkmak için sinyaller verir. Trend göstergesi, orta vadeli trendin yönünü izler, yönünü ve değişimini gösterir. Sinyal göstergesi volatilitedeki değişikliklere dayalıdır ve piyasa girişlerini gösterir. Gösterge, çeşitli uyarı türleri ile donatılmıştır. Çeşitli alım satım araçlarına ve zaman dilimlerine
Ticaret ve piyasa yönünü tahmin etmek için döngüsel gösterge. Fiyatın döngüsel davranışını osilatör biçiminde gösterir. Osilatörün üst ve alt sınırlarından bir geri dönüş olduğunda, işlem açılmasına yönelik sinyaller verir. Histogram biçiminde trendin yumuşatılmış gücünü gösterir.  Ölçeklendirmeden gün içi işlemlere kadar her türlü ticaret stratejisini tamamlayacak.  Gösterge yeniden çizilmez.  Tüm sembollerde/aletlerde kullanıma uygundur.  Kısa vadeli işlemler için uygun zaman dilimleri M5, M1
Forex için manuel ticaret ve teknik analiz göstergesi. İşlem gününün açılış seviyesini gösteren bir trend göstergesi ve giriş noktalarını belirlemek için bir ok göstergesinden oluşur. Gösterge yeniden renklenmez; mum kapandığında çalışır. Sinyal okları için çeşitli uyarı türleri içerir. Herhangi bir grafikte, alım satım aracında veya zaman diliminde çalışacak şekilde yapılandırılabilir. Çalışma stratejisi trend boyunca fiyat hareketlerini aramaya dayanmaktadır.  " Buy " işlemleri yapabilmek
Grafikleri yapılandıran ve döngüsel fiyat hareketlerini belirleyen teknik bir gösterge. Herhangi bir grafik üzerinde çalışabilirim. Birkaç çeşit bildirim var. Grafiğin kendisinde ek oklar var. Tarihe yeniden bakmadan, mumun kapanışına dair çalışmalar. M5 ve üzeri TF önerilir. Kullanımı ve yapılandırması kolay parametreler. Farklı parametrelere sahip 2 indikatörü kullanırken, bunları diğer indikatörler olmadan da kullanabilirsiniz. 2 giriş parametresi vardır Döngüsellik ve Sinyal Süresi Bu 2 pa
Trend göstergeleri, finansal piyasalarda işlem yaparken kullanılan teknik analiz alanlarından biridir. Angular Trend Lines indikatörü - trend yönünü kapsamlı bir şekilde belirler ve giriş sinyalleri üretir. Mumların ortalama yönünü yumuşatmanın yanı sıra Trend çizgilerinin eğim açısından da yararlanılır. Eğim açısının hesaplanmasında Gann açılarının inşa ilkesi esas alındı. Teknik analiz göstergesi mum çubuğu yumuşatması ile grafik geometrisini birleştirir. İki tür trend çizgisi ve ok vardır: K
Point Trend Indicator - Trendin yönünü belirleyebilen ve güçlendiğini gösterebilen, trendin üst ve alt seviyelerinin göstergesi. Trend yönü yuvarlak noktalarla belirlenir; noktalar sıfır çizgisinin üzerindeyse trend yükseliş, altındaysa trend düşüş yönündedir. Yön hareketindeki artış oklarla gösterilmiştir. Manuel ayarlama için tek parametreye sahiptir - Trend yönünün süresi.   Olasılıklar Tüm zaman dilimlerinde çalışır Her türlü finansal araca uyum sağlar (Forex, Hisse Senetleri, Metaller, Kri
Indicator Waiting Volatility - volatilite bölgelerini ve düz koşulları belirlemek için bir gösterge. Zamanla grafikteki fiyat farklı trendlerde olur, düşer, yükselir veya aynı kalır. Gösterge, yatırımcının fiyatın hangi trendde olduğunu belirlemesine yardımcı olur. Çalışmasında teknik analiz için çeşitli araçlar kullanır; önce trendin yönü belirlenir, ardından bu doğrultuda gösterge volatilitedeki değişiklikleri izler. Fiyat gürültü içerisinde dalgalanıyorsa takip modundadır; fiyat piyasa gürült
An indicator that determines the point levels of price resistance. The arrows indicate price bounces in the indicated directions. Arrows are not redrawn formed on the current candle, shown on the previous candle for convenience.      It has one setting - the formation intensity: If the parameter is smaller, most of the signals are formed in a wide trend. If the parameter is larger, signals are formed in a narrower trend. Input parameters Formation Intensity - Arrow Formation Intensity Number B
Line Breakouts - Trend ticareti için sistem. Dönem ve düzeltme işlevi kullanılarak herhangi bir grafiğe ve ticaret aracına uyarlanabilecek bir trend tanımlayıcı içerir. Ve destek ve direnç seviyelerinin belirleyicisi. Fiyat direnç çizgisinin altında olduğunda Satış işlemlerini açın ve fiyat destek çizgisinin üzerinde olduğunda Alım işlemlerini açın. Zararı durdur çizgilerden birkaç noktaya yerleştirilmelidir, Kâr Al zaman dilimine göre birkaç mumdan (3-10-15) sonra sabitlenmelidir. Gösterge yeni
Arrow indicator with trend filter. Generates trend input without delays or delays - on the emerging candle. Suitable for use on any trading tools and timeframes. Easy to use, contains the direction of the trend in the form of a histogram lines and signal generator. Input parameters Period Trend Line - Period of the Histogram Line Signal Generator Period - If the period is longer, then the arrows are less Play sound Display pop-up message Send push notification Send email Sound file signal - Fi
A trend indicator showing the strength of bulls and bears in a trading range. Consists of two lines: The green line is a balanced overbought/oversold condition. The red line is the direction of trading activity. Does not redraw calculations. Can be used on all Symbols/Instruments/Time Frames. Easy to use and set up. How to use the indicator and what it determines. The basic rule is to follow the direction of the red line: if it crosses the green line from the bottom up, the market is dominat
FREE
Lines Channel Pro
Vitalyi Belyh
5 (1)
The "Lines Channel Pro" indicator determines price reversals from the High/Low channel. Contains a built-in trend finder, signal lines, entry and exit points. The recommended timeframe for M15 to work is D1. For each timeframe and trading instrument, depending on the volatility, it is necessary to select individual settings. Does not redraw calculations. Input parameters Use Channel trend filter - Turn on/off the trend filter Channel trend period - Trend filter period (from 8 and above) Line
" ZigZag on Trend " göstergesi, fiyat hareketinin yönünü belirlemenin yanı sıra bir çubuk ve pip hesaplayıcıdır. Zikzak şeklinde sunulan bir trend çizgisi ile fiyatın yönünü izleyen bir trend göstergesi ve trend yönünde geçen çubuk sayısını ve dikey ölçekteki nokta sayısını hesaplayan bir sayaçtan oluşur. (Hesaplamalar çubuğun açılmasıyla yapılır) Gösterge yeniden çizilmez. Kolaylık sağlamak için renkli çubuklar veya çizgiler şeklinde tasarlanmıştır. Tüm TF'lerde kullanılabilir, ancak en iyisi M
Channel Cluster
Vitalyi Belyh
5 (1)
Cluster indicator working in the price channel. For operation, the indicator builds a channel line - (dashed line). Inside the channel, cluster sections are determined that determine the direction of the price movement - (histograms in two directions), start with large arrows. Small arrows are plotted above / below each histogram - indicator increase volatility. The indicator does not redraw the values. Works on any tools and timeframes. Entrances are made when large arrows appear, inside small
Oscillatory price direction indicator for Forex. It has 2 operating modes - trend and scalping. The trend mode of operation allows you to determine the direction of the market movement in the medium term. The scalping mode works by determining the price movement in the short term. Consists of a blue line, from which the balance between the directions of the price and signal green / red line. The green line shows the direction of the price up, and the red line shows the direction of the price dow
Zig-Zag indicator with additional signals for inputs. Visually easy to use: The red zig-zag line is an uptrend. The blue zig-zag line is a downward trend. Arrows in the form of additional signals. Works on any trading pairs. On any timeframe. Not redrawn. Input parameters Zig-Zag Period - Zig-zag period (from 5) Signal Period - period of signal arrows (from 3) Alerts for signals Play sound - Sound alert Display pop-up message - Notification by message on the screen Send push notification
Signal indicator that displays price reversals from the upper and lower corners of the chart. It is adjusted for different volatility and timeframes by one parameter - Gradation . Works on any trading pairs. The recommended timeframe for use is from M15 and higher. Not redrawn. If necessary, I will help you choose the optimal setting. Input parameters Gradation - from 0 and higher. If the parameter is larger, arrows are displayed at shorter price intervals. Alerts for signals Play sound - S
Linear indicator for trend trading together with scalping method. The yellow line is used to calculate the long-term price trend. As the yellow line moves, a scalper signal line is applied - a thin red one. A zero level is applied to confirm signals. If the yellow line crossed the zero level upwards, the trend is up. If the yellow line crossed the zero level from top to bottom, the trend is down. The signal red line works in a similar way, only its sensitivity to price movements is higher. Re
A technical indicator that calculates its readings based on trading volumes. It has an oscillatory line that follows the change in volumes. Large arrows on the line indicate reversal values. A channel is built around the line with small arrows showing the strengthening of price movement in the direction of increasing volumes. The indicator does not redraw values. Works on any instrument and timeframe. It can complement any trading strategy by finding a trend or make entries in the direction of a
This indicator is based on a trend guide line and a special oscillator, defining entry points at the moments of potential price movement. The indicator does not redraw. Works on any instrument. The most preferred time frames to use are M5, M15, M30, H1, H4. The guide trend line of the indicator gives an idea about the movement of the market. When the green line crosses the zero level from top to bottom - the market is bearish when it crosses from bottom to top - bull market. The oscillator is
Developed methods for trading collected in one indicator. In the form of arrows, it defines entries in the direction of the trend. It has 2 types of arrows - trend and signal guides, informing about the potential movement in the direction of the trend. Works without redrawing, ready for use on all symbols/tools. The most suitable time frames to use are M15, M30, H1, H4. How to use The indicator finds the direction of the trend in the form of a signal arrow, a graphic rectangle stretches along
Max Min Reversal Arrows - an arrow reversal indicator for predicting price movement. The indicator is built on the support and resistance levels at the local lows and highs of the price. Product features Arrows appear on the current candle. The indicator does not redraw. Can be used on all time frames and trading instruments. Recommended timeframes to use M30, H1, H4. The dotted lines are the support and resistance levels within the signal. Price movement from these levels means a reversal. Pr
Scalping Entry Points - fiyat hareketlerine uyum sağlayabilen ve yeniden çizmeden alım satımları açmak için sinyaller verebilen manuel bir alım satım sistemidir. Gösterge, merkezi destek ve direnç seviyesine göre trendin yönünü belirler. Nokta göstergesi, girişler ve çıkışlar için sinyaller sağlar. Manuel gün içi ticaret, ölçeklendirme ve ikili opsiyonlar için uygundur. Tüm zaman dilimlerinde ve ticaret enstrümanlarında çalışır. Gösterge birkaç türde uyarı verir. ürün nasıl kullanılır Mavi çiz
Fiyat kanalının göstergesi ve içindeki kesme noktası oluşturucu. Kullanım süresine göre fiyatın konumu hakkında fikir verir. Giriş ve çıkış anlarını belirleyen kanal sınırları ve sıçrama noktaları boyunca oluşturulmuş düzleştirilmiş trend sıçrama çizgileri içerir. Çeşitli ticaret enstrümanları ve zaman dilimleri üzerinde çalışır. gösterge ile nasıl çalışılır Kanal kesme çizgisini takip edin, mavi çizgi yukarı girişler, pembe çizgi aşağı girişler. Giriş noktaları mevcut mum üzerinde oluşturulur
Candle Binary Scalper , forex ve ikili opsiyonlar için teknik analiz ürünüdür. Bir ticaret sisteminde birleştirilmiş birkaç teknik gösterge içerir. Ölçeklendirme ve ikili opsiyonlar için bir trend içinde manuel ticaret için uygundur. Tüm zaman dilimlerinde ve ticaret enstrümanlarında çalışır. Yüksek volatilite durumunda M15, M30, H1 ve H4, M5 ve M1 ticareti için Önerilen Zaman Çerçeveleri kullanılmalıdır. Birkaç uyarı türü vardır. ürün nasıl kullanılır Her Zaman Çerçevesi için en uygun ayarlar
Binary Lines , para birimleri, emtialar, kripto para birimleri, hisse senetleri, endeksler ve herhangi bir finansal araç için teknik bir analiz göstergesidir. İkili opsiyonlar veya Forex ölçeklendirme için kullanılabilir. Giriş ve çıkış noktalarını sabit aralıklarla gösterir ve tüccarlar olası işlemlerin sonuçları hakkında gerekli bilgileri. Giriş noktaları, mumun en başında, MA çizgisi yönünde, süre boyunca oluşturulur. çubuklardaki işlemler manuel olarak ayarlanabilir ve herhangi bir finansal
İşlem hacimlerine ilişkin okumaları hesaplayan teknik bir gösterge. Histogram biçiminde, ticaret enstrümanının hareket gücünün birikimini gösterir. Yükseliş ve düşüş yönleri için bağımsız hesaplama sistemlerine sahiptir. Herhangi bir ticaret enstrümanı ve zaman dilimi üzerinde çalışır. Herhangi bir ticaret sistemini tamamlayabilir. Gösterge değerlerini yeniden çizmez, sinyaller mevcut mum üzerinde görünür. Kullanımı kolaydır ve grafiği yüklemez, ek parametre hesaplamaları gerektirmez. Değiştiril
Candle Power Signals , ticaret kararları vermek için potansiyel değişken sinyalleri arama stratejisini kullanan bir trend göstergesidir. Gösterge, piyasayı analiz ederek, yönlü trend hareketi içinde artan ve azalan volatilite bölgelerini tanımlar. Ana sinyal oluşturma parametreleri halihazırda yapılandırılmıştır; geri kalan ayarlar ve periyotlar, manuel yapılandırma için 2 parametreye endekslenmiştir: 1. "Candle calculation method" - 2 sinyal oluşturma modu, zaman dilimlerinde normal olanın (M1
Scalping and Binary Signal Detector - Trend boyunca pozisyon açmak için yön sinyalleri veren Scalping göstergesi. Gösterge, Forex ve ikili opsiyonlar için kullanılabilecek eksiksiz bir ticaret sistemidir. Algoritma sistemi, birbirini takip eden birkaç çubuktaki yoğun fiyat hareketlerini tanımanıza olanak tanır. Gösterge, oklar için çeşitli uyarı türleri sağlar. Tüm alım satım enstrümanları ve zaman dilimleri üzerinde çalışır (M5 veya Üzeri önerilir). Ticaret için nasıl kullanılır Sarı bir çubu
Level Breakout Indicato r , üst ve alt sınırlardan çalışan, trendin yönünü belirleyebilen bir teknik analiz ürünüdür. Yeniden çizim veya gecikme olmadan mum 0 üzerinde çalışır. Çalışmasında, parametreleri önceden yapılandırılmış ve dönemlerin derecelendirmesini gerçekleştiren tek bir parametre olan " Scale " halinde birleştirilmiş farklı göstergelerden oluşan bir sistem kullanır. Göstergenin kullanımı kolaydır, herhangi bir hesaplama gerektirmez; tek bir parametre kullanarak, seçilen zaman dilim
Filtrele:
İnceleme yok
İncelemeye yanıt