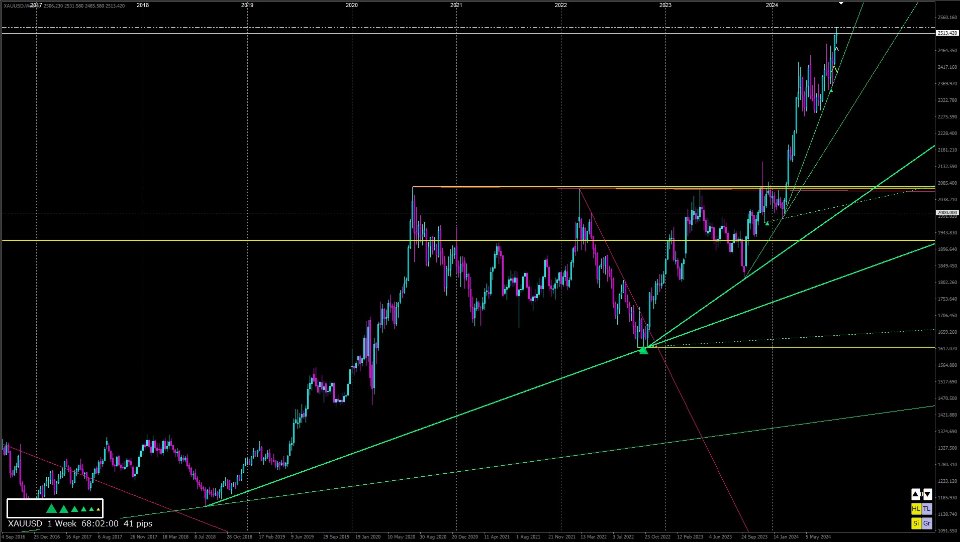
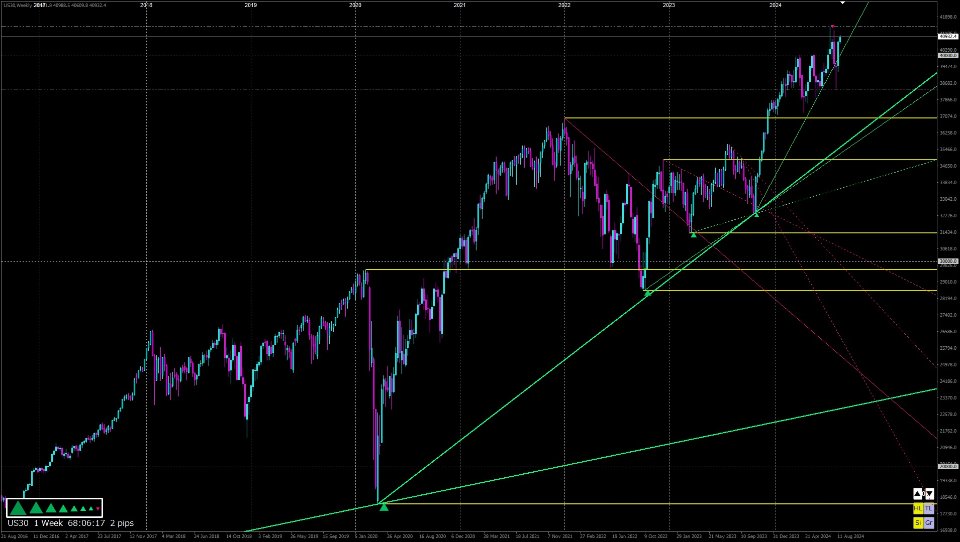
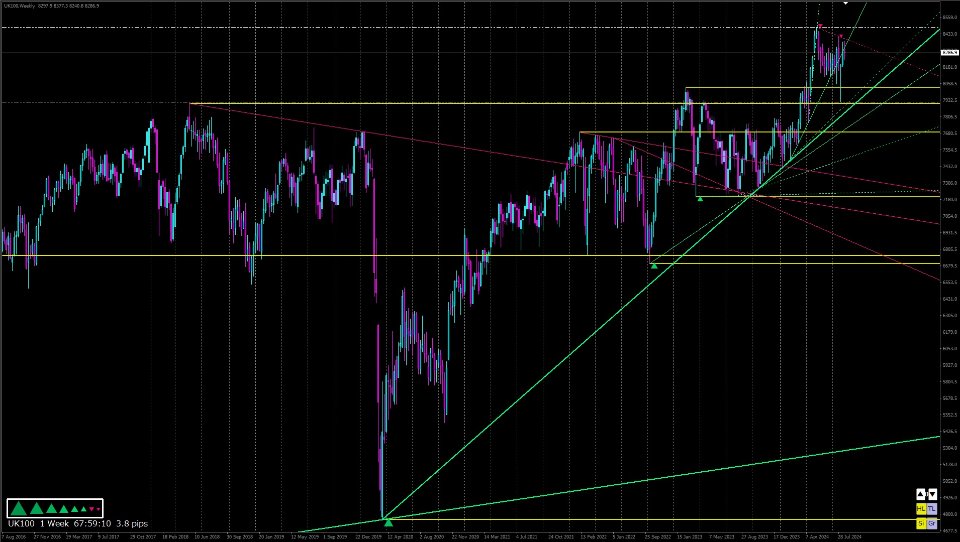
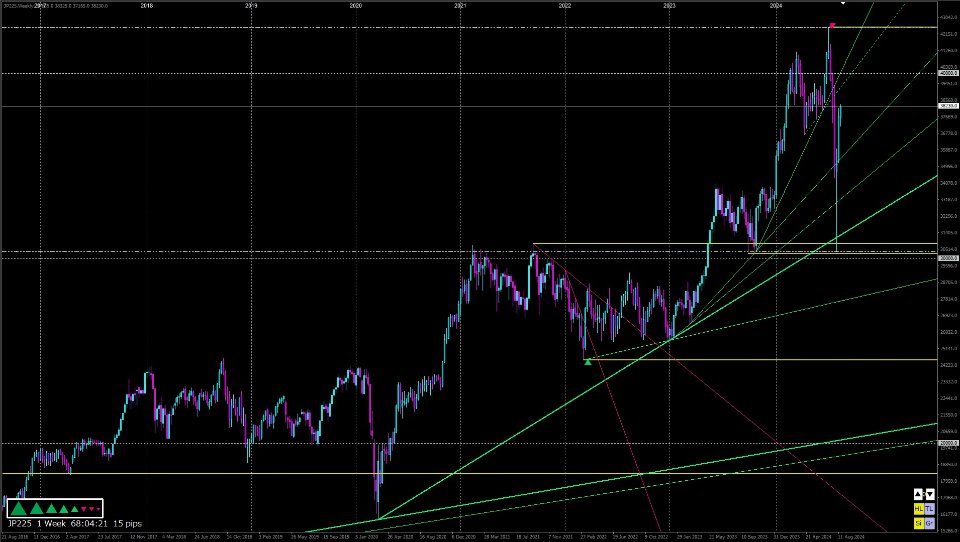
TrendLinePro2
- Indicadores
- Koichiro Kato
- Versão: 3.48
- Ativações: 5
【 TrendLinePro2 】
MT4 (MetaTrader 4) line trading aid indicator.
It is a very basic specification that is recommended for everyone, assuming that it is faithful to the Dow Theory.
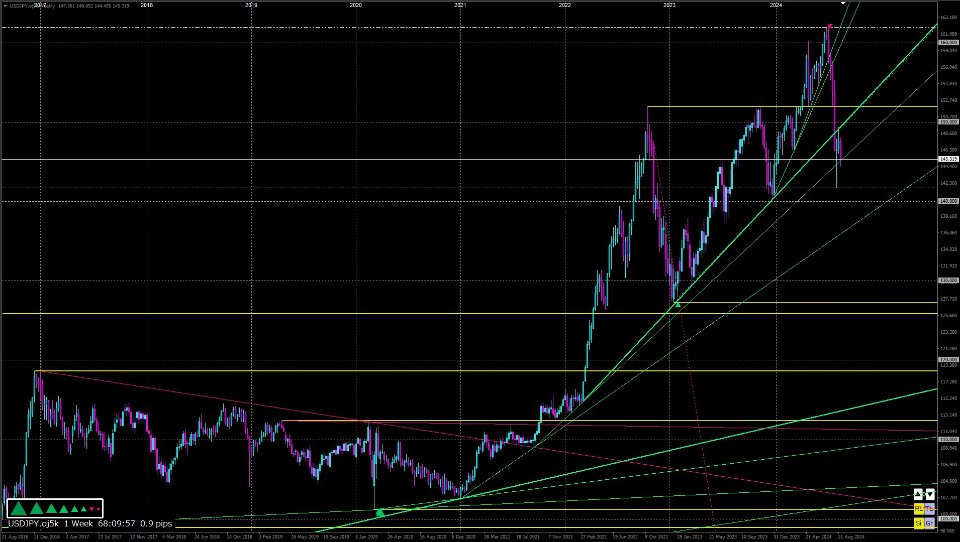
It recognises trends based on the Dow Theory and furthermore automatically draws support, resistance and trend lines in real time.
The accuracy is very high.
【 ZigZag 】
Based on the original zigzag created from the chart shape and in line with Dow Theory.
The trend that can be read from the zigzag is bundled up to eight levels in line with Dow Theory.
【 Sign 】
Shows the trend direction along the 8-step zigzag based on Dow Theory.
▲ Green (uptrend) ▼ Red (downtrend) ■ White (trendless)
▲Yellow (five or more trends from the minimum indicate an uptrend) ▼Yellow (five or more trends from the minimum indicate a downtrend)
【 Lines 】
Trendlines, supportlines and resistancelines (Horizon) are drawn along an eight-step zigzag based on Dow Theory.
The various lines are automatically drawn and deleted at the appropriate time.
If you want to draw channel lines manually, double-click the line and move it while holding down the Ctrl key.
【 Grid 】
The vertical (price) and horizontal (time) axes are designed to be delimited at the right place.
The number of separators can be set to a maximum value, and the number will automatically change accordingly.
【 Parameter 】
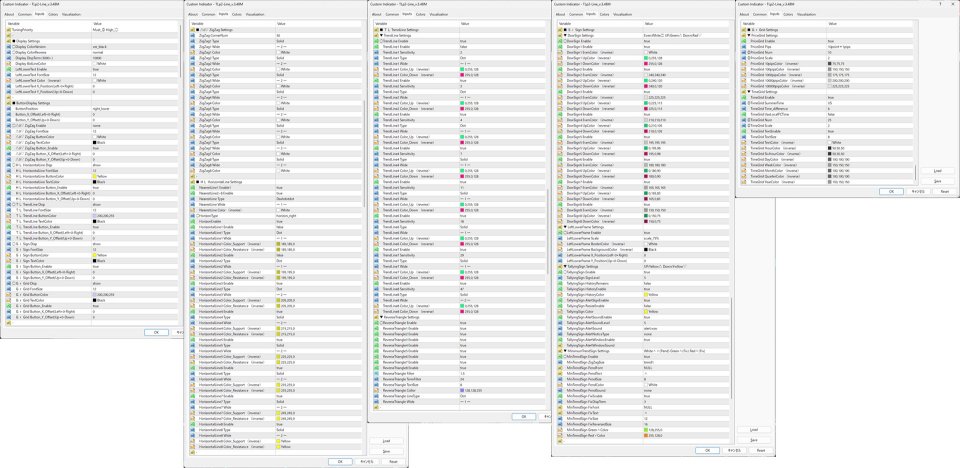
The parameters are explained below.
ーーーーーーーーーー
On Youtube, a video is uploaded every weekend to confirm the behaviour.ーーーーー
TuningPriority → Mark on the left side of each parameter ◎: Change required ○: Change priority
-
■ Display Settings → Item for setting the overall display.
◯Display ColorVersion → Select black if the background is black, or white if it is white. The target parameter has (inverse) next to its name.
◯Display ColorReverse → Change this if you want to invert the green for raising and the red for lowering. The target parameter has (reverse) next to its name.
Display DispTerm (5000~) → Specify the calculation range. We recommend 5000 or higher.
Display BidLineColor → Specify the color of the bid line.
LeftLowerText Enable → Show/hide the text at the bottom left of the chart
LeftLowerText FontSize → Font size of the text at the bottom left of the chart
LeftLowerText Color (inverse) → Show the text at the bottom left of the chart
LeftLowerText X_Position(Left-0+Right) → Move the text at the bottom left of the chart along the horizontal axis
LeftLowerText Y_Position(Up+0-Down) → Move the text at the bottom left of the chart along the vertical axis
-
■ ButtonDisplay Settings → Settings for the bottom right button of the chart
ButtonPosition → You can move the bottom right button of the chart to the top right
Button_X_Offset(Left+0-Right) → Move the bottom right button of the chart on the horizontal axis
Button_Y_Offset(Up+0-Down) → Move the bottom right button of the chart on the vertical axis
◯△0▽ ZigZag Enable → Display (1~8)/Hide (0) the zigzag
△0▽ ZigZag FontSize → Bottom right of the chart △0▽ Button text size
△0▽ ZigZag ButtonColor → Bottom right of the chart △0▽ Button color
△0▽ ZigZag TextColor → Bottom right of the chart △0▽ Button text color
△0▽ ZigZag Button_Enable → Bottom right of the chart △0▽ Display/hide the button
△0▽ ZigZag Button_X_Offset(Left+0-Right) → Bottom right of the chart △0▽ Move the button on the horizontal axis
△0▽ ZigZag Button_Y_Offset(Up+0-Down) → Bottom right of the chart △0▽ Move the button on the vertical axis
◯HL HorizontalLine Disp → Show/hide the horizontal line (Horizon)
HL HorizontalLine FontSize → Font size of the HL button on the bottom right of the chart
HL HorizontalLine ButtonColor → Color of the HL button on the bottom right of the chart
HL HorizontalLine TextColor → Font color of the HL button on the bottom right of the chart
HL HorizontalLine Button_Enable → Show/hide the HL button on the bottom right of the chart
HL HorizontalLine Button_X_Offset(Left+0-Right) → Move the HL button on the horizontal axis on the bottom right of the chart
HL HorizontalLine Button_Y_Offset(Up+0-Down) → Move the HL button on the vertical axis on the bottom right of the chart
◯TL TrendLine Disp → Show/hide the trend line
TL TrendLine FontSize → Font size of the TL button at the bottom right of the chart
TL TrendLine ButtonColor → Color of the TL button at the bottom right of the chart
TL TrendLine TextColor → Font color of the TL button at the bottom right of the chart
TL TrendLine Button_Enable → Display/hide the TL button at the bottom right of the chart
TL TrendLine Button_X_Offset(Left+0-Right) → Move the TL button at the bottom right of the chart along the horizontal axis
TL TrendLine Button_Y_Offset(Up+0-Down) → Move the TL button at the bottom right of the chart along the vertical axis
◯Si Sign Disp → Display/hide the sign
Si Sign FontSize → Font color of the SI button at the bottom right of the chart
Si Sign ButtonColor → Color of the SI button at the bottom right of the chart
Si Sign TextColor → Font color of the SI button at the bottom right of the chart
Si Sign Button_Enable → Display/hide the SI button at the bottom right of the chart
Si Sign Button_X_Offset(Left+0-Right) → Move the Si button at the bottom right of the chart along the horizontal axis
Si Sign Button_Y_Offset(Up+0-Down) → Move the Si button at the bottom right of the chart along the vertical axis
◯Gr Grid Disp → Show/hide the grid
Gr Grid FontSize → Font size of the Gr button at the bottom right of the chart
Gr Grid ButtonColor → Color of the Gr button at the bottom right of the chart
Gr Grid TextColor → Font color of the Gr button at the bottom right of the chart
Gr Grid Button_Enable → Show/hide the Gr button at the bottom right of the chart
Gr Grid Button_X_Offset(Left+0-Right) → Move the Gr button at the bottom right of the chart along the horizontal axis
Gr Grid Button_Y_Offset(Up+0-Down) → Move the Gr button at the bottom right of the chart along the vertical axis
-
■ △0▽ ZigZag Settings → △0▽ ZigZag Settings
ZigZag CornerNum → ZigZag display range (number of corners)
ZigZag1 Type → ZigZag1 line type
ZigZag1 Wide → ZigZag1 line thickness
ZigZag1 Color → ZigZag1 line color
ZigZag2 Type → ZigZag2…
※ The rest is the same as 1.
-
■ HL HorizontalLine Settings → HL horizontal line (Horizon) settings
NearestLine1 Enable1 → Display/hide undetermined most recent high/low line 1
NearestLine2~8 Enable → Display/hide undetermined most recent high/low line 2~8
NearestLine Type → Type of undetermined most recent high/low line
NearestLine Color (inverse) → Color of undetermined most recent high/low line
HorizonEnable → Display/hide horizontal line
HorizontalLine1 Type → Type of horizontal line 1
HorizontalLine1 Color_Support (inverse) → Color of support line of horizontal line 1
HorizontalLine1 Color_Resistance (inverse) → Color of resistance line of horizontal line 1
HorizontalLine2 Enable → Display/hide horizontal line 2…
※ The rest is the same as 1.
-
■ TL TrendLine Settings → TL Trendline Settings
▼ TrendLine Settings → Trendline Settings
◯TrendLine Enable → Show/hide trendline
TrendLine1 Enable → Show/hide trendline 1
TrendLine1 Sensitivity → Trendline 1 drawing sensitivity (thin out lines below the specified number)
TrendLine1 Type → Line type of trendline 1
TrendLine1 Wide → Line width of trendline 1
TrendLine1 Color_Up (reverse) → Color of trendline 1 rising
TrendLine1 Color_Down (reverse) → Color of trendline 1 falling
TrendLine2 Enable → Show/hide trendline 2…
※ The rest is the same as 1.
▼ ReverseTriangle Settings → Inverse triangle (broadening formation) settings
◯ReverseTriangle Enable → Show/hide inverse triangle
ReverseTriangle1 Enable → Show/hide inverse triangle 1
ReverseTriangle2 Enable → Show/hide inverse triangle 2
ReverseTriangle3 Enable → Show/hide inverse triangle 3
ReverseTriangle4 Enable → Show/hide inverse triangle 4
ReverseTriangle5 Enable → Show/hide inverse triangle 5
ReverseTriangle6 Enable → Show/hide inverse triangle 6
ReverseTriangle7 Enable → Show/hide inverse triangle 7
ReverseTriangle8 Enable → Show/hide inverse triangle 8
ReverseTriangle Filter → Angle magnification/upper limit of inverse triangle
ReverseTriangle TermFilter → Number of inverse triangles drawn/lower limit
ReverseTriangle TextSize → Font size of inverse triangle
ReverseTriangle Color → Line color of the inverted triangle
ReverseTriangle LineType → Line type of the inverted triangle
ReverseTriangle Wide → Line width of the inverted triangle
-
■ SI Sign Settings → SI Sign Settings
▼ DowSign Settings → Dow Theory Sign White□Green△Red▽ Settings
◯DowSign Enable → Show/Hide Dow Theory Sign
DowSign1 Enable → Show/Hide Dow Theory Sign 1
DowSign1 EvenColor (inverse) → Dow Theory White□ Sign 1 Color
DowSign1 UpColor (reverse) → Dow Theory Green△ Sign 1 Color
DowSign1 DownColor (reverse) → Dow Theory Red▽ Sign 1 Color
DowSign2 Enable → Dow Theory White□ Sign 2…
※ The rest is the same as 1.▼ LeftLowerFrame Settings → Setting the white border at the bottom left of the chart
◯LeftLowerFrame Enable → Show/hide the white border at the bottom left of the chart
LeftLowerFrame Scale → Display magnification of the white border at the bottom left of the chart
LeftLowerFrame BorderColor (inverse) → Border color of the white border at the bottom left of the chart
LeftLowerFrame BackgroundColor (inverse) → Background color of the white border at the bottom left of the chart
LeftLowerFrame X_Position(Left-0+Right) → Movement of the white border at the bottom left of the chart along the horizontal axis
LeftLowerFrame Y_Position(Up+0-Down) → Movement of the white border at the bottom left of the chart along the vertical axis
▼ TallyingSign Settings → Setting Yellow△Yellow▽
Yellow△Yellow▽ that responds when the orientations of 1 to 8 white□green△red▽ are aligned
When TallyingSign SignLevel = “5” (default value)
▽▽▽▲▲▲▲▲ Number of trends = 5 A state where trend directions up to number 5 are aligned with ▲
▽▽▲▲▲▲▲▲ Trend count = 6 A state where trend directions up to number 6 are aligned with ▲
▽▲▲▲▲▲▲▲ Trend count = 7 A state where trend directions up to number 7 are aligned with ▲
▲▲▲▲▲▲▲▲ Trend count = 8 A state where all 8 trend directions are aligned with ▲
⑧⑦⑥⑤④③②① Represents the larger standard ⑧ to the smaller standard ①.
▼▼▼▼▼▼▼▼ Number of trends = 8 All 8 trend directions are aligned with ▼
△▼▼▼▼▼▼▼ Number of trends = 7 Trend directions up to 7 are aligned with ▼
△△▼▼▼▼▼▼ Number of trends = 6 Trend directions up to 6 are aligned with ▼
△△△▼▼▼▼▼ Number of trends = 5 Trend directions up to 5 are aligned with ▼
◯TallyingSign Enable → Show/hide yellow△yellow▽
TallyingSign SignLevel → Number of yellow△yellow▽ trends
TallyingSign HistoryRemains → Keep/do not keep past history after yellow△yellow▽ reversal
TallyingSign HistoryEnable → Show/hide small yellow△yellow▽ (displayed each time the orientation of white□green△red▽ is aligned)
TallyingSign HistoryColor → Color of small yellow△yellow▽
TallyingSign AlertSignEnable → Show/hide large yellow△yellow▽
TallyingSign ResizeEnable → Displays additional trends when the number of large yellow △ yellow ▽ trends increases
TallyingSign Color → Color of large yellow △ yellow ▽
TallyingSign AlertSoundEnable → Enable or disable large yellow △ yellow ▽ alerts
TallyingSign AlertSoundLevel → Number of trends that trigger a large yellow △ yellow ▽ alert
TallyingSign AlertSound → Alert sound for large yellow △ yellow ▽
TallyingSign AlertNoticeType → Alert type for large yellow △ yellow ▽
TallyingSign AlertWindowEnable → Alert window for large yellow △ yellow ▽
TallyingSign AlertWindowSound → Cannot be set. MT4 sound settings take priority when the alert window is displayed.
▼ MinimumTrendSign Settings → Settings for updating the most recent high and low values White ∧∨ Green ∧ Red ∨
White ∧∨: Displayed when the most recent high and low values of the specified small trend are updated (unconfirmed)
Green ∧ Red ∨: Displayed when the most recent high and low values of the specified small trend are updated (confirmed)
◯MinTrendSign Enable → Display/hide White ∧∨ Green ∧ Red ∨
MinTrendSign ZigZagSize → Trend size of White ∧∨ Green ∧ Red ∨
MinTrendSign PendFont → Font of White ∧∨
MinTrendSign PendText → Display symbol of White ∧∨
MinTrendSign PendSize → Size of White ∧∨
MinTrendSign PendColor → Color of White ∧∨
MinTrendSign PendSound → White ∧∨ alert
MinTrendSign FixEnable → Show/hide Green ∧ Red ∨
MinTrendSign FixDispTerm → Number of Green ∧ Red ∨ displayed
MinTrendSign FixFont → Font for Green ∧ Red ∨
MinTrendSign FixText → Display symbol for Green ∧ Red ∨
MinTrendSign FixSize → Size of Green ∧ Red ∨
MinTrendSign FixReversedSize → Size of Green ∧ Red ∨ when reversed
MinTrendSign Green∧Color → Color of Green ∧
MinTrendSign Red∨Color → Color of Red ∨
-
■ Gr Grid Settings → Gr Grid Settings
▼ PriceGrid Settings → Vertical axis (price) grid settings
PriceGrid Enable → Show/hide vertical axis
PriceGrid Pips → Vertical axis magnification Corresponds to different magnifications depending on MT4
◎PriceGrid Num → Maximum number of grids on vertical axis when chart is reduced
◎PriceGrid Scale → Number of charts lined up vertically when chart is reduced (affects maximum number of grids when chart is expanded)
PriceGrid 10pipsColor (inverse) → Color of grid every 10 pips
PriceGrid 100pipsColor (inverse) → Color of grid every 100 pips
PriceGrid 1000pipsColor (inverse) → Color of grid every 1000 pips
PriceGrid 10000pipsColor (inverse) → Color of grid every 10000 pips
PriceGrid 10000pipsColor (inverse) → Color of grid every 10000 pips
PriceGrid 100000pipsColor (inverse) → Color of grid every 100000 pips
▼ TimeGrid Settings → Horizontal axis (time) grid settings
TimeGrid Enable → Show/hide horizontal axis
◎TimeGrid SummerTime → Horizontal axis server time standard (US format for all but XM)
TimeGrid Time_difference → Adjust horizontal axis time difference
TimeGrid UseLocalPCTime → Use PC time
◎TimeGrid Num → Upper limit of horizontal axis grids when the chart is reduced
◎TimeGrid Scale → Number of charts lined up vertically when the chart is reduced (Affects the number of grids when the chart is maximized.)
TimeGrid TextEnable → Show/hide date and time text on the horizontal axis
TimeGrid TextSize → Date and time text size on the horizontal axis
TimeGrid TextColor (inverse) → Date and time text color on the horizontal axis
TimeGrid HourColor (inverse) → Color of grids for every hour
TimeGrid SixHourColor (inverse) → Color of grids for every six hours
TimeGrid DayColor (inverse) → Color of grids for every day
TimeGrid WeekColor (inverse) → Weekly grid color
TimeGrid MonthColor (inverse) → Monthly grid color
TimeGrid QuarterColor (inverse) → Quarterly grid color
TimeGrid YearColor (inverse) → Yearly grid color
ーーーーーーーーーーーーーーー

