• Panoramica
  • Recensioni
  • Commenti

TrendLinePro2


【 TrendLinePro2 】

   MT4 (MetaTrader 4) line trading aid indicator.

   It is a very basic specification that is recommended for everyone, assuming that it is faithful to the Dow Theory.

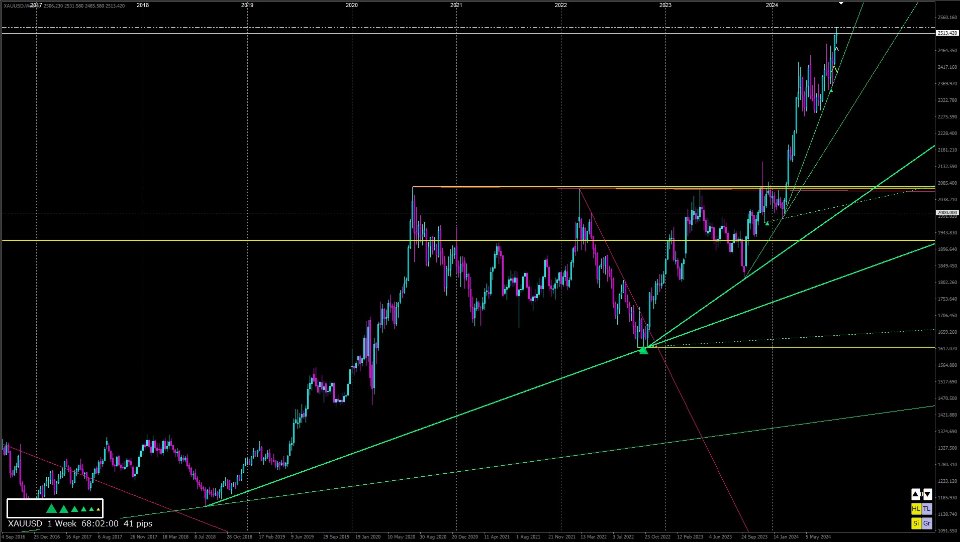
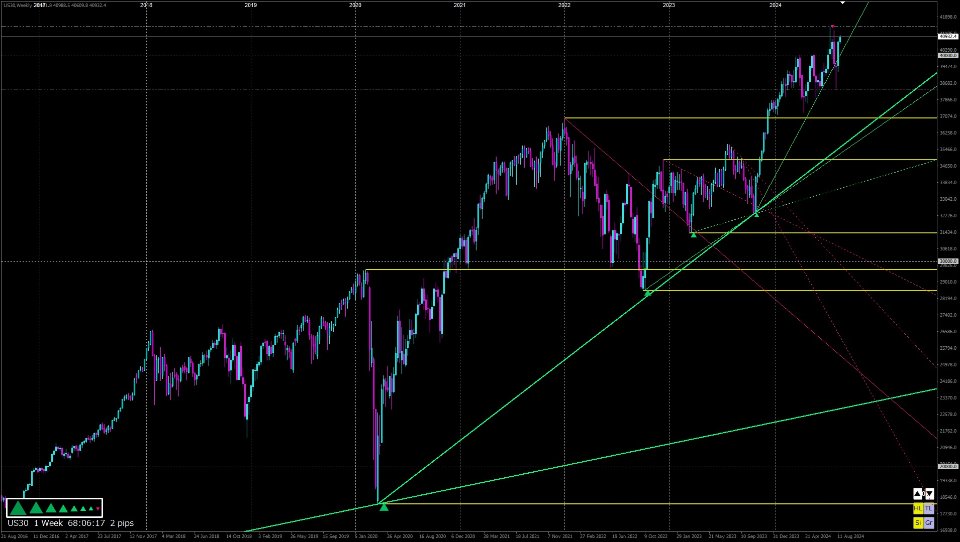
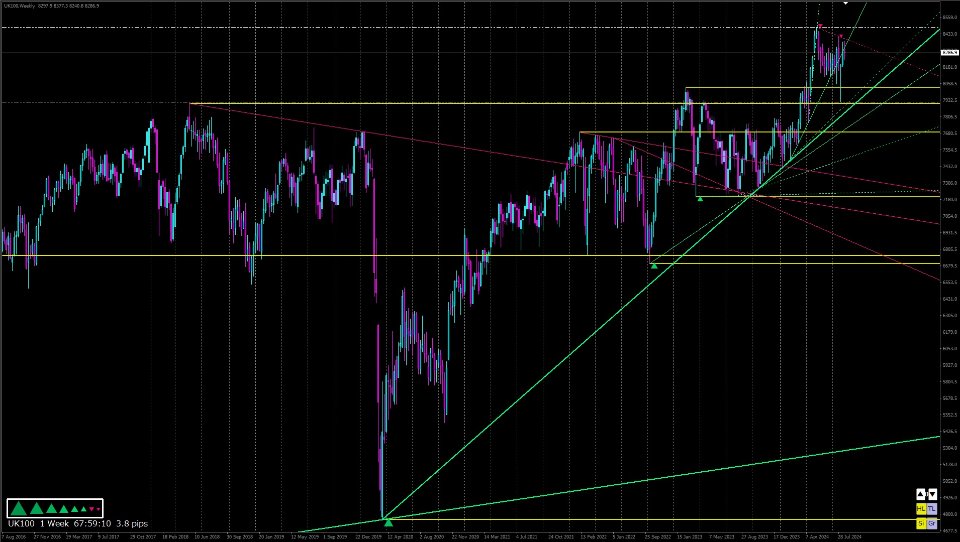
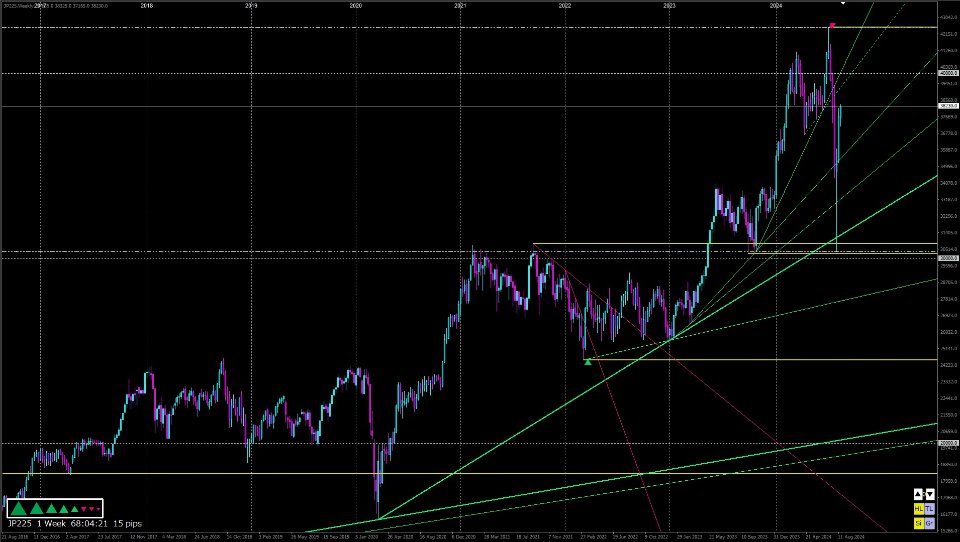
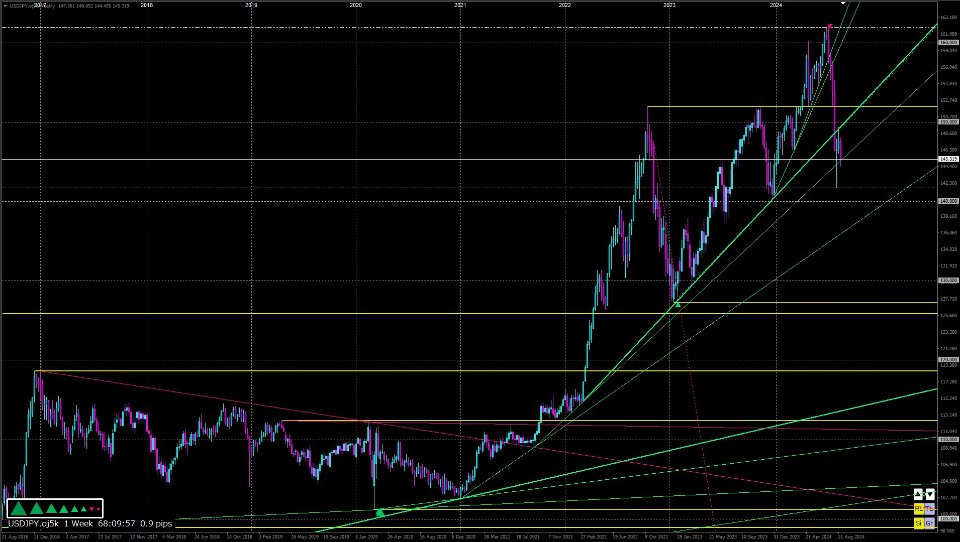
   It recognises trends based on the Dow Theory and furthermore automatically draws support, resistance and trend lines in real time.

   The accuracy is very high.


【 ZigZag 】

   Based on the original zigzag created from the chart shape and in line with Dow Theory.

   The trend that can be read from the zigzag is bundled up to eight levels in line with Dow Theory.


【 Sign 】

   Shows the trend direction along the 8-step zigzag based on Dow Theory.

   ▲ Green (uptrend) ▼ Red (downtrend) ■ White (trendless)

   ▲Yellow (five or more trends from the minimum indicate an uptrend) ▼Yellow (five or more trends from the minimum indicate a downtrend)


【 Lines 】

   Trendlines, supportlines and resistancelines (Horizon) are drawn along an eight-step zigzag based on Dow Theory.

   The various lines are automatically drawn and deleted at the appropriate time.

   If you want to draw channel lines manually, double-click the line and move it while holding down the Ctrl key.


【 Grid 】

   The vertical (price) and horizontal (time) axes are designed to be delimited at the right place.

   The number of separators can be set to a maximum value, and the number will automatically change accordingly.


【 Parameter 】

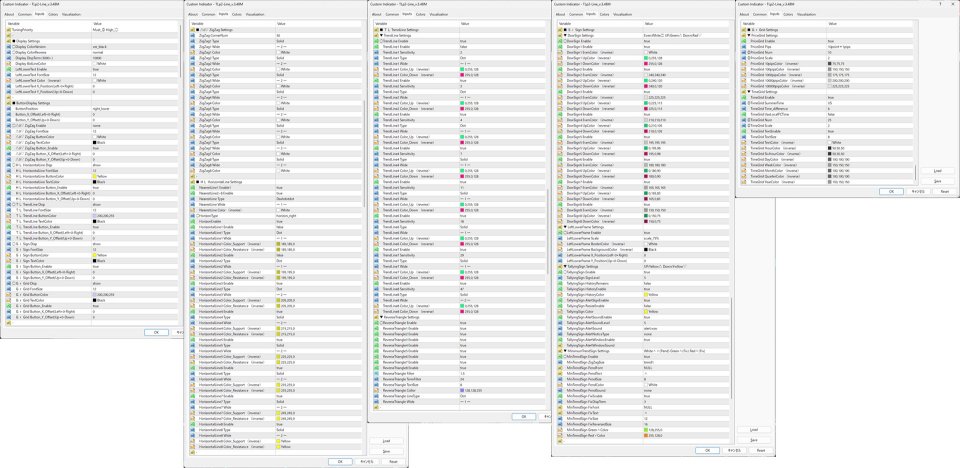
   The parameters are explained below.

ーーーーーーーーーー

   On Youtube, a video is uploaded every weekend to confirm the behaviour.ーーーーー

   TuningPriority → Mark on the left side of each parameter ◎: Change required ○: Change priority

-

■ Display Settings → Item for setting the overall display.


◯Display ColorVersion → Select black if the background is black, or white if it is white. The target parameter has (inverse) next to its name.

◯Display ColorReverse → Change this if you want to invert the green for raising and the red for lowering. The target parameter has (reverse) next to its name.

   Display DispTerm (5000~) → Specify the calculation range. We recommend 5000 or higher.

   Display BidLineColor → Specify the color of the bid line.

   LeftLowerText Enable → Show/hide the text at the bottom left of the chart

   LeftLowerText FontSize → Font size of the text at the bottom left of the chart

   LeftLowerText Color (inverse) → Show the text at the bottom left of the chart

   LeftLowerText X_Position(Left-0+Right) → Move the text at the bottom left of the chart along the horizontal axis

   LeftLowerText Y_Position(Up+0-Down) → Move the text at the bottom left of the chart along the vertical axis

-

■ ButtonDisplay Settings → Settings for the bottom right button of the chart


    ButtonPosition → You can move the bottom right button of the chart to the top right

    Button_X_Offset(Left+0-Right) → Move the bottom right button of the chart on the horizontal axis

    Button_Y_Offset(Up+0-Down) → Move the bottom right button of the chart on the vertical axis

◯△0▽ ZigZag Enable → Display (1~8)/Hide (0) the zigzag

   △0▽ ZigZag FontSize → Bottom right of the chart △0▽ Button text size

   △0▽ ZigZag ButtonColor → Bottom right of the chart △0▽ Button color

   △0▽ ZigZag TextColor → Bottom right of the chart △0▽ Button text color

   △0▽ ZigZag Button_Enable → Bottom right of the chart △0▽ Display/hide the button

   △0▽ ZigZag Button_X_Offset(Left+0-Right) → Bottom right of the chart △0▽ Move the button on the horizontal axis

   △0▽ ZigZag Button_Y_Offset(Up+0-Down) → Bottom right of the chart △0▽ Move the button on the vertical axis

   ◯HL HorizontalLine Disp → Show/hide the horizontal line (Horizon) 

   HL HorizontalLine FontSize → Font size of the HL button on the bottom right of the chart

   HL HorizontalLine ButtonColor → Color of the HL button on the bottom right of the chart

   HL HorizontalLine TextColor → Font color of the HL button on the bottom right of the chart

   HL HorizontalLine Button_Enable → Show/hide the HL button on the bottom right of the chart

   HL HorizontalLine Button_X_Offset(Left+0-Right) → Move the HL button on the horizontal axis on the bottom right of the chart

   HL HorizontalLine Button_Y_Offset(Up+0-Down) → Move the HL button on the vertical axis on the bottom right of the chart

◯TL TrendLine Disp → Show/hide the trend line

   TL TrendLine FontSize → Font size of the TL button at the bottom right of the chart

   TL TrendLine ButtonColor → Color of the TL button at the bottom right of the chart

   TL TrendLine TextColor → Font color of the TL button at the bottom right of the chart

   TL TrendLine Button_Enable → Display/hide the TL button at the bottom right of the chart

   TL TrendLine Button_X_Offset(Left+0-Right) → Move the TL button at the bottom right of the chart along the horizontal axis

   TL TrendLine Button_Y_Offset(Up+0-Down) → Move the TL button at the bottom right of the chart along the vertical axis

◯Si Sign Disp → Display/hide the sign

   Si Sign FontSize → Font color of the SI button at the bottom right of the chart

   Si Sign ButtonColor → Color of the SI button at the bottom right of the chart

   Si Sign TextColor → Font color of the SI button at the bottom right of the chart

   Si Sign Button_Enable → Display/hide the SI button at the bottom right of the chart

   Si Sign Button_X_Offset(Left+0-Right) → Move the Si button at the bottom right of the chart along the horizontal axis

   Si Sign Button_Y_Offset(Up+0-Down) → Move the Si button at the bottom right of the chart along the vertical axis

◯Gr Grid Disp → Show/hide the grid

   Gr Grid FontSize → Font size of the Gr button at the bottom right of the chart

   Gr Grid ButtonColor → Color of the Gr button at the bottom right of the chart

   Gr Grid TextColor → Font color of the Gr button at the bottom right of the chart

   Gr Grid Button_Enable → Show/hide the Gr button at the bottom right of the chart

   Gr Grid Button_X_Offset(Left+0-Right) → Move the Gr button at the bottom right of the chart along the horizontal axis

   Gr Grid Button_Y_Offset(Up+0-Down) → Move the Gr button at the bottom right of the chart along the vertical axis

-

■ △0▽ ZigZag Settings → △0▽ ZigZag Settings

   ZigZag CornerNum → ZigZag display range (number of corners)

   ZigZag1 Type → ZigZag1 line type

   ZigZag1 Wide → ZigZag1 line thickness

   ZigZag1 Color → ZigZag1 line color

   ZigZag2 Type → ZigZag2…

   ※ The rest is the same as 1.

-

■ HL HorizontalLine Settings → HL horizontal line (Horizon) settings

   NearestLine1 Enable1 → Display/hide undetermined most recent high/low line 1

   NearestLine2~8 Enable → Display/hide undetermined most recent high/low line 2~8

   NearestLine Type → Type of undetermined most recent high/low line

   NearestLine Wide → Width of undetermined most recent high/low line

   NearestLine Color (inverse) → Color of undetermined most recent high/low line

◯HorizonType → Select the type of horizontal line (normal, with rate, right side only)

   HorizonEnable → Display/hide horizontal line

   HorizontalLine1 Enable → Display/hide horizontal line 1

   HorizontalLine1 Type → Type of horizontal line 1

   HorizontalLine1 Wide → Width of horizontal line 1

   HorizontalLine1 Color_Support (inverse) → Color of support line of horizontal line 1

   HorizontalLine1 Color_Resistance (inverse) → Color of resistance line of horizontal line 1 

   HorizontalLine2 Enable → Display/hide horizontal line 2…

   ※ The rest is the same as 1.

-

■ TL TrendLine Settings → TL Trendline Settings


▼ TrendLine Settings → Trendline Settings


◯TrendLine Enable → Show/hide trendline

   TrendLine1 Enable → Show/hide trendline 1

   TrendLine1 Sensitivity → Trendline 1 drawing sensitivity (thin out lines below the specified number)

   TrendLine1 Type → Line type of trendline 1

   TrendLine1 Wide → Line width of trendline 1

   TrendLine1 Color_Up (reverse) → Color of trendline 1 rising

   TrendLine1 Color_Down (reverse) → Color of trendline 1 falling

   TrendLine2 Enable → Show/hide trendline 2

   ※ The rest is the same as 1.


▼ ReverseTriangle Settings → Inverse triangle (broadening formation) settings


◯ReverseTriangle Enable → Show/hide inverse triangle

   ReverseTriangle1 Enable → Show/hide inverse triangle 1

   ReverseTriangle2 Enable → Show/hide inverse triangle 2

   ReverseTriangle3 Enable → Show/hide inverse triangle 3

   ReverseTriangle4 Enable → Show/hide inverse triangle 4

   ReverseTriangle5 Enable → Show/hide inverse triangle 5

   ReverseTriangle6 Enable → Show/hide inverse triangle 6

   ReverseTriangle7 Enable → Show/hide inverse triangle 7

   ReverseTriangle8 Enable → Show/hide inverse triangle 8

   ReverseTriangle Filter → Angle magnification/upper limit of inverse triangle

   ReverseTriangle TermFilter → Number of inverse triangles drawn/lower limit

   ReverseTriangle TextSize → Font size of inverse triangle

   ReverseTriangle Color → Line color of the inverted triangle

   ReverseTriangle LineType → Line type of the inverted triangle

   ReverseTriangle Wide → Line width of the inverted triangle

-

■ SI Sign Settings → SI Sign Settings


▼ DowSign Settings → Dow Theory Sign White□Green△Red▽ Settings


◯DowSign Enable → Show/Hide Dow Theory Sign

   DowSign1 Enable → Show/Hide Dow Theory Sign 1

   DowSign1 EvenColor (inverse) → Dow Theory White□ Sign 1 Color

   DowSign1 UpColor (reverse) → Dow Theory Green△ Sign 1 Color

   DowSign1 DownColor (reverse) → Dow Theory Red▽ Sign 1 Color

   DowSign2 Enable → Dow Theory White□ Sign 2…

   ※ The rest is the same as 1.


▼ LeftLowerFrame Settings → Setting the white border at the bottom left of the chart


◯LeftLowerFrame Enable → Show/hide the white border at the bottom left of the chart

   LeftLowerFrame Scale → Display magnification of the white border at the bottom left of the chart

   LeftLowerFrame BorderColor (inverse) → Border color of the white border at the bottom left of the chart

   LeftLowerFrame BackgroundColor (inverse) → Background color of the white border at the bottom left of the chart

   LeftLowerFrame X_Position(Left-0+Right) → Movement of the white border at the bottom left of the chart along the horizontal axis

   LeftLowerFrame Y_Position(Up+0-Down) → Movement of the white border at the bottom left of the chart along the vertical axis


▼ TallyingSign Settings → Setting Yellow△Yellow▽


   Yellow△Yellow▽ that responds when the orientations of 1 to 8 white□green△red▽ are aligned

   When TallyingSign SignLevel = “5” (default value)


   ▽▽▽▲▲▲▲▲ Number of trends = 5 A state where trend directions up to number 5 are aligned with ▲

   ▽▽▲▲▲▲▲▲ Trend count = 6 A state where trend directions up to number 6 are aligned with ▲

   ▽▲▲▲▲▲▲▲ Trend count = 7 A state where trend directions up to number 7 are aligned with ▲

   ▲▲▲▲▲▲▲▲ Trend count = 8 A state where all 8 trend directions are aligned with ▲

   ⑧⑦⑥⑤④③②① Represents the larger standard ⑧ to the smaller standard ①.

   ▼▼▼▼▼▼▼▼ Number of trends = 8 All 8 trend directions are aligned with ▼

   △▼▼▼▼▼▼▼ Number of trends = 7 Trend directions up to 7 are aligned with ▼

   △△▼▼▼▼▼▼ Number of trends = 6 Trend directions up to 6 are aligned with ▼

   △△△▼▼▼▼▼ Number of trends = 5 Trend directions up to 5 are aligned with ▼


◯TallyingSign Enable → Show/hide yellow△yellow▽

   TallyingSign SignLevel → Number of yellow△yellow▽ trends

   TallyingSign HistoryRemains → Keep/do not keep past history after yellow△yellow▽ reversal

   TallyingSign HistoryEnable → Show/hide small yellow△yellow▽ (displayed each time the orientation of white□green△red▽ is aligned)

   TallyingSign HistoryColor → Color of small yellow△yellow▽

   TallyingSign AlertSignEnable → Show/hide large yellow△yellow▽

   TallyingSign ResizeEnable → Displays additional trends when the number of large yellow △ yellow ▽ trends increases

   TallyingSign Color → Color of large yellow △ yellow ▽

   TallyingSign AlertSoundEnable → Enable or disable large yellow △ yellow ▽ alerts

   TallyingSign AlertSoundLevel → Number of trends that trigger a large yellow △ yellow ▽ alert

   TallyingSign AlertSound → Alert sound for large yellow △ yellow ▽

   TallyingSign AlertNoticeType → Alert type for large yellow △ yellow ▽

   TallyingSign AlertWindowEnable → Alert window for large yellow △ yellow ▽

   TallyingSign AlertWindowSound → Cannot be set. MT4 sound settings take priority when the alert window is displayed.


▼ MinimumTrendSign Settings → Settings for updating the most recent high and low values ​​White ∧∨ Green ∧ Red ∨


   White ∧∨: Displayed when the most recent high and low values ​​of the specified small trend are updated (unconfirmed)

   Green ∧ Red ∨: Displayed when the most recent high and low values ​​of the specified small trend are updated (confirmed)

◯MinTrendSign Enable → Display/hide White ∧∨ Green ∧ Red ∨

   MinTrendSign ZigZagSize → Trend size of White ∧∨ Green ∧ Red ∨

   MinTrendSign PendFont → Font of White ∧∨

   MinTrendSign PendText → Display symbol of White ∧∨

   MinTrendSign PendSize → Size of White ∧∨

   MinTrendSign PendColor → Color of White ∧∨

   MinTrendSign PendSound → White ∧∨ alert

   MinTrendSign FixEnable → Show/hide Green ∧ Red ∨

   MinTrendSign FixDispTerm → Number of Green ∧ Red ∨ displayed

   MinTrendSign FixFont → Font for Green ∧ Red ∨

   MinTrendSign FixText → Display symbol for Green ∧ Red ∨

   MinTrendSign FixSize → Size of Green ∧ Red ∨

   MinTrendSign FixReversedSize → Size of Green ∧ Red ∨ when reversed

   MinTrendSign Green∧Color → Color of Green ∧

   MinTrendSign Red∨Color → Color of Red ∨

-

■ Gr Grid Settings → Gr Grid Settings


▼ PriceGrid Settings → Vertical axis (price) grid settings


   PriceGrid Enable → Show/hide vertical axis

   PriceGrid Pips → Vertical axis magnification Corresponds to different magnifications depending on MT4

◎PriceGrid Num → Maximum number of grids on vertical axis when chart is reduced

◎PriceGrid Scale → Number of charts lined up vertically when chart is reduced (affects maximum number of grids when chart is expanded)

   PriceGrid 10pipsColor (inverse) → Color of grid every 10 pips

   PriceGrid 100pipsColor (inverse) → Color of grid every 100 pips

   PriceGrid 1000pipsColor (inverse) → Color of grid every 1000 pips

   PriceGrid 10000pipsColor (inverse) → Color of grid every 10000 pips

   PriceGrid 10000pipsColor (inverse) → Color of grid every 10000 pips

   PriceGrid 100000pipsColor (inverse) → Color of grid every 100000 pips


▼ TimeGrid Settings → Horizontal axis (time) grid settings


   TimeGrid Enable → Show/hide horizontal axis

◎TimeGrid SummerTime → Horizontal axis server time standard (US format for all but XM)

   TimeGrid Time_difference → Adjust horizontal axis time difference

   TimeGrid UseLocalPCTime → Use PC time

◎TimeGrid Num → Upper limit of horizontal axis grids when the chart is reduced

◎TimeGrid Scale → Number of charts lined up vertically when the chart is reduced (Affects the number of grids when the chart is maximized.)

   TimeGrid TextEnable → Show/hide date and time text on the horizontal axis

   TimeGrid TextSize → Date and time text size on the horizontal axis

   TimeGrid TextColor (inverse) → Date and time text color on the horizontal axis

   TimeGrid HourColor (inverse) → Color of grids for every hour

   TimeGrid SixHourColor (inverse) → Color of grids for every six hours

   TimeGrid DayColor (inverse) → Color of grids for every day

   TimeGrid WeekColor (inverse) → Weekly grid color

   TimeGrid MonthColor (inverse) → Monthly grid color

   TimeGrid QuarterColor (inverse) → Quarterly grid color

   TimeGrid YearColor (inverse) → Yearly grid color

ーーーーーーーーーーーーーーー

Prodotti consigliati
PABT Pattern Indicator - it's classical system one of the signal patterns. Indicator logic - the Hi & Lo of the bar is fully within the range of the preceding bar, look to trade them as pullback in trend. In the way if indicator found PABT pattern it's drawing two lines and arrow what showing trend way.  - First line - it's entry point and drawing at: 1. On the high of signal bar or on middle of the signal bar (depending from indicator mode) for buy; 2. On the low of signal bar or on middle of t
Black series MT4
Dmitriy Kashevich
1 (1)
Black series MT4 - The indicator is designed for trading on binary options with Timeframe M1-M5-M15 Multicurrency (Works on cryptocurrency and currency pairs) The signal appears when the candle opens Up to 90% correct signals There is no signal redrawing at all Can be used with other indicators. Good for scalping! In Settings there is: -Indicator working methods -I Allert Arrow color Red signal down Blue signal up Also watch the video how the indicator works and signals appear or te
UniversalIndicator is a universal indicator. A great helper for beginners and professional traders. The indicator algorithm uses probabilistic and statistical methods for analyzing the price of a trading instrument. The indicator is set in the usual way. Advantages of the indicator works on any time period works with any trading tool has a high probability of a positive forecast does not redraw Indicator Parameters LengthForecast = 30 - the number of predicted bars
Owl smart levels
Sergey Ermolov
4.34 (35)
Versione MT5  |  FAQ L' indicatore Owl Smart Levels   è un sistema di trading completo all'interno dell'unico indicatore che include strumenti di analisi di mercato popolari come i   frattali avanzati di Bill Williams , Valable ZigZag che costruisce   la corretta struttura a onde   del mercato, e i   livelli di Fibonacci che segnano i livelli esatti di entrata nel mercato e luoghi per prendere profitti. Descrizione dettagliata della strategia Istruzioni per lavorare con l'indicatore Consulente-
El indicador "MR BEAST ALERTAS DE LIQUIDEZ" es una herramienta avanzada diseñada para proporcionar señales y alertas sobre la liquidez del mercado basándose en una serie de indicadores técnicos y análisis de tendencias. Ideal para traders que buscan oportunidades de trading en función de la dinámica de precios y los niveles de volatilidad, este indicador ofrece una visualización clara y detallada en la ventana del gráfico de MetaTrader. Características Principales: Canal ATR Adaptativo: Calcula
VR Cub
Vladimir Pastushak
VR Cub è un indicatore per ottenere punti di ingresso di alta qualità. L'indicatore è stato sviluppato per facilitare i calcoli matematici e semplificare la ricerca dei punti di ingresso in una posizione. La strategia di trading per la quale è stato scritto l'indicatore ha dimostrato la sua efficacia per molti anni. La semplicità della strategia di trading è il suo grande vantaggio, che consente anche ai trader alle prime armi di commerciare con successo con essa. VR Cub calcola i punti di apert
Indicator without redrawing Divergent MAX The DivirgentMAX indicator is a modification based on the MACD. The tool detects divergence based on OsMA and sends signals to buy or sell (buy|sell), taking into account the type of discrepancies detected. Important!!!! In the DivirgentMAX indicator, the optimal entry points are drawn using arrows in the indicator's basement. Divergence is also displayed graphically. In this modification of the MACD, the lag problem characteristic of its predecessor i
The Wing Patterns indicator scans for many different kinds of Patterns using an XABCD structure. The term Wing Pattern is used to refer to all types of patterns based on a general XABCD structure, which is plotted in an alternate high-low extreme form. In other words, assume that point X is started at a low point on the chart. The point A is plotted at the next highest point within a certain number of bars. This certain number of bars is called the depth level. In this example, point B would be
Gioteen Volatility Index (GVI)   - your ultimate solution to overcoming market unpredictability and maximizing trading opportunities. This revolutionary indicator helps you in lowering your losing trades due to choppy market movements. The GVI is designed to measure market volatility, providing you with valuable insights to identify the most favorable trading prospects. Its intuitive interface consists of a dynamic red line representing the volatility index, accompanied by blue line that indicat
BPSPanel
Remi Passanello
BPS Panel Breakout Pro Scalper Solution Panel This indicator is part of the   RPTrade Pro Solutions  systems. BPS Panel   is a daily trend indicator using Price Action, Dynamic Support and Resistances. It's designed to be used by anyone, even the absolute beginner in trading can use it. NEVER repaints . Indications are given   from close to close . Designed to   be used alone , no other indicators are required. Gives you the trend and potential Take Profit at the beginning of the day. How doe
The Th3Eng PipFinite indicator is based on a very excellent analysis of the right trend direction with perfect custom algorithms. It show the true direction and the best point to start trading. With StopLoss point and Three Take Profit points. Also it show the right pivot of the price and small points to order to replace the dynamic support and resistance channel, Which surrounds the price. And Finally it draws a very helpful Box on the left side on the chart includes (take profits and Stop loss
Reback
Yazhou Liu
This index can be traced back to historical transactions, and can clearly see the trading location, trading type, profit and loss situation, as well as statistical information. Showlabel is used to display statistics. Summy_from is the start time of order statistics. This parameter is based on the opening time of the order. Backtracking can help us to correct the wrong trading habits, which is very important for beginners to learn manual transactions. This index is suitable for each time per
Line Magnit
Aleksey Trenin
The LineMagnit Indicator for MT4 is a highly precise tool that builds support and resistance levels which magnetically attract prices. This feature allows traders to easily determine the most probable entry and exit points in the market, as well as identify the market's directional forces, as levels are based on capital inflows into the instrument. Equipped with an intuitively understandable graphical interface, the LineMagnit Indicator enables users to quickly locate and analyze support and res
Fibonacci indicator based on fractal.This software can automatically draw the golden section proportional line of two trend lines, and mark all the recent high and low prices.And the percentage value of volatility is a multi-cycle, multi-currency oscillation indicator.It is very effective for traders to find support and resistance lines and find entry and exit points near them.
Chart Patterns Detect 15 patterns (Ascending Triangle, Descending Triangle, Rising Wedge, Falling Wedge, Bullish Flag, Bearish Flag, Bullish Rectangle, Bearish Rectangle Symmetrical triangle, Head and Shoulders, Inverted Head and Shoulders, Triple top, Triple Bottom, Double Top, Double Bottom) Use historical data to calculate the probability of each pattern to succeed (possibility to filter notification according to the chance of success) gives graphic indication about the invalidation level and
Alpha Trend sign has been a very popular trading tool in our company for a long time. It can verify our trading system and clearly indicate trading signals, and the signals will not drift. Main functions: Based on the market display of active areas, indicators can be used to intuitively determine whether the current market trend belongs to a trend market or a volatile market. And enter the market according to the indicator arrows, with green arrows indicating buy and red arrows indicating se
This indicator is another variant of the famous powerful indicator Fibonacci-SS https://www.mql5.com/en/market/product/10136 but has different behaviour in placing Pending Order and TP Line. Automatically places Fibonacci retracement lines from the last highest and lowest visible bars on the chart with: An auto Pending Order (Buy/Sell). Taking Profit 1, Taking Profit 2 is pivot point and Taking Profit 3 for extended reward opportunity. The best risk and reward ratio. Simple and powerful indicat
MACD Divergence
Sergey Deev
2.5 (2)
The indicator detects divergence signals - the divergences between the price peaks and the MACD oscillator values. The signals are displayed as arrows in the additional window and are maintained by the messages in a pop-up window, e-mails and push-notifications. The conditions which formed the signal are displayed by lines on the chart and in the indicator window. Indicator Parameters MacdFast - fast MACD line period MacdSlow - slow MACD line period MacdSignal - MACD signal line period MacdPric
Trendiness Index
Libertas LLC
5 (3)
"The trend is your friend" is one of the best known sayings in investing, because capturing large trendy price movements can be extremely profitable. However, trading with the trend is often easier said than done, because many indicators are based on price reversals not trends. These aren't very effective at identifying trendy periods, or predicting whether trends will continue. We developed the Trendiness Index to help address this problem by indicating the strength and direction of price trend
This is the FXTraderariel-TakeProfit - Stop Loss Indicator . It provides you 3 potential Take Profits and 1 Stop Loss. These potential targets are computed based on several methods . The indicator can be used on every time frame, but we advise to use it on H1, H4 and D1. Especially if you are a novice trader. Pro Traders can also you use it for scalping in smaller time frames (M1, M5 and M15). This indicator is not a complete trading system. It doesn't provide you a Signal nor can predict the m
This indicator displays the entry points for buying and selling, with additional push notifications. It is based on the classic Parabolic SAR indicator, price smoothing model and certain mathematical methods for a greater variability in finding market entry points. Advantages Fewer wrong entries compared to the use of classic breakout and trend confirmation indicators. Signals are not redrawn. A large number of customizable parameters. Visualization of the bullish and bearish trend. Used for id
Laser Trend
Nicolas Zouein
The trend is your friend! This is what this indicator is all about. Follow this famous saying and be safe. Characteristics: Buy/Sell signals fixed on the close of a bar. Works on all symbols and all timeframes. Clear visual market trend laser line, Buy/Sell signal arrows, market strength meter, TP1 & TP2 boxes. Visual signals when to enter, when to exit the market. No repainting. Compatible with Flexible EA for trading automation. (Ask for a free set file optimized to perform 2010-2018) Parame
Wave Wolf MT4
Andrei Salanevich
L'indicatore Forex Wave wold MT4 è progettato per cercare le onde di Woolf e visualizzarle nella finestra corrente del terminale di trading. Un ottimo indicatore per i trader che utilizzano le onde di Wolfe nel trading. La sua applicazione nelle strategie di trading aumenterà notevolmente la loro efficienza e redditività. INFORMAZIONI SULL'INDICATORE A differenza di altri indicatori onda Wold, indicatore Forex onda wold MT4 ha una serie di caratteristiche che aumentano notevolmente la sua effi
For sure, this indicator has become very popular amongst traders. Through coding this indicator will give you the most accurate levels possible for your trading analysis. We have also added in the ability for you to receive alerts when the price breaks above or below a Support or Resistance lines! HOW TO USE The red rectangles represent your resistance/supply zone. The green rectangles represent your support/demand zone.  BONUS FEATURES We coded this indicator with the ability to switch between
Insider Scalper Binary This tool is designed to trade binary options. for short temporary spends. to make a deal is worth the moment of receiving the signal and only 1 candle if it is m1 then only for a minute and so in accordance with the timeframe. for better results, you need to select well-volatile charts.... recommended currency pairs eur | usd, usd | jpy .... the indicator is already configured, you just have to add it to the chart and trade .... The indicator signals the next candle.
Trend Flasher Trend is your friend is the age old saying quote in trading arena, there are though many ways to gauge the trend and its direction, more scientific measure and logically meaningful will be an ATR break outs to identify and spot the trend and its acceleration, so we created this easy to use trend identification panel and optimized super trend based multi time frame panel entry system to aid and help the traders to make their trading decision. Unique Features of Trend Flasher 1. H
Infinity Trend Pro
Yaroslav Varankin
1 (1)
This is a trend indicator without redrawing Developed instead of the binary options strategy (by the color of the Martingale candlestick) Also works well in forex trading When to open trades (binary options) A signal will appear in the place with a candle signaling the current candle It is recommended to open a deal for one candle of the current timeframe M1 and M5 When a blue dot appears, open a deal up When a red dot appears, open a trade down. How to open trades on Forex. When a signal is rec
Fourteen plus nine TD Sequential
MOHAMMED IMAD HUSSEIN BASSEE
Fourteen plus nine What is it for? Applying Tom DeMark’s TD Sequential serves the purpose of identifying a price point where an uptrend or a downtrend exhausts itself and reverses. . What are the main components of TD Sequential? TD Sequential has two parts – TD Setup and TD Countdown. The first phase of TD Sequential starts with a TD Setup and is completed with a 9 count. When the 9 count is completed, it is at that point, a price pause, price pullback, or reversal is likely. It is also at tha
Noize Absorption Index MT4
Ekaterina Saltykova
5 (1)
Noize Absorption Index - is the manual trading system that measures the difference of pressure between bears forces and bulls forces. Green line - is a noize free index that showing curent situation. Zero value of index shows totally choppy/flat market.Values above zero level shows how powerfull bullish wave is and values below zero measures bearish forces.Up arrow appears on bearish market when it's ready to reverse, dn arrow appears on weak bullish market, as a result of reverse expectation. S
Atomic Analyst
Issam Kassas
5 (2)
Innanzitutto, vale la pena sottolineare che questo indicatore di trading non è repaint, non è ridisegno e non presenta ritardi, il che lo rende ideale sia per il trading manuale che per quello automatico. Manuale utente: impostazioni, input e strategia. L'Analista Atomico è un indicatore di azione del prezzo PA che utilizza la forza e il momentum del prezzo per trovare un miglior vantaggio sul mercato. Dotato di filtri avanzati che aiutano a rimuovere rumori e segnali falsi, e aumentare il pote
Gli utenti di questo prodotto hanno anche acquistato
Gann Made Easy
Oleg Rodin
4.81 (101)
Gann Made Easy è un sistema di trading Forex professionale e facile da usare che si basa sui migliori principi del trading utilizzando la teoria di mr. WD Gann. L'indicatore fornisce segnali ACQUISTA e VENDI accurati, inclusi i livelli di Stop Loss e Take Profit. Puoi fare trading anche in movimento utilizzando le notifiche PUSH. Vi prego di contattarmi dopo l'acquisto! Condividerò i miei consigli di trading con te e fantastici indicatori bonus gratuitamente! Probabilmente hai già sentito parlar
Golden Trend Indicator
Noha Mohamed Fathy Younes Badr
5 (8)
Golden Trend indicator  is The best indicator for predicting trend movement this indicator never lags and never repaints and never back paints    and give  arrow buy and sell    before the candle appear  and it will help you and  will make your trading decisions clearer its work on all currencies and  gold and crypto and all time frame This unique  indicator uses very secret algorithms to catch the  trends, so you can trade using this indicator and see the trend clear on charts  manual guide and
- Real price is 80$ - 40% Discount ( It is 49$ now ) Contact me for instruction, add group and any questions! Related Products:  Bitcoin Expert , Gold Expert Non-repaint Introduction The breakout and retest strategy is traded support and resistance levels. it involves price breaking through a previous level.  The break and retest strategy is designed to help traders do two main things, the first is to avoid false breakouts. Many false breakouts start with a candlestick that breaks out of a leve
TPSpro RFI Levels
Roman Podpora
4.82 (22)
ISTRUZIONI       RUS   -   INGLESE       Si   consiglia di utilizzare con un indicatore       -       TPSpro   TENDENZA PRO -   Versione MT4         Un elemento chiave nel trading sono le zone o i livelli da cui vengono prese le decisioni di acquisto o vendita di uno strumento di trading. Nonostante i tentativi dei principali attori di nascondere la loro presenza sul mercato, lasciano inevitabilmente delle tracce. Il nostro compito era imparare a identificare queste tracce e interpretarle corre
TPSproTREND PrO
Roman Podpora
4.79 (19)
TPSpro TREND PRO   è un indicatore di tendenza che analizza automaticamente il mercato, fornisce informazioni sulla tendenza e sui rispettivi cambiamenti e fornisce segnali per entrare nelle operazioni senza ridisegnare. L'indicatore utilizza ciascuna candela e la analizza separatamente. Si riferisce a vari shock al rialzo o al ribasso. Punto di ingresso preciso per il trading di valute, criptovalute, metalli, azioni e indici! Versione MT5                   Descrizione completa dell'indicatore  
Easy Breakout
Mohamed Hassan
5 (6)
5 copies left before price increases to $120! After your purchase, feel free to contact me for more details on how to receive a bonus indicator called VFI, which pairs perfectly with Easy Breakout for enhanced confluence!   Easy Breakout is a powerful price action trading system built on one of the most popular and widely trusted strategies among traders: the Breakout strategy ! This indicator delivers crystal-clear Buy and Sell signals based on breakouts from key support and resistance zone
Dynamic Forex28 Navigator
Bernhard Schweigert
5 (4)
Dynamic Forex28 Navigator - Lo strumento di trading Forex di nuova generazione. ATTUALMENTE SCONTATO DEL 49%. Dynamic Forex28 Navigator è l'evoluzione dei nostri indicatori popolari di lunga data, che combinano la potenza di tre in uno: Advanced Currency Strength28 Indicator (695 recensioni) + Advanced Currency IMPULSE con ALERT (520 recensioni) + CS28 Combo Signals (Bonus). Dettagli sull'indicatore https://www.mql5.com/en/blogs/post/758844 Cosa offre l'indicatore di forza di nuova generazione?
Trend Screener
STE S.S.COMPANY
4.81 (89)
Indicatore di tendenza, soluzione unica rivoluzionaria per il trading di tendenze e il filtraggio con tutte le importanti funzionalità di tendenza integrate in un unico strumento! È un indicatore multi-timeframe e multi-valuta al 100% non ridipingibile che può essere utilizzato su tutti i simboli/strumenti: forex, materie prime, criptovalute, indici e azioni. OFFERTA A TEMPO LIMITATO: l'indicatore di screening di supporto e resistenza è disponibile a soli 50$ e a vita. (Prezzo originale 250$) (o
Scalper Inside PRO
Alexey Minkov
4.75 (60)
!SPECIAL SALE!  An exclusive indicator that utilizes an innovative algorithm to swiftly and accurately determine the market trend. The indicator automatically calculates opening, closing, and profit levels, providing detailed trading statistics. With these features, you can choose the most appropriate trading instrument for the current market conditions. Additionally, you can easily integrate your own arrow indicators into Scalper Inside Pro to quickly evaluate their statistics and profitability
Gold Stuff
Vasiliy Strukov
4.86 (247)
Gold Stuff è un indicatore di tendenza progettato specificamente per l'oro e può essere utilizzato anche su qualsiasi strumento finanziario. L'indicatore non ridisegna e non è in ritardo. Periodo consigliato H1. Su di esso l'indicatore funziona in modo completamente automatico Expert Advisor EA Gold Stuff. Lo trovi nel mio profilo. I risultati in tempo reale possono essere visualizzati qui.  Puoi ottenere una copia gratuita del nostro indicatore Strong Support e Trend Scanner, per favore scriv
Chart Patterns All in One
Davit Beridze
4.65 (17)
Lascia un commento dopo l'acquisto per ricevere 4 indicatori di alta qualità come bonus. L'indicatore Chart Patterns All-in-One aiuta i trader a visualizzare vari modelli di grafici comunemente utilizzati nell'analisi tecnica. Questo indicatore supporta l'identificazione dei possibili comportamenti del mercato, ma non garantisce la redditività. Si consiglia di testare l'indicatore in modalità demo prima dell'acquisto. Offerta attuale : 50% di sconto sull'indicatore "Chart Patterns All in One". M
MTF Supply Demand Zones
Georgios Kalomoiropoulos
4.82 (22)
Nuova generazione di zone di domanda e offerta automatizzate. Algoritmo nuovo e innovativo che funziona su qualsiasi grafico. Tutte le zone vengono create dinamicamente in base all'azione dei prezzi del mercato. DUE TIPI DI AVVISI --> 1) QUANDO IL PREZZO RAGGIUNGE UNA ZONA 2) QUANDO SI FORMA UNA NUOVA ZONA Non ottieni un altro indicatore inutile. Ottieni una strategia di trading completa con risultati comprovati.     Nuove caratteristiche:     Avvisi quando il prezzo raggiunge la zona di
Bull versus Bear
Mohamed Hassan
4.5 (18)
Enjoy a   50% OFF   Christmas holiday sale!   Send us a message after your purchase to receive more information on how to get your  BONUS  for FREE  that works in great combination with Bull vs Bear ! Bull versus Bear is an easy-to-use Forex indicator that gives traders clear and accurate signals based on clear trend retests . Forget about lagging indicators or staring at charts for hours because  Bull vs Bear provides real-time entries with no lag and no repaint, so you can trade with confide
FX Power MT4 NG
Daniel Stein
5 (14)
Sbloccate tutta la potenza di FX Power NG: l'ultimo misuratore di forza delle valute Da oltre otto anni, FX Power offre ai trader di tutto il mondo un'analisi affidabile e precisa della forza delle valute. Ora FX Power NG porta questo strumento di fiducia a un livello superiore, offrendo funzioni avanzate che portano precisione, personalizzazione e approfondimenti senza pari al vostro trading. Cosa rende FX Power NG un must per i trader più seri? FX Power NG si basa su tutto ciò che avete amat
FX Volume
Daniel Stein
4.58 (33)
FX Volume: Scopri il Vero Sentimento di Mercato dal Punto di Vista del Broker 1. Perché FX Volume è Estremamente Vantaggioso per i Trader Avvisi Precoce con una Precisione Impareggiabile • Ricevi informazioni quasi in tempo reale su quanti trader stanno comprando o vendendo una coppia valutaria, molto prima dei rapporti ritardati come il COT. • FX Volume è l’unico strumento che raccoglie questo tipo di dati reali da diversi broker retail e te li presenta in modo conciso. Gestione del Rischio
Trend Reversal – Il tuo alleato per identificare inversioni di tendenza su MT4 Sei alla ricerca di uno strumento potente e intuitivo per migliorare la tua analisi di mercato e prendere decisioni più consapevoli? L'indicatore Trend Reversal è stato progettato appositamente per i trader che vogliono identificare con precisione i punti di inversione del trend direttamente sulla piattaforma MetaTrader 4. Grazie alla sua combinazione di algoritmi avanzati e tecniche collaudate, Trend Reversal offre s
TrendMaestro
Stefano Frisetti
5 (3)
nota: questo indicatore e' per METATRADER4, se vuoi la versione per  METATRADER5 questo e' il link:  https://www.mql5.com/it/market/product/108123 TRENDMAESTRO ver 2.4 TRENDMAESTRO riconosce un nuovo TREND sul nascere, non sbaglia mai. La sicurezza di identificare un nuovo TREND non ha prezzo. DESCRIZIONE TRENDMAESTRO identifica un nuovo TREND sul nascere, questo indicatore prende in esame la volatilita' i volumi ed il momentum per identificare il momento in cui c'e' un'esplosione di uno  opi
FX Gunslinger
Oleg Rodin
5 (1)
Forex Gunslinger è un indicatore di segnali di inversione ACQUISTA/VENDI progettato attorno all'idea di combinare supporto/resistenza, crossover e oscillatori in modalità MTF. Quando tutto è allineato, l'indicatore genera un segnale ACQUISTA o VENDI. Sebbene l'indicatore sia basato sull'idea MTF, l'algoritmo è molto stabile e genera segnali di inversione affidabili. Questo è un indicatore di tipo MTF in cui può utilizzare un intervallo di tempo superiore o inferiore per calcolare i segnali per i
Currency Strength Wizard è un indicatore molto potente che ti fornisce una soluzione all-in-one per un trading di successo. L'indicatore calcola la potenza di questa o quella coppia forex utilizzando i dati di tutte le valute su più intervalli di tempo. Questi dati sono rappresentati in una forma di indice di valuta facile da usare e linee elettriche di valuta che puoi utilizzare per vedere il potere di questa o quella valuta. Tutto ciò di cui hai bisogno è collegare l'indicatore al grafico che
ATTUALMENTE SCONTATO DEL 31%! La soluzione migliore per ogni principiante o trader esperto! Questo indicatore è uno strumento di trading unico, di alta qualità e conveniente perché abbiamo incorporato una serie di caratteristiche proprietarie e una formula segreta. Con un solo grafico fornisce avvisi per tutte le 28 coppie di valute. Immaginate come migliorerà il vostro trading perché sarete in grado di individuare l'esatto punto di innesco di una nuova tendenza o opportunità di scalping! Co
Currency Strength Exotics
Bernhard Schweigert
4.87 (31)
ATTUALMENTE SCONTATO DEL 20%! La soluzione migliore per qualsiasi principiante o trader esperto! Questo indicatore è specializzato nel mostrare la forza della valuta per qualsiasi simbolo come coppie esotiche, materie prime, indici o futures. È il primo nel suo genere, qualsiasi simbolo può essere aggiunto alla nona riga per mostrare la vera forza della valuta di Oro, Argento, Petrolio, DAX, US30, MXN, TRY, CNH ecc. Si tratta di uno strumento di trading unico, di alta qualità e conveniente pe
Clever Order Blocks
Carlos Forero
5 (2)
Description Very precise patterns to detect: entry signals as well as breakout, support and resistance reversal patterns. It points out zones in which, with a high probability, institutional orders with the potential to change the price’s direction and keep moving towards it, have been placed.  KEY LINKS:   Indicator Manual  –  How to Install   –  Frequent Questions  -  All Products  How is this indicator useful? It will allow you to trade on the order’s direction, once its direction has been id
Innanzitutto, vale la pena sottolineare che questo Strumento di Trading è un Indicatore Non-Ridipingente, Non-Ridisegnante e Non-Laggante, il che lo rende ideale per il trading professionale. Corso online, manuale utente e demo. L'Indicatore Smart Price Action Concepts è uno strumento molto potente sia per i nuovi che per i trader esperti. Racchiude più di 20 utili indicatori in uno solo, combinando idee di trading avanzate come l'Analisi del Trader del Circolo Interno e le Strategie di Trading
Attualmente 20% di sconto! La soluzione migliore per ogni principiante o trader esperto! Questo software per cruscotti funziona su 28 coppie di valute. Si basa su 2 dei nostri indicatori principali (Advanced Currency Strength 28 e Advanced Currency Impulse). Offre un'ottima panoramica dell'intero mercato Forex. Mostra i valori di forza delle valute avanzate, la velocità di movimento delle valute e i segnali per 28 coppie Forex in tutti i (9) timeframe. Immaginate come migliorerà il vostro tra
PRO Renko System
Oleg Rodin
5 (26)
PRO Renko System è un sistema di trading altamente accurato appositamente progettato per il trading di grafici RENKO. Questo è un sistema universale che può essere applicato a vari strumenti di trading. Il sistema neutralizza efficacemente il cosiddetto rumore di mercato che consente di accedere a segnali di inversione accurati. L'indicatore è molto facile da usare e ha un solo parametro responsabile della generazione del segnale. Puoi facilmente adattare lo strumento a qualsiasi strumento di
Scoprire i livelli FX: L'indicatore di supporto e resistenza definitivo per il successo nel trading FX Levels è molto più di un semplice indicatore di supporto e resistenza; è un gioco che cambia le carte in tavola per i trader seri che vogliono precisione, affidabilità e funzionalità senza soluzione di continuità su tutti i simboli di trading, siano essi coppie di valute, indici, azioni o materie prime. Costruito sulla base del collaudato metodo Lighthouse e migliorato con un'adattabilità dina
Scalper Vault
Oleg Rodin
5 (27)
Scalper Vault è un sistema di scalping professionale che ti fornisce tutto il necessario per scalping di successo. Questo indicatore è un sistema di trading completo che può essere utilizzato dai trader di forex e opzioni binarie. L'intervallo di tempo consigliato è M5. Il sistema fornisce segnali di freccia accurati nella direzione della tendenza. Ti fornisce anche i segnali più alti e più bassi e i livelli di mercato di Gann. Gli indicatori forniscono tutti i tipi di avvisi, comprese le notifi
L'indicatore dei livelli di trading è un sistema di trading progettato per determinare i punti di ingresso, mantenere posizioni e la direzione del trend. Include diversi meccanismi che funzionano in un unico complesso, analisi delle onde della direzione del trend, analisi del livello durante la costruzione dei segnali, mostra possibili obiettivi TP e SL. Funzionalità dell'indicatore Le frecce di segnale appaiono sulla candela corrente e non vengono ricolorate. Utilizza algoritmi speciali per c
Reversal Master
Alexey Minkov
4.92 (13)
!SPECIAL SALE! The Reversal Master is an indicator for determining the current direction of price movement and reversal points. The indicator will be useful for those who want to see the current market situation better. The indicator can be used as an add-on for ready-made trading systems, or as an independent tool, or to develop your own trading systems. The Reversal Master indicator, to determine the reversal points,  analyzes a lot of conditions since the combined analysis gives a more accura
GOLD Impulse with Alert
Bernhard Schweigert
4.6 (10)
Questo indicatore è una super combinazione dei nostri 2 prodotti Advanced Currency IMPULSE with ALERT  +   Currency Strength Exotics . Funziona per tutti i time frame e mostra graficamente l'impulso di forza o debolezza per le 8 valute principali più un simbolo! Questo indicatore è specializzato nel mostrare l'accelerazione della forza delle valute per qualsiasi simbolo come oro, coppie esotiche, materie prime, indici o futures. Primo nel suo genere, qualsiasi simbolo può essere aggiunto all
Altri dall’autore
ZigZag function The first zigzag was proposed by Arthur A. Merrill in 1977 and is based on the vertical axis (price range %). The second zigzag is based on the horizontal axis (period), which is widely known in MT4 and MT5. this is the third zigzag designed from a completely new perspective. However, it is not based on originality, but on more fundamental theory. First, I created the smallest zigzag 0. I bundled zigzag 0 together in accordance with Dow Theory to create zigzag 1. I bundled z
Filtro:
Nessuna recensione
Rispondi alla recensione