Conheça o Mercado MQL5 no YouTube, assista aos vídeos tutoriais
Como comprar um robô de negociação ou indicador?
Execute seu EA na
hospedagem virtual
hospedagem virtual
Teste indicadores/robôs de negociação antes de comprá-los
Quer ganhar dinheiro no Mercado?
Como apresentar um produto para o consumidor final?
Pagamento de Expert Advisors e Indicadores para MetaTrader 5 - 87
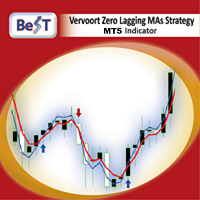
All those involved in trading do certainly know that Moving Average Crossovers for being tradable should be reliable and also they need to have minimal lag.
BeST_Vervoort Zero Lagging MAs Strategy is an outstanding indicator that can help you to achieve it and is based on S.Vervoort's work about Reliable and of Zero Lag MAs Crossovers as described in his TASC_05/2008 article " The Quest For Reliable Crossovers ". It's a Multipotentiality Indicator as it can display of either simply the Zero Lag

Niubility Scalping The Niubility Scalping indicator detects trend, give sell point and buy point. this indicator can use for scalping technique, and also use for trend technique.
Attention
Chart statistics will help you to optimize your trading, statistical accuracy to the hour.
It can works on every timeframe.
The indicator analyzes its own quality and performance.
Losing signals are highlighted and accounted.
The indicator is non-repainting.
It implements sound alerts.
Parame

Оптимизируемый, автоматический торговый советник. Основан на техническом анализе, за основу взята стратегия отскока от уровней. В стратегии НЕ используется "Сетка", "Реверс позиций" и "Мультипликатор последующего лота". Торгует одним ордером. Сделки держит от нескольких часов до нескольких дней. Закрытие позиций происходит по сигналу и по Стоп Лосс, Тейк Профит.
Базовые параметры настроены под EURUSD M5 .
Общие рекомендации: Пинг до сервера ДЦ не больше 300 ms. Тайм фрейм M5. Минимальный де

Niubility Trend Niubility Trend displays the trend direction for all time frames in real time.
You'll see at a glance at which direction the trends are running, how long they last and how powerful they are.
All this makes it an easy-to-use trend trading system for beginners, advanced and professional traders.
Features
Easy to trade Customizable colors and sizes It is non-repainting and non-backpainting It is fantastic as a trailing stop method It implements alerts of all kinds

Nenhum sistema de negociação de indicadores. A obra utiliza as ordens pendentes COMPRA PARADA e VENDA PARADA. Descrição das configurações do consultor: Lote - volume inicial de pedidos StartDist - distância para iniciar pedidos pendentes OrderDist - distância entre os pedidos Limites de contagem - o número de pedidos abertos simultaneamente ProfPercent - nível de lucro como uma porcentagem MagicNumber - identificador de pedidos do consultor lot_ratio - multiplicador para lotes de pedidos

This script use DIDI+BB indicators and display alerts, send mail, send notifications, and play sounds. Scanner can monitor market watch using ***MARKET*** as symbol name, with all timeframes Inputs: media_lenta=3 media_base=8 media_longa=20 bb_periodo=20 bb_shift=0 bb_deviation=1.96 symbols - Symbol list, separated by ; when using ***MARKET*** symbols from marketwatch will be included wait_interval_between_signals - Seconds between signals, default =60, but high frequency signals should red

ADX CROSS Trend Filter Alert
The average directional index (ADX) is used to determine when the price is trending strongly. In many cases, it is the ultimate trend indicator. We added many types of alerts plus the TrendDI Filter Level to aid in your search for better opportunities in the market.
Product Features Sound alert Push Notification (Alerts can be sent to your mobile phone) Signs on chart Alert box Trend Filter Delay Cross Filter Indicator Parameters ADXPeriod - Set the ADX indicator

Vejamos a natureza das mudanças de preço no mercado Forex, não prestando atenção às razões pelas quais essas mudanças ocorrem. Essa abordagem nos permitirá identificar os principais fatores que afetam o movimento dos preços. Por exemplo, vamos considerar os preços de abertura das barras no par de moedas EUR-USD e no período de tempo H1. Por esses preços, construímos o diagrama de Lameray (Figura 1). Neste diagrama, pode-se ver que o movimento dos preços ocorre basicamente de acordo com uma equaç

If you trade Forex, having detailed information about the currency strength and currency pairs correlation can take your trading to new heights. The correlation will help to cut your risk in half, and strength analysis will help to maximize the profits. This indicator provides a hybrid approach for selecting the most appropriate currency pairs using the strength analysis and currency pairs correlation.
How to use the Currency Strength Analysis
Suppose your trading strategy provides a buying o
Версия индикатора MT4 - https://www.mql5.com/ru/market/product/16415 Индикатор обозначает предполагаемые развороты рынка в виде стрелок. В индикатор встроены 3 вида разворота. Основной сигнал на разворот. Это более сильный и важный разворот. Обозначается самой крупной стрелкой. Альтернативный сигнал - это дополнительный сигнал без использования дополнительных фильтров в отличие от основного. Подойдет для скальпирования на малых таймфреймах. Смесь основного разворота и альтернативного, но с доба

Características Linhas das áreas de valor (POC, VAH e VAL) do presente e do passado personalizáveis separadamente, facilitando a leitura do trader sobre os níveis mais importantes. Áreas de valor e perfil de volume funcionam em qualquer período tempo e em qualquer mercado como por exemplo: ações, futuros, forex. commodities, etc. Cores dos perfis de volume personalizáveis em cor única ou degradê. O degradê oferece a visão da forma que o volume se comportou ao longo do tempo. Configuração de des
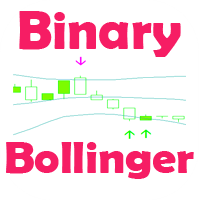
Стрелочный индикатор, выдающий сигнал при пересечении канала боллинждера. Сигналы выдаются в виде стрелок и подходят для торговли бинарными опционами.
Входные параметры Period of BB - период боллинджера Shift of BB - смещение боллинджера Deviation of BB - отклонение боллинджера Type of BB Signals - тип поиска сигналов Invert signals - Возможность давать инвертированные сигналы (для работы по тренду) Inform about finding the signal - параметр, отвечающий за получение уведомлений (Alert) о н

Trading signals are calculated using sma moving averages and last candle - the H1 period. Options: Lots - Lot size (if useCalcLot is false 1 lot used); useCalcLot = true riskpercentage =5 shortSmaPeriods = 50 longSmaPeriods = 200 useStopLoss = true stopLossPips = 100 useTakeProfit = true takeProfitPips = 300 useTrailingStop = true trailingStopPips = 120 Recommended currency pairs EURUSD - H1 period .

Приветствую тебя, мой контрагент на FORTS))) За 8 лет работы в офисе брокерской компании и 12 лет активного трейдинга я реализовал стабильную стратегию в робота. Если техническим языком, то этот робот торгует ретест уровня/двойное дно/вершину и прочие фигуры тех.анализа. Настройки советника позволяют ему определить экстремум перед разворотом движения и войти в сделку в самой выгодной точке.
Посмотри, Друг мой, внимательно параметры и сразу сможешь его настроить. Удачи тебе и профита! (ОБРАТИ

Read Elliott wave principle automatically. With the Swing Reader, you can easily read the Elliott Wave Principle through an automatic system. With swing, we mean a ZigZag market that is created by a breakout of its standard deviation. You can set the deviation manually, or you can let the indicator do it automatically (setting the deviation to zero).
Advantages you get Never repaints. Points showing a horizontal line, in which statistically a long wave ends. Candles showing a vertical line in

ZhiBiTMG é uma coleção de indicadores de tendências e martingale para todos os segmentos de mercado e todos os ciclos gráficos. Muitos indicadores no mercado violam a tendência, mas afirmam ser precisos, mas é realmente preciso? Na verdade, não é preciso! Porque o mercado deve seguir a tendência. Este indicador ZhiBiTMG dá o sinal de Martingale na premissa da tendência. Isso estará de acordo com as regras do mercado. Instruções de uso: A linha vermelha é a linha de tendência descendente (Sell),

Características Ponto de início da VWAP movimentável. 7 tipos de métodos de cálculos da VWAP: fechamento, abertura, máxima, mínima, preço médio, preço típico e fechamento ponderado. 2 tipos de cálculo de volume: ticks ou volume real. Desse modo, o indicador funciona em qualquer mercado, como por exemplo: ações, futuros, forex, commodities, etc. Cor, estilo de linha e espessura de linha da VWAP personalizável. Label que exibi o preço atual da VWAP. Alerta de rompimento na VWAP que pode ser ativa

Características 3 tipos de caixas: altista, baixista e desconhecida. A caixa desconhecida surge quando os preços se movem no sentido oposto a da caixa atual. Permite definir a pontuação necessária para a troca de caixa. Permite definir tanto os tipos e as cores das bordas das caixas ou cor de fundo. Texto que mostra a pontuação de reversão das caixas. Permite definir o tamanho, cor, posição de canto e a margem vertical do texto. Aba Parâmetros de Entrada Reversal Points - Pontos de reversão. Lim
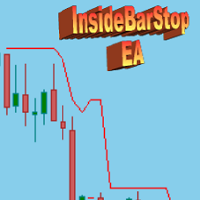
This Export Advisor implements the trailing stop algorithm "Trailing Stop with Inside Bars" that was suggested by the famous German trader and author Michael Voigt ("Das grosse Buch der Markttechnik") to capture robust gains when trading strong price moves. It is used for semiautomatic trading. You open a position manually and apply the expert to the chart. It modifies your order by setting a stop loss according to the trailing stop algorithm. Your trade direction (Long/Short) is detected automa

Características 3 tipos de torres: altista, baixista e desconhecida. A torre desconhecida surge quando os preços se movem no sentido oposto a torre atual. Texto que mostra a porcentagem restante para a mudança de torre. Permite definir a pontuação necessária para a troca de torre. Permite definir o tamanho da fonte dos textos de porcentagem. Permite definir tanto as cores das torres quanto as cores dos textos de porcentagem.
Aba Parâmetros de Entrada Reversal Points - Pontos de reversão. Limit

Индикатор показывает развороты рынка в виде стрелок. Разворотные сигналы основаны на моих личных наблюдениях за поведением рынка. В основу взяты такие принципы как поиск экстремумов, объемы и Price Action. Индикатор дает сигналы на следующих принципах: Поиск окончания тенденции на рост/снижение рынка Поиск модели разворота на основе Price Action Подтверждение разворота объемом контракта. Также в индикатор встроен сигнал при появлении стрелки. Индикатор не перерисовывается. Индикатор не перерисов
SymbolAutoChanger PRO MT5 There is also version for MetaTreader4 This tool allows you to automatically change the chart symbols in a row. Example: EUR → GBP → JPY → CHF → CAD → AUD → NZD You need only to set up interval in seconds between auto switch. Also, you can choose whether to switch between all symbols provided by your broker or only between symbols available in the Market Watch window.
PRO version has following featuters: Next button Previous button Pause/Continue botton With this e

Referências: "A Modern Adaptation of the Wyckoff Method" "The Secret Science of Price and Volume" "Trades About to Happen" Para saber mais pesquise na internet: "The Wyckoff Method", "Weis Wave" and "Volume Spread Analysis".
Carcterísticas 3 tipos de ondas: altista, baixista e desconhecida. A onda desconhecida surge quando os preços se movem no sentido oposto a onda atual. Texto que mostra a porcentagem restante para a mudança de onda. Permite escolher o tipo de volume que serão acumulados

Scalper Private O Expert Advisor pode trabalhar em qualquer modo de negociação, começando com escalpelamento, bem como para modos de operação de médio e longo prazo, tudo depende das configurações do Expert Advisor. Descrição das configurações do consultor: Time_next_order - tempo em segundos após o qual o próximo pedido será aberto Lote - muitos pedidos TakeProfit - nível de lucro StopLoss - nível de perda Time_close_order - tempo em segundos após o qual um pedido lucrativo será fechado Magic

This long-term trading system works on 12 pairs and 4 timeframes . The Expert Advisor uses various trading systems, such as trend trading, counter-trend trading and others. This increases the chances of sustained growth and reduces exposure to a single pair or individual operations. The risk is tightly controlled.
/>
The EA has the built-in smart adaptive profit taking filter. The robot has been optimized for each currency and timeframe simultaneously. It does not need arrival of every tick

Estratégia Bandas de Bollinger (“Estratégia da Paula”)
Estratégia A estratégia desse robô é baseada no retorno as médias, operando o indicador Bandas de Bollinger. Essa estratégia é popularmente conhecida como “Estratégia da Paula”. Basicamente o robô fica monitorando barras que rompam a Banda de Bollinger (tanto a superior quanto a inferior) para depois voltar para dentro da Banda na próxima barra. Se a condição acima for satisfeita, considerando também os demais parâmetros do robô, o mesmo

What is this: Violent trading: means sending a large number of orders to your brokerage server, it can conduct a stress test of the trading. In this program you can run a variety of trading tests. Now you can trade at high speed, For example 1000 orders in an instant. The Demo version's link: https://www.mql5.com/en/market/product/38431/ Why to use: Whether manual trading or EA trading, the status of the broker server is very important. So it is beneficial to conduct a trading stress test on

Esta ferramenta foi desenvolvida para ajudar os traders nos treinos candle a candle e em modo replay. Nas configurações do indicador, o usuário escolhe a data inicial do treino e o indicador irá esconder automaticamente todos os candles após esta data. Dessa forma, o usuário poderá fazer estudos no gráfico antes de iniciar o treino. Iniciando o treino, o usuário poderá então simular os seus trades com muita rapidez e facilidade!
Este é mais um produto desenvolvido por Renato Fiche Junior e di

Este indicador foi desenvolvido para auxiliar na análise de um ativo em múltiplos tempos gráficos. Nas configurações do indicador, o usuário escolhe a cor, largura e estilo das linhas horizontais para cada tempo gráfico. Dessa forma, as linhas horizontais automaticamente terão a configuração definida para o tempo gráfico ao serem adicionadas no gráfico.
O MTF Lines também permite o controle de visibilidade de outros objetos como retângulos, linhas de tendência e textos.
Este é mais um produ
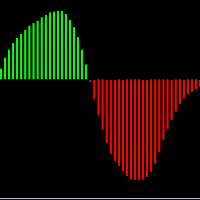
É um indicador oscilador baseado no "MACD" convencional porém com suavização . Através desse indicador você será capaz de operar sem os ruídos produzidos pelo indicador "MACD" convencional. Em quais ativos o indicador funciona: Em qualquer ativo do mercado, tanto em forex, como B3 ou binárias. Qual é o novo parâmetro: Smooth Period ou período de suavização, que representa o período que será suavizado no "MACD".

Use of support and resistance in systematic trading is very subjective. Every trader has their own idea and way to plotting the support and resistance levels on the chart. KT Support and Resistance indicator take out this ambiguity out of the situation and automatically draws support and resistance levels following an algorithmic approach using a unique multi-timeframe analysis.
When launched on the chart, It immediately scan the most significant extreme points across all the available timefr

Indicador multi-nivel y multi-timeframe que permite seguir la tendencia del precio de cualquier par de divisas, metales, acciones, CFD's, etc. Intuitivo y fácil de aplicar sobre cualquier gráfico.
Parámetros: Timeframe : Marco de tiempo que se le aplicará al nivel Period : Periodo que se aplicará Applied Price : Precio a aplicar
Aplicaciones: Se puede usar aplicando diferentes niveles sobre el mismo gráfico, por ejemplo, in nivel de 8, 14, 20, etc.
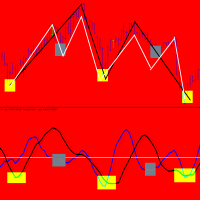
TimingCycleWithLLV is an excellent tool to determine the timing of your entry point! Everyone knows that cycles exist both in nature and in financial markets.Cycles are present in all time frames,from 1 minute to 1 year.Sometimes they are very clear to identify,others there is overlap between cycles of varyng duration. I can say this:the one-day cycle corresponds to the duration of a trading day( for example the one-day cycle for GERMAN DAX index is 14 hours as the trading day is 14 hours). Obvi

Apesar de um indicador muito simples, ele auxilia o trader que por ventura fica posicionado vários dias em uma operação se, o Swap do ativo esta a favor ou contra a sua operação. É o indicador ideal para operadores de longo prazo. O Swap é a taxa que o operador paga por ficar posicionado de um dia para outro ou as vezes de uma semana para outra. Há estratégias que além de um setup e um gerenciamento de risco contemplam também operar a favor do Swap.
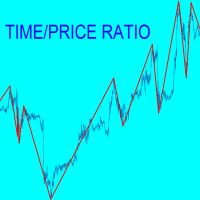
A chart is made by price and time but many traders consider only price.For each swing TIME-PRICE RATIO indicator shows in real time ratio between price/time and time/price. Moreover in the past you can read for each swing :number of pips;number of bars;ratio P/T and ratioT/P. Why it is usefull? because when P/T or T/P is a fibonacci ratio,the probabilities increase for inversion near support/resistance lines.During swing formation an audible alarm and a warning window advise you that a fibonac

Better Scroll habilita e desabilita o recurso AutoScroll do MT5 quando você rola, tornando o recurso mais intuitivo e conveniente. Você não precisará mais habilitar e desabilitar o AutoScroll manualmente ou levá-lo ao final do gráfico porque você esqueceu de desativá-lo quando estava testando ou analisando dados históricos de preços. Resumo
AutoScroll é DESATIVADO quando:
Clique do mouse + Arraste para a esquerda (passado da vela aberta no momento) Roda do mouse Rolar para a esquerda (passand

First thirty minutes are essential for a trading session. The early reaction of traders and market players sets a path for the rest of the day. KT London Breakout EA takes advantage of this phenomenon, and after analyzing the first thirty minutes of London session, it places two bidirectional pending orders. One of pending order is eventually canceled after realizing the market direction with certainty.
It has been strictly tested and developed for EUR/JPY using 30-Min Time Frame. You can ex
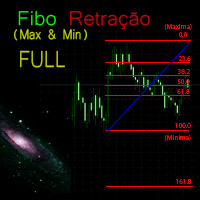
Funcional no mercado Forex. Funcional no mercado B3 - Bolsa Brasil Balcão. Motivação O indicador técnico de retração Fibonacci para muitos é essencial e a base de todas a previsões dos movimentos do mercado. O nome da ferramenta vem do matemático italiano Leonardo de Pisa (século XIII).
Essa versão FULL ira funcionar no Meta Trader 5 em qualquer tipo de conta.
Para testar na conta DEMO baixe a versão grátis em: https://www.mql5.com/pt/market/product/37855
Funcionamento O Fibo Ret
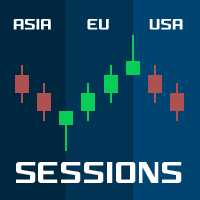
Sessions PRO is a perfect tool which divide your chart screen by 3 main market sessions: 1> asian 2> european (with division for Frankfurt and London start) 3> american
Sessions PRO is perfect especially for trading indices, where main pivot points often occurs along with new market center enters the market. With Sessions PRO you see what events happened at their exact corresponding time - European and American moves and pivot points are much more important than asian. Stop analyzing your

this indicator very simple and easy if you understand and agree with setup and rule basic teknical sba you can cek in link : please cek my youtube channel for detail chanel : https://t.me/SBA_FOREX_SIGNAL https://youtu.be/-Vtp99XGfe0 an for detail info contact me https://t.me/shadowbreakerfx basicly setup buy (long) for this indicator is Magenta- blue and green candle or magenta - green and green candlestik and for setup sell (short) is Black - yellow - and red candle or black - red and red

iVolX indicator horizontal volumes for all time periods
Main settings of the indicator: VolumeSource - select data for volumes (tick or real) PeriodMinutes - selection period for rendering of volumes PeriodsNumber - number of periods to show on the chart StartDate - the start date of the calculations ClusterPoints - cluster width Color - color MaxVolColor - maximum volume color ValueArea - the value of the zone of balance ValueAreaColor - color of the balance zone MaxVolFontSize - font size Ma

Индикатор, показывающий момент преодоления нулевой отметки индикатора MACD. Подходит для бинарной торговли, т.к. имеется возможность посчитать точность сигналов, в зависимости от времени экспирации.
Входные параметры Period of SMA1 - Период 1 скользящей средней Period of SMA2 - Период 2 скользящей средней Period of SMA3 - Период 3 скользящей средней Price Type - Тип цены, используемый индикатором MACD Invert signals - Возможность давать инвертированные сигналы (для работы по тренду) Infor

A useful feature may be to determine the normal frequency of round-sized trades, and monitor deviations from that expected value. The ML algorithm could, for example, determine if a larger-than-usual proportion of round-sized trades is associated with trends, as human traders tend to bet with a fundamental view, belief, or conviction. Conversely, a lower-than-usual proportion of round-sized trades may increase the likelihood that prices will move sideways, as silicon traders do not typically hol
Easley et al. study the frequency of trades per trade size, and find that trades with round sizes are abnormally frequent. For example, the frequency rates quickly decay as a function of trade size, with the exception of round trade sizes {5, 10, 20, 25, 50, 100, 200,…}.
These authors attribute this phenomenon to socalled “mouse” or “GUI” traders, that is, human traders who send orders by clicking buttons on a GUI (Graphical User Interface).
In the case of the E-mini S&P 500, for example, si
Easley et al. [2011] proposed a high-frequency estimate of PIN, which they named volume-synchronized probability of informed trading (VPIN). This procedure adopts a volume clock, which synchronizes the data sampling with market activity. For additional details and case studies of VPIN, see Easley et al. [2013]. A number of studies have found that VPIN indeed has predictive power: Abad and Yague [2012], Bethel et al. [2012], Cheung et al. [2015], Kim et al. [2014], Song et al. [2014], Van Ness et

Hasbrouck follows up on Kyle’s and Amihud’s ideas, and applies them to estimating the price impact coefficient based on trade-and-quote (TAQ) data. Consistent with most of the literature, Hasbrouck recommends 5-minute time-bars for sampling ticks. This indicator is based on Advances in Financial Machine Learning 2018 - Marcos Lopez de Prado book, Page 289. --- This code can run slow when using big timeframes, it use copytick to get dollar volume, in a next version I will implement a temporary i
This indicator implements the Corwin and Schultz Estimator based on Advances in Financial Machine Learning 2018 - Marcos Lopez de Prado, page 284. It's a spread estimator using high/low and a rolling window (configurable). It works with low liquidity markets as a robust estimator. It's interesting when you need to track spread changes, more information can be found at Marcos book.
Amihud studies the positive relationship between absolute returns and illiquidity. In particular, he computes the daily price response associated with one dollar of trading volume, and argues its value is a proxy of price impact. Despite its apparent simplicity, Hasbrouck [2009] found that daily Amihud’s lambda estimates exhibit a high rank correlation to intraday estimates of effective spread. This indicator is based on Advances in Financial Machine Learning 2018 - Marcos Lopez de Prado book,

In Kyle’s model, the variable captures price impact. Illiquidity increases with uncertainty about v and decreases with the amount of noise Kyle argues that the market maker must find an equilibrium between profit maximization and market efficiency. This indicator is based on Advances in Financial Machine Learning 2018 - Marcos Lopez de Prado book, Page 288.
This indicator implements the Rool Model Estimator based on Advances in Financial Machine Learning 2018 - Marcos Lopez de Prado, page 283. It's a spread estimator using trade by trade (copytick) values from last trades (configurable). It works with low liquidity markets as a robust estimator considering the covariance between price diferences. It's interesting when you need to track spread changes
This indicator implements the High Low Volatility Estimator based on Advances in Financial Machine Learning 2018 - Marcos Lopez de Prado, page 284. It's a robust estimator using High/Low values from past bars (configurable). It's robusto to Gaps (open/close of days to stock markets) since it's using high/low ration and not the close price. It's interesting when you need to avoid trading at a specific level of volatility

The Levels indicator has been created to simplify the process of plotting support and resistance levels and zones on selected timeframes. The indicator plots the nearest levels of the selected timeframes, which are highlighted in different colors. It significantly reduces the time needed to plot them on the chart and simplifies the market analysis process. Horizontal support and resistance levels are used to identify price zones where the market movement can slow down or a price reversal is like

The initial price is 75 USD, the future price is 150 USD
The EA uses a reverse strategy. To detect trading signals, the following indicators are used: Moving Average, Relative Vigor Index, Average True Range, Alligator and other custom indicators . Each pair has a stop loss, take profit, breakeven and trailing stop. The EA trades on many major currency pairs and timeframes. The EA uses timeframes: MetaTrader 4 MetaTrader 5 M1, M5, M15, M30, H1 M1, M2, M3, M4, M5, M10, M12 ,

ZigZag with backlight Fibonacci levels. The indicator has the ability to set any number of levels, the signals of the intersection of which can be sent to your mobile device email, as well as viewed via alerts. The indicator is designed to perform wave analysis, search for harmonic petterns, as well as search for other technical analysis figures. This Zigzag uses the principle of constructing extrema in which any trader will understand very easily. First, the indicator finds the upper and lower

O ZhiBiSmart é adequado para todos os ciclos gráficos de todas as variedades do mercado. Ele usa a chamada de retorno da tendência para criar a banda de rejeição, o que melhor previrá a banda e a tendência. Compre a ordem: uma marca com uma seta verde para cima; Compre o fecho: a marca da cruz verde aparece; Venda a ordem: uma marca com uma seta amarela para baixo; Venda o fim: uma marca de cruz amarela; Parametrização: [TrendPeriod]: o período da linha de tendência; [SignalPeriod]: o período da

Sensey Candlestick Pattern Recognition Indicator Sensey is an advanced tool capable of accurately identifying candlestick patterns. Not only does it recognize patterns, but it also detects price highs and lows within a specified time frame. Sensey operates seamlessly across multiple timeframes and is compatible with all currency pairs, futures, and commodities. Unlike some indicators, Sensey does not repaint historical data, ensuring reliable analysis even in cryptocurrency markets. You can wit

The indicator compares quotes of a given symbol and a synthetic quote calculated from two specified referential symbols. The indicator is useful for checking Forex symbol behavior via corresponding stock indices and detecting their convergence/divergence which can forecast future price movements. The main idea is that all stock indices are quoted in particular currencies and therefore demonstrate correlation with Forex pairs where these currencies are used. When market makers decide to "buy" one

Hunter Trend: Arrow Indicator for Binary Options Trading Hunter Trend is an arrow indicator designed for trading binary options (turbo options) on the M1 timeframe, allowing for short-term trading opportunities. How to Trade with this Tool: Signals may appear when a candlestick forms. Once such a signal appears, wait for the closure of that candlestick. Upon the opening of a new candlestick, open a trade for 1-2 candlesticks in the indicated direction. In this case, for 1-2 minutes. A blue dot

The Quantum GBPX is the latest addition to our suite of currency indices, and one which we have been asked for many times, and even more so since Brexit. It is an index which has taken us some time to develop, and through a series of complex calculations draws its primary data from a basket of currencies based on the old style dollar index, the Dixie. This is converted to a chart for the British pound. The result is an accurate index which describes strength and weakness for the GBP currency in
AutoBuy - is a script place pending buy stop orders with automatic calculation of the volume (number of shares) depending on the risk of money on the deal. Inputs: Risk - number in USD of money put on the trade.
BuyHighStep - the number of USD, a step up from the rates High of the current candle (bar) stock up to buy. Minimum value is 0.01
StopLossStep - the number in USD, the step from the price of the buy stop order down to close the deal at a loss. The minimum value of 0.10
TakeProfitStep

This indicator would help you I DENTIFY different HORIZONTAL SUPPORT / RESISTANCE LEVELS AND TRENDLINES.
ADVANTAGES: Use up till 5 different levels of Support and Resistance Use up till 5 different trend lines Use true/false options to display for Support/Resistance or Trend line Image
PARAMETERS: nPeriod: the time period to decide
Limits: the candles limit to look back
UseHorizontalLines: true/false option to display Horizontal Support and Resistance Lines UseTrendline: true/false opti

WOWOWOW ! now we are ready to establish patterns, when tracing these lines we can observe sets of 1000 lines or more forming patterns that are gradually setting up a scenario behind the empty graph of the screen of the meta trader. We can observe the behavior of the players over time and we can try to predict some future action simply by installing this powerful calculating machine. If you feel confused, try the LEKIMDIKATOR utility, this one I charge 10 dollars because it will give you a real

I present to your attention experimentally, a new EA that forms the trading range of the time interval. The EA has built-in proprietary algorithms for transaction support.
The emerging range is set manually by the EA settings, such ranges can be set up to two pieces. After a specified time and capture the trading range, the EA starts its work. When the price goes beyond the limits of this range, the EA opens an order with market execution, accompanying the transaction, placing Take profit and

O Exit Area Ultimate é um indicador técnico projetado para aprimorar as decisões de negociação, indicando os níveis diários Average True Range (ATR) e Average Daily Rate (ADR) no gráfico. Ao entender esses níveis, os traders podem avaliar facilmente o movimento médio de um ativo ao longo do dia. Este indicador versátil serve a múltiplos propósitos para os day traders, auxiliando na colocação de pedidos, identificando tendências intradiárias, definindo níveis de trailing stop loss e e

The Profit30 for MT5 platform( Also Available for MT4 in Mql5 Market Place) Expert Adviser, uses 7 different 'price action style' system on the EURUSD pair, on the M5, M15, M30, H1 timeframes.Best optimized perform in H1 chart
The EURUSD pair offers in general the best performance in the major part of the Profit30 EAs. In this EA, a selection of Profit30 systems has been rewritten and configured explicitly for get the best performance in the EURUSD pair. The EURUSD pair offers in general the

A MATRIZ
MODELO MATEMATICO PARA CALCULO DE PONTO FUTURO
CALCULADORA DA BOLSA E FOREX Lekimdikator calcula os melhores preços do dos mercados pra entrar ou sair
Aprenda a negociar em bolsas de valores, Forex, Ações, Opções de Ações, Câmbio, Fundos de Investimentos, Fundos Imobiliários ou qualquer mercado que tenha acesso ao MetaTrader 5 com Lekimdikator É uma Ferramenta para comerciantes iniciantes ou experientes , todos precisam usar para proteger suas contas e obter mais disciplina nos
Стрелочный индикатор, выдающий сигнал при пересечении 2 SMA. Сигналы выдаются в виде стрелок и подходят для торговли бинарными опционами.
Входные параметры First period- период 1 MA Second period - период 2 MA Invert signals - Возможность давать инвертированные сигналы (для работы по тренду) Candles to count - количество свечей для подсчета статистики Expiration - время экспирации сигнала Length - расстояние для сигналов Особенности :
Возможность использовать инверсию сигналов Возможн

This long-term trading system works on 20 pairs and 1 timeframes. The Expert Advisor uses various trading systems, such as trend trading, countertrend trading and others. This increases the chances of sustained growth and reduces exposure to a single pair or individual operations. The risk is tightly controlled.
The EA has the built-in smart adaptive profit fixing filter. The robot has been optimized for each currency and timeframe simultaneously. It does not need arrival of every tick and h
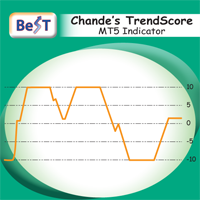
BeST_Chande TrendScore Indicator points the start of a trend with high degree of accuracy and it is amazing for scalping on the 1min timeframe. It is also a simple way to rate trend strength. It indicates both the direction and strength of a trend and can be easily combined with various trend-following, swing and scalping strategies.As of a trend’s direction and strength a value of +10 signals a strong uptrend while a value of -10 signals a strong downtrend. Generally a positive score shows an

Ultra Trend Hunter
Indicador encargado de seguir la tendencia de cualquier par de divisas, índice, materia prima, futuros, etc. Fácil de usar y muy intuitivo, te permite jugar con la mejor configuración para cada símbolo permitiendo con ello lograr excelentes entradas y salidas de cada operación de compra o venta. Su gráfica te permite identificar cuando entrar en una operación de compra/venta y te indica cuando salir de esa operación. Una vez que el indicador cambia de color, se debe esperar
Saiba como comprar um robô de negociação na AppStore do MetaTrader, a loja de aplicativos para a plataforma MetaTrader.
O Sistema de Pagamento MQL5.community permite transações através WebMoney, PayPay, ePayments e sistemas de pagamento populares. Nós recomendamos que você teste o robô de negociação antes de comprá-lo para uma melhor experiência como cliente.
Você está perdendo oportunidades de negociação:
- Aplicativos de negociação gratuitos
- 8 000+ sinais para cópia
- Notícias econômicas para análise dos mercados financeiros
Registro
Login
Se você não tem uma conta, por favor registre-se
Para login e uso do site MQL5.com, você deve ativar o uso de cookies.
Ative esta opção no seu navegador, caso contrário você não poderá fazer login.