Regardez les tutoriels vidéo de Market sur YouTube
Comment acheter un robot de trading ou un indicateur
Exécutez votre EA sur
hébergement virtuel
hébergement virtuel
Test un indicateur/robot de trading avant d'acheter
Vous voulez gagner de l'argent sur Market ?
Comment présenter un produit pour qu'il se vende bien
Expert Advisors et indicateurs payants pour MetaTrader 5 - 87

The informer provides information on the current state of open market positions. The visual presentation consists of two parts. The left side contains the latest transactions executed on the account. Transactions are sorted by time. The right part shows the current state of the aggregate positions of the instruments. Sorting of positions is carried out in descending order of the margin load on the account. Updating and recalculating the status of positions is performed automatically and/or by

Let´s do it - it is a Secure Automated Software for trade Forex market and indices.
Can used this EA whit 100$ in your account
The architecture is a Fully Automatic Autonomous Robot Expert capable of independently analyzing the market and making trading decisions
Let´s do it It is an advanced trading system. This is a fully automatic Expert Advisor. It is a 100% automatic system, the system controls both the inputs and the batches, the operator just has to place the robot on t

Inspired from, Time is the most important factor in determining market movements and by studying past price records you will be able to prove to yourself history does repeat and by knowing the past you can tell the future. There is a definite relation between price and time. -William Delbert Gann Caution: It's not HolyGrail System, It's a tool to give you insight of current market structure. The decision to trade is made only with combination of economical understanding of underlying instru

DYNAMIC SR TREND CHANNEL
Dynamic SR Trend Channel is a simple indicator for trend detection as well as resistance/support levels on the current timeframe. It shows you areas where to expect possible change in trend direction and trend continuation. It works with any trading system (both price action and other trading system that use indicators) and is also very good for renko charting system as well. In an uptrend, the red line (main line) serves as the support and the blue line serves as the
GRID for MT5 is a convenient tool for those who trade a grid of orders, designed for quick and comfortable trading in the FOREX financial markets. GRID for MT5 has a customizable panel with all the necessary parameters. Suitable for both experienced traders and beginners. It works with any brokers, including American brokers, requiring FIFO to close primarily previously opened transactions. The grid of orders can be either fixed - orders are opened with a fixed step, or have dynamic levels of op
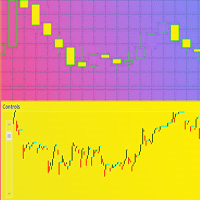
Индикатор для отображения свеч размером меньше одной минуты, вплоть до размера в одну секунду, для детализированного просмотра графика . Имеется ряд необходимых настроек для удобной визуализации. Настройка размера хранения истории ценовых данных транслируемых инструментов. Размер видимых свеч. Настройка отображения неподвижности на курсах графика. Возможность отображения на различных торговых инструментах. Удачной всем торговли.

The EA uses a strategy based on the use of two custom indicators and trading is carried out on 4 timeframes. The expert uses an adaptive impulse system for determining market entries that performs numerous calculations using two custom indicators on M5, M15, M30, H1, H4. A multi-currency adviser trades in 26 currency pairs. Use multicurrency testing for 26 currency pairs in MetaTrader 5. Instructions for launching multicurrency testing are shown in the video. The EA does not use Martingale and A

If you consider the extremes of the daily price as important points, this indicator will help in your trades.
Now, instead of manually drawing lines that mark daily highs and lows, you can use the O (HL) ² C Lines indicator.
Thus, the OHLC Lines indicator automatically plots the lines O (Open for the current day), H (High for the current day), L (Low for the current day) and C (Close for the previous day). Plot also the high and low of the previous day.
Thus, we have 4 static lines

Shoulder 1:500 0.01 - Lot of the first warrant for each Control Balance of $ a deposit 100 - Maximum lot 50 - Stop Loss in points 20 - Take Profit in points 40 - Distance to the averaging warrant in points 400 - The size of means for calculation of the first lot 2 - Multiplication coefficient for the warrant 124 - Magic number false is Printing of notices 0 - The commission for a tester and optimization

The EA looks to take advantage of the momentum effects in global markets. The momentum signal is supplemented with an uncertainty signal to filter false signals. Trades a few positions a day (+-3) but only if conditions are met. it can happen that there are no trades on a day or more than 3. This EA works with the HK50Cash, UK100Cash, US500Cash & GOLD. Select the symbols accordingly. Also input your timezone as defined by "GMT+-" examples below Rio :-3 New York :-5 London : 0 Johannesburg :2 Mo
Pattern Finder 2 is a MULTICURRENCY indicator that scans the entire market seeking for up to 62 candlestick patterns in 15 different pairs/currencies all in one chart. It will help you to make the right decision in the right moment. You can filter the scanning following the trend by a function based on exponential moving average. You can setup parameters by an interface that appears by clicking the arrow that appear on the upperleft part of the window after you place the indicator. Parameters ar
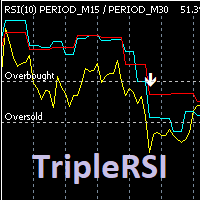
Индикатор отображает на графике данные RSI рабочего и двух старших тайм-фреймов, формирует сигналы выхода из зоны перекупленности / перепроданности кривой среднего временного периода. Опционально используется фильтр по данным старшего тайм-фрейма (расположение медленной линии выше средней для продажи и ниже средней - для покупки). Сигналы "подвального" индикатора дублируются на главном окне, отправляются сообщения во всплывающее окно, на почту и на мобильное устройство. Параметры индикатора: RSI
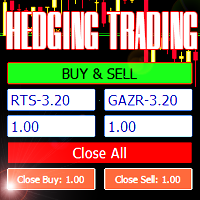
Advisor for hedging trading or pair trading.
A convenient panel allows you to open positions on the necessary trading instruments and lots.
Automatically determines the type of trading account - netting or hedging.
Advisor can close all its positions upon reaching profit or loss (determined in the settings).
A negative value is required to control losses (for example, -100, -500, etc.). If the corresponding fields are 0, the EA will not use this function. Settings: Close profit (if 0

This expert places pending stop orders using the Hammer and Shooting Star candle patterns at trade levels calculated using highest and lowest price from the last 40 candles combined with Bar Range . It is a long term expert and is especially made for the GPB/USD pair , M 15 timeframe . All positions have Stop Loss and Take Profit and the option to be closed at the end of the day . Lot size may be fixed or % of the account balance . If Risk Percent parameter is left to zero , the EA will use th
DSeize
DSeize - это индикатор для совершения покупки/продажи в MetaTrader 5. Простой и понятный индикатор, показывающий точки входа в рынок. Прекрасно подходит как для начинающих, так и для профессиональных трейдеров. Рекомендуемый таймфрейм H1. Рекомендуемые валютные пары: Мультивалютный. Работает как на 4-х, так и на 5-и значных котировках. Сигналы индикатора не перерисовываются. Особенности Вход совершается при закрытии часовой свечи и появлении индикатора.
Сигналы не перерисовываются. С
Expert Advisor Description ErusFX 1 Percent Hunter is a simple expert advisor based on stochastic oscillator that will collect sell and buy positions until the profit condition is reached by 1%. Pairs recommendation : EURUSD TimeFrames : H4 Please backtest various variations of the EA settings to get the result that suits your desired
Setting Description Volume =====>>>>> Set Lot from balance, example balance 1.000, volume 100 than lot is 0.01, example balance 1.000, volume 300 than lot is 0.

Manual de Instalação Update 1.4 Update 1.8 Update 1.9 Update 1.10 Update 1.12 Update 1.19 Mercado : B3 - BM&F Índices WIN - Contas Netting ou Hedge Timeframe : M6 (gráfico de Candle em 6 minutos) Capital Mínimo : R$ 1.000,00 Capital Máximo : R$ 100.000,00 Período de uso indicado : Ano inteiro VPS : Bastante recomendado uso de VPS, este robô tem melhor performance com velocidades de conexões mais rápidas. Martingale : NÃO, ou seja, operações únicas e com clara visibilidade de ga
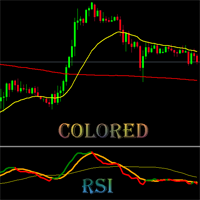
This is Colored RSI Scalper Free MT5 -is a professional indicator based on the popular Relative Strength Index (RSI) indicator with Moving Average and you can use it in Forex, Crypto, Traditional, Indices, Commodities. Colors are made to make trend, and changing trend more easily. Back test it, and find what works best for you. This product is an oscillator with dynamic overbought and oversold levels, while in the standard RSI, these levels are static and do not change.
This allows Colored RS

The indicator allows you to simplify the interpretation of signals produced by the classical MACD indicator.
It is based on the double-smoothed rate of change (ROC).
Bollinger Bands is made from EMA line.
The indicator is a logical continuation of the series of indicators using this classical and efficient technical indicator.
The strength of the trend is determined by Bands and main line.
If the bands width are smaller than the specified value, judge it as suqueeze and do not recommen
this indicator works on all pairs of Binary.com. we recommend using it on the M5 and M15 timeframe. when a blue arrow appears you must take the purchase and red you sell. you will withdraw your profit at the next resistance or support zone. please use risk management. its very important! without this, you can't make money on long term. if there any question ask it.
Fractal Reverse MTF - Indicator for determining the fractal signal to change the direction of the trend for МetaТrader 5.
The signal is determined according to the rules described in the third book of B. Williams:
- In order to become a signal to BUY, the fractal must WORK ABOVE the red line
- In order to become a signal for SALE, the fractal must WORK BELOW the red line
- Signals are not redrawn/ not repainting The main idea of the indicator:
- Determine the change in the directio

Inside the Black Hole It is an advanced trading system. This is a fully automatic Expert Advisor.
Inside the black hole. It is a 100% automatic system, the system controls both the inputs and the batches, the operator just has to place the robot on the graph and let it act It is an ideal system for people who do not want complications or strange configurations. The system is self-sufficient, performing all the work. Is a revolution in the customization of the trading. You can do

Riona is an Expert Advisor (EA) that build based on martingale and hedging method.
The main idea is place buy and sell in parallel and virtually, save the unprofitable positions with martingale, and keep the profit during trade with hedging. So, the account that used to trade, must support to take multiple order. The highest and lowest prices based NumCandle value that taken, are to indicate the range of new orders. Where the next order, with same type must be higher than 75% of difference be

Trade control panel for MetaTrader 5. Modified version of the panel from the article https://www.mql5.com/en/articles/4727 . Based on EasyAndFastGui library. Added option to close positions and trades separately. Can be used for controlling other EA which is running for example in VPS. More functionaly will be added with the future updates. No input parameters, just run EA as normally and enjoy. The window can be minimized.

EA is parsing trade signals from Telegram bot and executes it in MT5 terminal. To configure you need to complete the following steps: Specify the bot tokein in input settings. Specify a list of key words used for detecting a type of signal (Buy/Sell), for entry price and for stops. Specify default settings for stops and lot size in case incoming signal don't include these details.

Copier MT5 is the fastest and most reliable copier of transactions between several MetaTrader 4 (MT4) and MetaTrader 5 (MT5) accounts installed on one computer or VPS server. Transactions are copied from the MASTER account to the SLAVE account, copying occurs due to the exchange of information through a text file with a speed of less than 0.5 sec., The parameter is configured. The transaction copier monitors all changes in the MASTER account with high accuracy, adjusts SL and TP levels, support

Probably almost every trader at least once, but dreamed about non-lagging MAs. I embodied this dream in my indicator. Using this indicator, you can predict future values. But the main application of the indicator is to generate buy and sell signals.
Determining the market trend is an important task for traders. The Trendometer indicator implements an advanced algorithm for visualizing the market trend. The main purpose of the indicator is to assess the market. The indicator is designed to ide

The Expert Advisor analyzes tick micro-signals and determines the direction to open a position. Micro-signals are identified by predetermined codes, which in the optimization are recorded in the settings of the bot. When a bot sees the corresponding micro-signal, it reacts to it by opening a position and its accompaniment! The bot has good predictability. You can check the work of the bot on the simulation of real history, how to configure the tester will be shown in the screenshot. Also, we sh
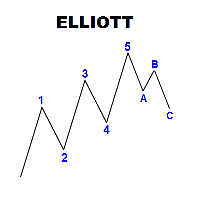
Panel with a set of labels for marking the Elliott wave structure. The panel is called up by the Q key, if you press twice, you can move the panel according to the schedule. The panel consists of seven rows, three colored buttons, each of which creates 5 or 3 labels of wave marking. Correction, consist of 3 tags, or five with a shift, you can break the chain of tags when installed by pressing the Esc key The optimal font for labels is Ewapro, which can be downloaded from a permanent link in the

The indicator shows: Average ATR over a selected number of periods Passed ATR for the current period (specified for calculating ATR)
Remaining ATR for the current period (specified for calculating ATR) Remaining time before closing the current candle Spread The price of one item per lot The settings indicate: Timeframe for calculating ATR (depends on your trading strategy) Number of periods for calculating ATR The angle of the chart window to display Horizontal Offset Vertical Offset Font size
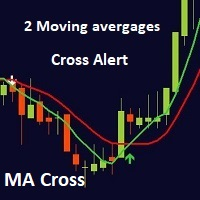
MA cross ALERT MT5 This indicator is a full 2 moving averages cross Alert ( email and push notification "mobile" ), 2 MA with full control of MA method and applied price for each moving average "slow and fast", -simple, exponential, smoothed, linear weighted. - close, open, high, low, median price, typical price, weighted price. you can modify periods as well for both MA. For any suggestions don't hesitate, thanks

The DYJ ThreeMACross is based on three Moving Average indicators. ThreeMACross is based on the following idea: crossing of three Moving Average lines (Fast, Middle and slow ones) is used as a signal for opening and closing a position together. Go Long when Fast MA (MA1) crosses above Middle MA (MA2), and Middle MA (MA2) crosses above Slow MA (MA3). Go Short when Fast MA (MA1) crosses below Middle MA (MA2), and Middle MA (MA2) crosses below Slow MA (MA3). The Expert Advisor also features money m
Scalping Skill is a safe scalping Expert Advisor for working during quiet hours. Suitable for both experienced traders and beginners. It works with any brokers, including American brokers, requiring FIFO to close primarily previously opened transactions. The EA does not use Martingale or a grid of orders. All orders are accompanied by a virtual stop loss and take profit in pips from 1 point, and there are also breakeven and trailing stop functions. The chart displays information about the speed

Hello all friends What I will present today is a grid system that doesn't have grid. Its work is Open to buy and sell at the same time. Or choose to open either side in the settings. The weakness of this system is that when the graph runs one way for a long time, it is very damaged. I have prepared a function for reducing damage.Details about how to set up according to the youtube link.

Stop Loss with Profit
This utility / expert for MetaTrader 5 modifies the stop loss of all your operations dynamically and automatically to ensure the minimum benefits you want, and be able to operate with or without Take Profit.
Maximize your benefits, by being able to trade with Unlimited Take Profit. You will ensure the number of minimum points you want to earn in each operation and the stop loss will be adjusted as long as the benefit of the operation grows.
For example: you open a pur
Boleta de negociação, adiciona automáticamente as ordens Take Profit e Stop Loss quando excutada uma ordem de compra ou venda. Ao apertar as teclas de atalho (A, D, ou TAB), serão inseridas duas linhas de pre-visualização, representando as futuras ordens de take profit (azul) e stop loss (vermelho), as quais irão manter o distanciamento especificado pelo usuário. Ditas ordens só serão adicionadas ao ser executada a ordem inicial. Ao operar a mercado, as ordens pendentes de take profit, e stop lo

Ondas de Divergência. Antes do mercado tomar um sentido e se manter em tendencia, existem sinais que podem ser lidos, nos permitindo assim entender o "lado mas forte", e realizar trades de maior probabilidade de acerto com risco reduzido, esses movimentos são persistentes e contínuos, proporcionando excelente rentabilidade. Ondas de Divergência é um histograma que acumula a divergência de entre preço e volume a cada tick, permitindo assim encontrar pontos de absorção, áreas de acumulo e distrib

The Rise: It is an advanced trading system. This is a fully automatic Expert Advisor, which allows you to presize the trade according to the preferences of the trade.
Is a revolution in the customization of the trading. The Rise is a expert advisor based in the indicator The Rise of Sky walker: ( https://www.mql5.com/es/market/product/44511 ) This system uses operations groups, which always beat the market
You can download the demo and test it yourself.
Very stable

Backtest from 2015-2019 MetaQuotes Data Every Tick Mode.
Start depo 10000 USD Lot size: 0,5 (You can modify it but maintain the ratio)
EA created for EURUSD M15
Open transaction based on RVI + Momentum + MA Crossover
Close transaction based on Stochastic
The parameters of indicators have been optimized.
Change manually only lot size.
EA does one transaction at the time.
No adding position, no martingale, no grid.
To avoid risky situations.
Fell free to increase lot size

This indicator is based on the ICCI.
If a long pattern is detected, the indicator displays a buy arrow.
If a short pattern is detected, the indicator displays a sell arrow. Settings
CCI Period - default set to (14) Features
Works on all currency pairs and timeframes
Draws Arrows on chart Colors
Line Color
Line Width
Line Style
Arrow Color This tool can help you analyse the market and indicates market entry.
KT Murrey Math robot incorporates a trading strategy that explicitly trades the price bars that crossed above or below a Murrey Math level. Entries: A buy order is placed when a bar closes above a Murrey Math level. A sell order is placed when a bar closes below a Murrey math level. Exits: EA places the stop-loss and take-profit always at the subsequent Murrey Math levels.
MT4 Version is available here https://www.mql5.com/en/market/product/45404
Features
This EA combines a simple Murrey

Version 1.14 incorporates some significant changes compared to all previous versions. Additionally, this robot has been designed in a new manner, focusing on minimal adjustable inputs because I personally advocate simplicity within the complexity of anything. Hence, a minimalist user interface has been implemented without compromising performance. This robot also has its version for the MT4 platform, which will be released soon. What can you expect from this robot? Well, I've been hard at work,

Orca EA ΜΤ5 est un Expert Advisor entièrement automatisé. Son algorithme avancé basé sur l'action des prix essaie de prédire la direction de la prochaine bougie et ouvre (ou non) le commerce approprié. Il possède un nombre unique de paramètres qui le rendent extrêmement polyvalent dans toutes les conditions du marché. Orca EA ΜΤ5 est livré avec des fichiers d'ensemble fournis pour 2022, spécialement optimisés pour les comptes ECN Raw Spread ICMarkets (serveurs de fuseau horaire GMT+3 basés
Expert Advisor Description - Basically, EA will open position in case of cross between main line and signal line on stochastic. - Unique to this EA, using the two pre-set stochastic so that the EA can open the trade position. - The first stochastic determines the cross, while the second stochastic determines the overbought or oversold levels.
Parameters Description - Volume_Lot => Number of lots determined from the balance percentage. Example Balance = 1.000 USD, Volume Lot = 100, Then lot

Expert Advisor Description Strategy using two classic indicators in MetaTrader, stochastic oscillator and moving average Accompanied by multi timeframe and parameter that can be changed according to the strategy that suits you
Feature Money Management : Stop Loss, Take Profit, Trailing Stop Trading Option : Stochastic Oscillator, two Moving Average, Multi Timeframes https://youtu.be/3dXAUUnxg1s
youtubeembedcode.com/pl/ http://add-link-exchange.com
Unique trend trading algorithm with advanced filtering and many features which should become a part of your trading arsenal. This indicator can give you also trading advisors (with take profit target), success rate scanner and much more.
Important information
For additional detailed information you can visit the 747Developments website.
Features Easy to use (just drag and drop to the chart) Possible to use with any trading instrument Possible to use on any time-frame Take profit advisors S

Just $10 for six months!!! Displays previous days Highs & Lows. You can set the number of days to display levels for, also the line style, color and width. This is very useful for traders using the BTMM and other methods like ICT. I'll be creating more indicators for MT5 for the BTMM. Send me your suggestions to my Telegram: https://t.me/JDelgadoCR Take a look at my other products at: https://www.mql5.com/en/users/jdelgadocr/seller

Just $10 for six months!!! Displays previous weeks Highs & Lows. You can set the number of weeks to display levels for, also the line style, color and width. This is very useful for traders using the BTMM and other methods like ICT. I'll be creating more indicators for MT5 for the BTMM. Send me your suggestions to my Telegram: https://t.me/JDelgadoCR Take a look at my other products at: https://www.mql5.com/en/users/jdelgadocr/seller

Just $10 for six months!!!. This will draw Order Blocks just by clicking on a candle. It will use the body or the wicks. It can also draw the mean threshold of the candle open/close or high/low. As a drawing tool, it is not active all the time after adding it to the chart. Activate by pressing 'b' twice on the keyboard within a second. If activated but then decided not to draw, deactivate by pressing 'b' once. Box color depends if candle is above or below current price. Settings/Inputs: Number

1. Why did I develop this series of indicators
I found that most traders need to use multiple time frame indicators. They usually switch time frame to see indicators. However, once the timeframe is switched, you cannot see the corresponding relationship between the price in the smaller timeframe and the indicator in the larger timeframe . For example: if your price chart is in H1 timeframe, you can see H4, D1 and W1 indicators in H1 timeframe Chart. This is more helpful for you to find t

The RiseTrading is a unique High quality and easy to use and affordable trading tool because we have incorporated a number of proprietary features and MACD and Stochastic indicators. The main advantages of the trend trading strategy used by the Expert Advisor are opening positions only in the direction of a trend, ability for the long-term retention of profitable positions allowing users to achieve good combinations of profit/loss distributions. That can work on a real account at any broker with

1. Why did I develop this series of indicators
I found that most traders need to use multiple time frame indicators. They usually switch time frame to see indicators. However, once the timeframe is switched, you cannot see the corresponding relationship between the price in the smaller timeframe and the indicator in the larger timeframe . For example: if your price chart is in H1 timeframe, you can see H4, D1 and W1 indicators in H1 timeframe Chart. This is more helpful for you to find t


Le MetaTrader Market est le meilleur endroit pour vendre des robots de trading et des indicateurs techniques.
Il vous suffit de développer une application pour la plateforme MetaTrader avec un design attrayant et une bonne description. Nous vous expliquerons comment publier votre produit sur Market pour le proposer à des millions d'utilisateurs de MetaTrader.
Vous manquez des opportunités de trading :
- Applications de trading gratuites
- Plus de 8 000 signaux à copier
- Actualités économiques pour explorer les marchés financiers
Inscription
Se connecter
Si vous n'avez pas de compte, veuillez vous inscrire
Autorisez l'utilisation de cookies pour vous connecter au site Web MQL5.com.
Veuillez activer les paramètres nécessaires dans votre navigateur, sinon vous ne pourrez pas vous connecter.