Conheça o Mercado MQL5 no YouTube, assista aos vídeos tutoriais
Como comprar um robô de negociação ou indicador?
Execute seu EA na
hospedagem virtual
hospedagem virtual
Teste indicadores/robôs de negociação antes de comprá-los
Quer ganhar dinheiro no Mercado?
Como apresentar um produto para o consumidor final?
Novos Expert Advisors e Indicadores para MetaTrader 5 - 71
O programa permite copiar facilmente transações entre MetaTrader 4 (MT4) e MetaTrader 5 (MT5) em qualquer direção. O programa foi projetado para funcionar em "Windows PC" e "Windows VPS". Qualquer tipo de cópia está disponível
MT4 - MT4 MT5 - MT5 MT5 - MT4 MT4 - MT5 *The copier works only on forex and only with currency pairs
*duas versões do produto Trade Copier para MT4 + Trade Copier para MT5 são necessárias para copiar entre os terminais MT4 - MT5.
MT4 - https://www.mql5.com/en/mark
DESCRIÇÃO O indicador EasyFollowerTrader-Bot2-DayTrade opera apenas a favor da tendência. Assim, o indicador, em primeiro momento, observar a tendência de três médias síncrona com o time-frame selecionado. Em seguida, o indicador observar a tendência do gráfico diário. Quando estes dois gráficos estiverem se movimentando na mesma direção, teremos a maior probabilidade de ganhos. Chamaremos esta região como região de alta probabilidade de ganho. Na região de alta probabilidade de ganho, o ind

Martingale. "Oberon iMA" consiste em 15 blocos separados (mini Expert Advisors), que somam o lucro e distribuem o rebaixamento ao longo do tempo.
Peculiaridades: Dados de entrada individuais para cada caractere. Os símbolos podem ser repetidos (mesmo 15 idênticos serão negociados separadamente um do outro). Em uma conta de negociação, você pode instalar vários "Oberon iMA" com configurações diferentes (observando a condição: Magic[i+1]>Magic[i]+15). Instalado em qualquer gráfico. Se o pod

Simple ATR Modern Uma ferramenta simplificada para rastrear a volatilidade do mercado com maior clareza, ideal tanto para day trading quanto para swing trading. É o melhor indicador para iniciar operações ou para iniciantes.
Cor do indicador visual: ATR Daily - Azul Melhore a análise combinando com o indicador Volatility Vision . Mede com precisão as flutuações nas condições de mercado, essencial para decisões tanto em day trading quanto em swing trading. Utiliza uma média móvel simples de 14
Deals printscreen é um script projetado para automatizar o armazenamento de imagens com transações na conta para análise posterior. O painel permite reduzir significativamente o tempo de trabalho técnico associado à pesquisa de transações no histórico e salvar arquivos no formato de imagem com exibição e desenho de todos os parâmetros da operação.
Quais tarefas este script resolve:
Você não precisa procurar o comércio desejado no histórico de transações: basta selecionar o período e o

Toda vez que o Trader abre uma negociação, ele deve saber o lucro e o risco da negociação que fez, para que possa determinar o risco e a oportunidade de lucro que obterá. Determinar esse cálculo manualmente pode ser bastante problemático, especialmente se houver muito comércio aberto para fazer.
O Trading Panel Katana é uma ferramenta utilitária que realmente ajuda os traders a atender a essas necessidades. Abrindo um mercado ou negociação pendente, determinando lotes, pips, posições de preço

WavePulse EA uses Price Action strategies and a built-in indicator to look for reliable signals with high winrate and low risk. The EA provides a very balanced risk-reward ratio and survives all market circumstances easily - even the most critical ones like Covid-19, Brexit, etc. It uses a martingale strategy to close all trades in profit. For more accurate trades, it is recommended to use the EA on M15 or higher timeframe. Recommend: Time frame: M15, H1. Use VPS with low latency (< 20ms). Use

"BiP" is an advanced trading system built on fuzzy logic, designed to offer dynamic and intelligent trade management. The system identifies potential entries (both long and short) by scanning through eight different signals, ensuring a solid strategy for pinpointing market opportunities. Additionally, it incorporates two distinct exit rules for managing active positions, offering flexibility in both long and short trades. The latest update brings notable enhancements, including new trading engi
"EA Maximum Breakout Scalper" - the scalper uses 2 breakout strategies. 1 - strategy for the breakdown of the nearest support and resistance levels. The system uses the search for extremes using smart technology to recognize high-quality and low-quality breakdowns, with support for filtering extremes. For the training of the adviser, the history of quotations for 22 years was used. 2 - strategy for the breakdown of the nearest candles. A smart technology is used to recognize high-quality and lo

The Roll the Field indicator displays signals in a simple and accessible way in two colors (when to buy and when to sell is determined by changing the color). Knowing the entry point of each currency is very important for every forex trader. The intelligent algorithm of the indicator accurately determines the trend, filters out market noise and generates entry signals.

IMPORTANT : When testing the EA or running it live, make sure to set "Activate MNG Martingale" to "True"
Hello & Welcome To MNG
MNG is a martingale EA that allows you to configure a lot of features that I'll detail below.
But first, I'd like to insist on the fact that a martingale EA is never safe, no matter if it has a good track record for 5+ years, if it shows incredible backtest results, if it's marketed as the best EA or whatever its price is ($30,000 or $50). A martingale EA might bl
FREE

Are you tired of the stress and frustration that come with Forex trading? Introducing G FORCE , the ultimate solution for a seamless and profitable trading experience. This expertly crafted EA (Expert Advisor) is designed to take the emotion out of trading, allowing you to trade with confidence and ease. G FORCE isn’t just another trading robot; it’s your professional trading partner, engineered to generate consistent profits while you sit back and relax. Whether you're new to trading or a seas
FREE

One of the main definitions for monitoring the currency market is a trend, which is why the Megan indicator was created in order to display the trend in a visual form. Forex indicator Megan is a real trading strategy with which you can achieve the desired results. As soon as the indicator is set, the main indicators will immediately begin to be recalculated at the price of the traded pair, based on the postulates of technical analysis. In addition, when potential entry points are detected, visua
The Average Daily Range (ADR) is an indicator that shows how far a currency pair can move in a day. Automatically displays the upper and lower ADR levels. Automatically calculates the percentage and distance of ADR achieved by the currency pair for the day. Notifies when the price reaches the ADR level. Changes the color and thickness of the ADR line when the price reaches it.
Everything is simple. The usual Information indicator.
Shows on the chart: Current spread, buy swap, sell swap, time to close the candle, broker time.
The indicator can be placed at the top right or at the bottom right of the chart.
Most often, the spread is called the difference between the sale and purchase price.
Swap is the cost of transferring a position to the next day.

This indicator paints any Inside Bar found on the attached chart in a Dark Gray Colour with Black Borders and Wicks. If there are multiple consecutive Inside Bars, then they would also be successively painted Dark Grey with Black Borders and Wicks as well. You may opt to change the colours set by default in order to better contrast with your chosen background and chart colours. I made this Indicator out of necessity as my trading required it. But I know there may be others out there who may need

In this indicator, Heiken Ashi candles are calculated with the most optimal method. You can also customize the results by adjusting the amount of period and method input. But the most important advantage of this indicator is the adjustment of the time frame value. You can use this to calculate the Heiken Ashi chandels to See in time frames with lottery in the lower time chart. In this case, you get the best signal to buy or sell using two or more Heiken Ashi indicators with different timeframes
FREE

F22 Raptor is a highly reliable, low risk EA, based on statistical arbitrage idea. Expert don't use any dangerous methods of money management and suitable for any broker conditions. The Expert Advisor tracks two correlated currency pairs at once and determines the moment, when a strong divergence occurs between the pairs. Then it opens opposite trades for each currency pair. Profit is formed during the reverse convergence of currency pairs. The Expert Advisor dynamically fixes profits and limi

Optimize before use in back test or live for better results for you and don't forget to account for spreads and slippage in optimization. This Expert is for 1 minute charts trading BTC/USD. Bitcoin on 1 minute use MACD, CCI and RSI for entry and exit logic. This EA was back tested and traded out of sample. Each trade has a stop loss and take profit. BTC compared to the indexes and Gold have huge differences, look at the example of traditional investing vs. Bitcoin. Yellow line represents

Boleta para operações Long & Short na bolsa Brasileira B3 exclusiva para o mercado A VISTA com lotes padrão. A boleta calcula automaticamente as quantidades dos ativos (compra/venda) da operação baseado no capital informado. É possível determinar os horários de início e término das operações quando selecionado opção para Day Trade. A boleta pode iniciar e terminar as operações automaticamente baseado em horários. Podem ser definidos altos de Ganho (TP) e perdas (SL) em percentual (%). Basta cli
You need to optimize before back test and use Last Month or Last Year Option in Tester. This is part of this EA, which has more advanced aspects to it: https://www.mql5.com/en/market/product/87051 This Expert work towards a positive expectancy. It take positions in a hedging fashion buy and sell on both sides. A hedge account is needed in order for this EA to do as intended. The EA is based on taking both sides, the random nature of the market and the capability of one side being in a positi

OPTIMIZE BEFORE BACKTEST AND TRADING Day trade the markets. Any market, any time frame but its recommended to trade 5 minutes for some inputs but experiment with time frames and assets to see the best . It is important to optimize the inputs of the EA before back testing and using. Last month option to a year is recommended.
Parameters for intraday trading are: Weight Weight of signal of the module in the interval 0 to 1. GoodHourOfDay Number of the only hour of day (from 0 to 23) when tra
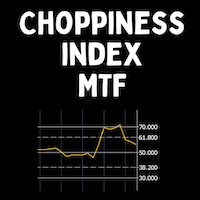
The Choppiness Index was created by Australian commodity trader E.W. Dreiss. It is designed to determine if the market is choppy (trading sideways) or not choppy (trading within a trend in either direction). A basic understanding of the indicator would be; higher values equal more choppiness, while lower values indicate directional trending. The values operate between 0 and 100. The closer the value is to 100, the higher the choppiness (sideways movement) levels. The closer the value is to 0,

This is a regression tree indicator for MT4/MT5.
This indicator classificate nodes on the time period so that the deviation becomes smaller,
and displays regression line and channel for each node.
It's free!
Attached CartDemo.ex4 and CartDemo.ex5 is a Demo version and has the following limitations:
Method is RandomForest only
Maximum number of bars is 200
Maximum number of trees is 2
Maximum tree depth is 2
Calculated waste lines are shown
Not display correlation coefficients
Fu
FREE

Este indicador é baseado na estratégia proposta pelo canal do YouTube 'The Secret Mindset', no vídeo "A Reliable Scalping Strategy I Discovered After 1 Month of Price Action Trading" Uma explicação completa e detalhada da estratégia e condições para filtrar os sinais são expostas no vídeo. * O criador do canal do YouTube não está relacionado ao desenvolvimento deste indicador Os sinais devem ser combinados com outros indicadores e filtrados pelo julgamento de cada trader
Indicador
Os compass
FREE

O Indicador Market Steps foi projetado e construído baseado nas correlações de Preço/Tempo de Gann, e otimizado por regras específicas de Price Action do Mercado Forex. Ele usa o conceito de fluxo de ordens de mercado para prever as zonas de preços potenciais que terão um alto volume de ordens.
Os níveis apresentados pelo Indicador podem ser usados para negociação, e/ou também para filtro de sinais de outras estratégias ou indicadores. Todo Trader precisa desta poderosa ferramenta para ter ao
DESCRIÇÃO O indicador EasyFollowerTrader-Bot3-DayTrade opera apenas a favor da tendência. Assim, o indicador, em primeiro momento, observar a tendência de três médias síncrona com o time-frame selecionado. Em seguida, o indicador observar a tendência do gráfico diário. Quando estes dois gráficos estiverem se movimentando na mesma direção, teremos a maior probabilidade de ganhos. Chamaremos esta região como região de alta probabilidade de ganho. Na região de alta probabilidade de ganho, o indicad

DESCRIÇÃO O indicador EasyFollowerTrader Bot4 DayTrade opera sempre a favor da tendência. Assim, o indicador, em primeiro momento, observar a tendência da média das máximas e mínimas dos candles do time-frame selecionado. Em seguida, observa se está tendência está de acordo com a tendência do gráfico diário para operar a favor da tendência majoritária. Quando estes dois gráficos estiverem se movimentando na mesma direção, teremos a maior probabilidade de ganhos. Chamaremos esta região como regiã

Sinal de conta real - https://www.mql5.com/ru/signals/1679047 Versão MT4 Expert - https://www.mql5.com/ru/market/product/86048 Prazo: M1 Pares de moedas recomendados: EURUSD, GBPUSD, USDCHF, EURGBP, USDCAD, AUDCAD, CHFJPY, EURCHF, USDJPY.
Cigarra - o mais recente desenvolvimento da equipe Varko Group Inc. Um Expert Advisor de negociação em várias moedas cuja estratégia é baseada em baixa volatilidade à noite. O EA não usa estratégias de grade de alto risco, m

Cores geradas de acordo parametro de Altura e Profundidade.
As analise são feitas seguindo a direção do preço e volume negociado se o valor negociado for superior a base de calculo o sistema muda a cor para verde, informando que a direção do preço e forte para compra, se o valor negociado for menor que a base de calculo o sistema muda para vermelho, indicando que o preço e forte para venda.
A cor branca e definida no momento que a tendência esta chegando ao fim indicando uma possível rever
FREE
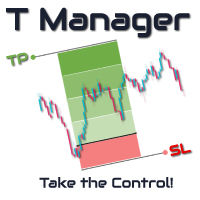
T Manager, the ultimate trade management solution designed by traders for traders. If you are searching for a simple and efficient trade panel, trade manager, or trade assistant, you are at the right place. The market contains a diverse number of those tools , but this one is designed by traders for traders . I designed this tool, and I am using it daily.
Take my advice and stop buying tools blended with un-useful features that you will never use, T Manager provides you with the essential

Este EA posue a opção de compra ou venda, você escolhe. Ele permanece sempre em operação, saindo de um com saldo positivo entra imediatamente na operação proxima. Não possui nenhuma estratégia de entrada com análise de mercado, apenas comprar ou vender a escolha do cliente. Ele tem um trunfo para operar martingale, Não se assuste com os resultados!! Se tiver um bom fundo de investimento usar pode usar essa ferramenta para ampliar o patrimônio. Teste muito este EA e compre sem MEDO.

This indicator uses a different approach from the previous version to get it's trendlines. This method is derived from Orchard Forex, and the process of making the indicator is demonstrated in there video https://www.youtube.com/watch?v=mEaiurw56wY&t=1425s .
The basic idea behind this indicator is it draws a tangent line on the highest levels and lowest levels of the bars used for calculation, while ensuring that the lines don't intersect with the bars in review (alittle confusing? I kno
FREE
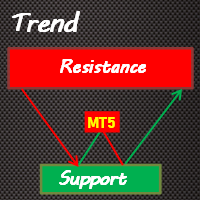
Trend Support Resistance is a fairly simple indicator that provides traders with confirmed immediate support and resistance in whatever timeframe you monitor. It's good for short-term and long-term order blocks. With the default settings, the indicator identifies critical support and resistance areas. Bearish Order Blocks are around the OrangeRed areas while Bullish Order Blocks almost always form near the LawnGreen areas. We have also added a Multi-timeframe feature that can be helpful to allow

66% discount only for the first 5 buyers (4 left), main price: 300 $ Show the signal as a line graph Prediction of 10 future candles and advanced display Prediction of individual candles graphically Can be used in the gold symbol Can be used in 15 minutes time frame Can be used only in gold symbol and only 15 minutes time frame
How the indicator works:
Using complex mathematical calculations, it predicts the future 10 candles. The predictions of this indicator are based on price. Theref

TransitGhost Signal indicator, this is one of my best forex trading strategy. The strategy is based on the simple moving average cross, 5 SMA AND 200 SMA of which take a longer time to cross. Whenever the is a cross between the 5 SMA and 200 SMA a signal will be given, when the 5 SMA cross the 200 SMA to the upside ,a buying arrow will appear on chart, and push notification(alert) "Buy now, use proper risk management" will be sent on both the MT5 PC and mobile app, and when the 5 SMA cross the 2
FREE

Write this EA for my own use. but decided to sell it as well . The EA has a wide variety of uses. Can be set as you wish. But please understand that profits depend on the capabilities of EA users. Not just the EA alone. I try to reduce the difficulty of use. Make EA easier to use and more friendly to investors. I want everyone to try the demo before actually buying it. To make sure this EA is right for you or not. ... About setting up my EA click that youtube link.

Initiated in 1995 by the physicist and technical analyst Paul Levine, PhD, and subsequently developed by Andrew Coles, PhD, and David Hawkins in a series of articles and the book MIDAS Technical Analysis: A VWAP Approach to Trading and Investing in Today's Markets.Latterly, several important contributions to the project, including new MIDAS curves and indicators, have been made by Bob English, many of them published in the book.
FREE

O indicador irá plotar no grafico uma linha que corresponde ao preço de fechamento do dia anterior, e baseado nisso, ele irá plotar os niveis percentuais de variacao do preco do ativo em questao. Poderá ser usado em qualquer ativo. Periodo: Determinar se o preco de fechamento devera ser o diario, semanal ou mensal Percentagem minima: Determinar qual a percentagem para que o indicador plote no grafico os niveis e subniveis, ex: 0.5 ele ira plotar no grafico uma linha a cada 0.5% de variacao e os

Optimize EA before test and buying. Euro King is for trading EUR/USD on 15 min time frames. Optimize to find the best stop loss and take profit for your risk management. This EA does not trade hundreds of times a day. In the test it traded 100 times in a year. Try other time frames to see if there optimizations for different results. The EA uses Bollinger bands, moving averages and RSI for logic in the entry and exits. Martingales are not used and all trades have a stop loss and a take pr

Uma versão baseada na descrição do David Waves em seu livro 'Trade About to Happen' da sua adaptação do gráfico de onda de Wyckoff. O indicador acumula o volume de forma direcional, somando a cada fechamento de tijolo ou vela, com indicação de cor para alta e baixa. Podendo ser usado com volume real e de tick. Ele também muda de cor quando há a superação do valor acumulado da onda anterior, sendo o sinal de entrada. Amarelo é usado para doji em gráfico de fala. Ele continua com as somas anteri

EA " Swing trade by porl " can use for EURUSD XAUUSD GBPUSD time frame H1 for good. The default settings can be used for saving ports EURUSD. but the minimum profit If you want high profit You can set the inputs you want. only that the value that is put into the supplied, if managing money in the port To fit, there will be a relatively stable profit. If adjusting the higher lot, the risk will be higher as well, but the profit will come according to the risk we invest. We recommend that every

Double Correlation indicator (free) plots two windowed correlations in a separate window. the size of window is taken as input before the two symbols to correlate to. Two symbols are taken as an input parameters as well as period length. and the two correlations are computed with the currently shown symbol ex: input GBPJPY and AUDNZD. current symbol EURUSD then the following will be computed corr(EURUSD,GBPJPY) and corr(EURUSD,AUDNZD) The indicator can be useful to run a multi-symbol pair trad
FREE

MA Slope is a simple indicator that measures the slope of a specific Moving Average. We usually say that the price is in an uptrend when it is above the moving average, or it is in a downtrend when it is below the moving average. However, this information is inadequate since most of the time the market is in range. During range-bound markets, price moves back and forth around the Moving Average giving a lot of false signals. MA Slope helps identify and validate trends as it directly measures t

Contact me after payment to send you the User-Manual PDF File. Volume Profile Indicator A functional and useful tool that can improve your trading plan.
This indicator calculates volume in price levels(typical volume indicator shows only candle volumes).
With the volume of price levels, you can identify important areas that have the potential to reverse. You can also see the volume of support and resistance levels and decide on them.
Using volume profiles along with Price Action and

Este indicador de informação será útil para quem quer estar sempre atento à situação atual da conta.
- Indicadores mais úteis O indicador exibe dados como lucro em pontos, porcentagem e moeda, bem como o spread do par atual e o tempo até o fechamento da barra no período atual. Existem várias opções para colocar a linha de informação no gráfico: À direita do preço (corre atrás do preço); Como comentário (no canto superior esquerdo do gráfico); No canto selecionado da tela. Também é possível
FREE
Tenha acesso automático aos dados do Yahoo Finance e crie símbolos personalizados no MetaTrader 5. Ao contrário dos indicadores ou Expert Advisors, este serviço não precisa ser executado em um gráfico. Ele funciona em segundo plano, atualizando constantemente os dados históricos dos mercados que seu corretor não oferece. Principais características: Dados de mercado exclusivos : Acesse instrumentos como VIX, DOLLARINDEX, T-Bond, SP500, NASDAQ100 e uma ampla gama de ETFs, como Vanguard Total Stock
Passo a passo "Trailing Stop"
O utilitário permite que você defina a etapa de movimentação do "Stop Loss" seguindo o preço ao usar a ferramenta "Trailing Stop". Ao contrário do "Trailing Stop" "regular" disponível no terminal "MetaTrader", que permite definir o movimento "Stop Loss" em incrementos de 1 pip, este "Trailing Stop" é configurado com qualquer incremento. Essa configuração permite evitar o fechamento de posições durante falsas reversões de tendência, quando o preço, após um longo mo
FREE

Cores geradas de acordo com o volume de negociações e direção do mercado.
As analise sao feitas seguindo a direção do preço e volume negociado se o valor negociado for superior a base de calculo o sistema muda a cor para verde, informando que a direção do preco e forte para compra, se o valor negociado for menor que a base de calculo o sistema muda para vermelho, indicando que o preço e forte para venda.
FREE

# 33% off - limited time only # ChartSync Pro MT5 is an indicator, designed for the MetaTrader 5 trading terminals. It enables the trader to perform better multi-timeframe technical analysis, by synchronizing symbols and objects into virtually unlimited charts. Built by traders for traders! Telegram Premium Support - Dd you purchase the Chart Sync indicator and need a bit of help? Send us a screenshot with your purchase and your Telegram ID so we can add you to our premium support Telegram g

Não compre antes de ver o produto Danko Trend Color , pois este painel é uma maneira de visualizar um resumo deste indicador em diversos timeframes.
O utilitário Danko DTC Panel permite você olhar a tendência em até 5 tempos gráficos. Ao clicar nos textos dos timeframes, uma nova janela se abrirá já com o indicador plotado na tela para você ver o gráfico completo. A largura do painel, com a quantidade de velas que deseja visualizar, é personalizável, veja nas imagens à seguir.
Ao clicar nos t

É um indicador utilizado para identificar pontos de suporte e resistência a partir da VWAP diária e é possível usá-lo para verificar os melhores pontos de entrada e saída de posição.
O valor calculado da distancia do canal pode ser calculado de varias formas:
- Manual Definindo o valor a ser projetado para calcular a distancia dos canais.
- Automatico Selecione o tempo grafico a ser utilizado. Independente do tempo grafico que esta na tela se for mudado o parametro para H1(

This indicators automatically draws the support and resistances levels (key levels) for you once you've dropped it on a chart. It reduces the hustle of drawing and redrawing these levels every time you analyse prices on a chart. With it, all you have to do is drop it on a chart, adjust the settings to your liking and let the indicator do the rest.
But wait, it gets better; the indicator is absolutely free! For more information: https://youtu.be/rTxbPOBu3nY For more free stuff visit: https
FREE

Facilita a visualização onde houve zonas de consolidação dos preços anteriores e permite que você destaque o histograma onde há a maior zona de consolidação .
Parâmetros de entrada
Intervalo de preço É o preço entre os histogramas
Periodo Quantidade de candle sticks a serem analisados
Porcentagem Destaca o histograma onde houver a consolidação mínima em relação ao período analisado
FREE

Boom and Crash Buy and Sell Trend. Non-repaint. Can be used on all timeframes 1 minute for scalpers. 5 minute to monthly timeframe for swing trading. works on all boom and crash pairs Crash300, Crash500, Crash1000. Boom300, Boom500, Boom1000. Green histogram colour means the trend is up(bullish) Buy signal. Dark orange histogram colour means the trend is down(bearish) Sell signal.

Strangely enough, everyone seems to have their own idea of how you should measure support and resistance. Not every support and resistance zone is strong. The strongest support or resistance levels will more often than not be with trend . What this means is, if we are in a bull trend, pullback levels to support will more often than not be ‘stronger‘ than resistance levels above. These expert advisors use several mathematical models and statistical models to determine the strongest support and r
FREE

TRAILINATOR is a unique Solution to use different Trailing-Stop Variants and change your settings via Remotecontrol. You configure your Trailing-Stop for a specified Symbol only once. This setting will be used for all your Positions of the same Symbol. Currently we support these different Trailing-Stops: Standard : works like you use in Metatrader Terminal, starts trailing if your profit is greater than trailing stop Start after points : trailing stop will start after your defined points in p
FREE
TRAILINATOR is a unique Solution to use different Trailing-Stop Variants and change your Tradesetup via Remotecontrol. You configure your Tradesetup for a specified Symbol only once. This setting will be used for all your Positions of the same Symbol. Currently we support these Features: different Trailing-Stops: Standard: works like you use in Metatrader Terminal, starts trailing if your profit is greater than trailing stop Start after points: trailing stop will start after your defined poin

Fundamentação teórica
A VWAP é uma média móvel ponderada pelo volume, trazendo maior relevância para os preços. O cálculo base da VWAP segue a fórmula clássica descrita no Investopedia ( https://www.investopedia.com/terms/v/vwap.asp ). VWAP = sum(typical price[i]*volume[i]) / sum(volume[i]) Funcionalidades
A VWAP Orion inova ao permitir que o usuário escolha dentre os convencionais períodos Diário, Semanal e Mensal, tendo também a opção de cálculo do indicador Intraday, como utilizado em out

O indicador Danko Trend Color é na verdade uma coloração de candles para trazer praticidade, facilidade e informação aos seus gráficos.
O Danko Trend Color combina indicadores de PREÇO E VOLUME para definir a tendência predominante, assim as cores são: Azul (indica tendência de alta)
Laranja (indica tendência de baixa)
Branco (indica indefinição de tendência)
Não gosto de prometer nada com meus indicadores, peço que baixem , testem grátis (para uso em backteste) e vejam se o indicador p
Hello;
This product generates buy and sell signals from the intersection of two moving averages. It uses all the capabilities of the moving averages. To generate a scalping strategy, a take profit level is determined after the signal level. To stop the loss, it uses the reverse signal. The system can increase the lot amount according to the fibonacci ratios after each loss .To disable this margintale feature, you will need to enter the low lot and high lot amounts the same. So you can work wi
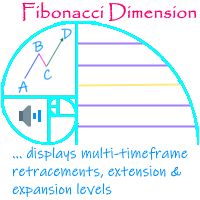
'Fibonacci Dimension' indicator allows display of preset or user-defined multi-timeframe Fibonacci levels. It automatically takes the previous high and low for two user-defined timeframes and calculates their Fibonacci retracement levels. It also considers the retraced level to draw the expansions on every change of price. A complete visual dimension in multiple timeframes allows deriving profitable strategies for execution. Enhanced functionality to view and customize the default Fibonacci Rang
FREE

https://www.youtube.com/watch?v=0T8Mge39Xsk&t=9s
Youtube
These EAs trade macd divergence only if there is a parabolic sar change at the same time. Sell bearish macd divergence & parabolic sar crosses above price Macd settings Threshhold is how far above / below zero divergence must occur. Timeframe used Parabolic sar settings
Only one trade in that direction can be opened at once. Trades on open bar Alerts , mt5 and mobile Stop loss and target points Stop loss is set to a % percentage of
FREE
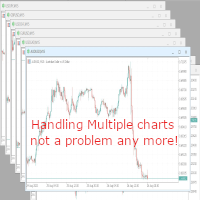
With this script you can open or close multiple charts with just one click. Please follow the instructions below; Set your desired symbols in the market watch window. Open one chart. Attach the script to the chart In the input values just select the time frame of your chart. Set open chart value to true. Click ok. To close the charts follow step 3 and 7. In input values set open chart value to false and close chart value to true
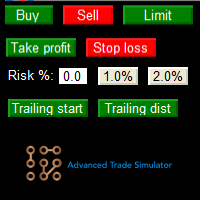
Advanced Trade Simulator for MT5
It is an indicator you can attach to any chart and then buy and sell the given symbol virtually. No actual trading takes place. You can attach it to multiple charts. Then you can buy multiple symbols.
A more detailed description here: https://www.mql5.com/en/blogs/post/750336 Features:
- buy and sell immediately on the given time frame - market , limit and stop orders - generalized OCO, more than 2 orders can cancel each other. - OSO, one sends another..
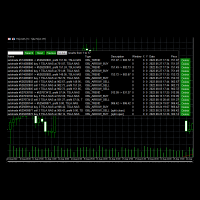
Use this software to browse through all objects within the chart and look at them comfortably. Also, you can look at the list of global variables and search and delete them . The same you can do with charts and indicators. You can search in objects names and object descriptions to find the object you are interested in. This is definitely an improvement to what is available in Mt5. You type what you are interested in , then press Search button. You can move to next and previous search results. N
FREE

V Band is a technical analysis tool that helps smooth out price action by filtering out the “noise” from random price fluctuations. It is calculated by taking the average of a market’s price over a set period of time.
It can be applied to stocks equity indices, commodities and Forex . V Bands is used to identify trends or support and resistance levels.
They can also be used to generate buy and sell signals.
Choose a trading style and start trading!

Fundamentação teórica A VWAP é uma média móvel ajustada pelo volume, ou seja, o peso de cada preço corresponde ao volume de ações negociadas no período, dando mais importância ao período em que se tenha mais negociações. A Orion Vwap Bands permite que o usuário use plote 8 bandas que podem ser utilizadas como suportes e resistências para o preço. Cada banda é calculada a partir da Vwap Tradicional:
Ex.: Se escolhermos o valor 0.25 para a plotagem da Banda 1, pega-se o preço da Vwap e acrescen
https://www.youtube.com/watch?v=0T8Mge39Xsk&t=9s
Youtube Sell only EA here.
These EAs trade macd divergence only if there is a parabolic sar change at the same time.
Buy bullish macd divergence & parabolic sar crosses below price Macd settings Threshhold is how far above / below zero divergence must occur. Timeframe used Parabolic sar settings
Only one trade in that direction can be opened at once. Trades on open bar Alerts , mt5 and mobile Stop loss and target points Stop loss is set

OPTMIZE EA BEFORE BACKTEST AND USE. United States Stock Market Index US500 trades the 5 minute charts. The EA uses RSI and Stochastics for entries and ATR for exits. The building period was From 2021-03-19 to 2022-08-18. Continually optimize the EA to find best settings and don't forget to account for spreads and slippage in optimization . The EA does not use martingale and has a sl and tp on each trade with a fixed lot input. Try it out in the back test, optimize for settings.
Risk Di
Você sabe por que o mercado MetaTrader é o melhor lugar para vender as estratégias de negociação e indicadores técnicos? Não há necessidade de propaganda ou software de proteção, muito menos problemas de pagamentos. Tudo é providenciado no mercado MetaTrader.
Você está perdendo oportunidades de negociação:
- Aplicativos de negociação gratuitos
- 8 000+ sinais para cópia
- Notícias econômicas para análise dos mercados financeiros
Registro
Login
Se você não tem uma conta, por favor registre-se
Para login e uso do site MQL5.com, você deve ativar o uso de cookies.
Ative esta opção no seu navegador, caso contrário você não poderá fazer login.