Nuevos robots comerciales e indicadores para MetaTrader 5 - 71
indicador para opciones binarias que siempre funciona en favor de la tendencia principal , por favor identifiquela en temporalidades altas para poder tomar operaciones en las temporalidades bajas , puede usar una media movil de cualquier periodo para identificarla , recomendada la de 50 periodos exponencial ideal para operar el mercado de indices sinteticos del broker deriv y/o divisas, se puede acompañar de cualquier oscilador usando unicamente el nivel 50 para validar tendencia alcista o baji

MASpeed es un promedio móvil universal, con indicación de velocidad de movimiento. Los puntos en la línea aparecen cuando el promedio se mueve más rápido que el umbral. El umbral se puede especificar en la configuración. Sobre la base de este indicador, puede construir una amplia variedad de estrategias comerciales. En el indicador hay enormes posibilidades de ajustar la media móvil - 10 tipos de suavizado. 12 opciones de precio para construir. Se agregó la capacidad de muestrear el movimiento r
FREE
Trade System Usted elige una barra en el día para negociar, cuando esta barra cierre el robot enviará dos órdenes una en el máximo y otra en el mínimo de la vela, la que obtiene de nuevo la otra será cancelada Stop Loss la parada será un tick por debajo del mínimo en el caso de la compra, o un tick por encima del máximo en el caso de la venta Obtención de beneficios La toma se puede establecer cuánto desea del rango del stopLoss, se puede personalizar en la optimización de la estrategia Optimiza
FREE

MT4: https://www.mql5.com/en/market/product/83443 Periodo de tiempo: M1 Pares de divisas: EURUSD, GBPUSD, USDCHF, EURGBP, USDCAD, AUDCAD. Pares de divisas de alto riesgo: CHFJPY, EURCHF, USDJPY, AUDCHF. Recomendaciones: Antes de usar Expert, asegúrese de ponerse en contacto con el autor para obtener ayuda con la instalación y las recomendaciones de intermediarios. Asegúrese de utilizar un VPS o un servidor con una latencia de red mínima para el servidor del corredor. Utilice un corr
Este indicador se basa en formas de ojiva. Tales formas se utilizan en aerodinámica y tecnología espacial. Incluso las balas tienen algún tipo de forma ojival. El uso de tales formularios en un indicador técnico permite lograr un compromiso entre la sensibilidad del indicador y su estabilidad. Eso da posibilidades adicionales en su aplicación. Parámetros del indicador: iType - el tipo de forma de ojiva. iPeriod - período indicador. iFactor es un parámetro adicional utilizado en formas par

Periodo de tiempo: M1 Pares de divisas: XAU/USD Gold Booster MT5 es un desarrollo innovador del comercio de oro frente al dólar. La estrategia utiliza niveles de soporte/resistencia. Cada operación está protegida por un stop loss y tiene un algoritmo de seguimiento adaptativo. Este Asesor Experto se basa en romper los niveles de soporte y resistencia más importantes, que determina, después de colocar órdenes pendientes detrás de ellos, con la ayuda de un algoritmo adaptativo especial.

Distancia Precio Promedio móvil
Este es un indicador que calcula en tiempo real la distancia del precio a la media móvil.
Con él puedes monitorear la desviación máxima del precio de la media móvil en un determinado período de tiempo elegido por ti, por ejemplo, monitorear la distancia según la desviación máxima de los últimos 30 días.
Es posible elegir el período y el tipo de media móvil.
Para hacerlo aún mejor, hemos agregado la posibilidad de dos niveles de alerta si el precio está
FREE

Nos complace presentarle el indicador de información "Info Trader".
Como nosotros mismos somos comerciantes, creamos software que utilizamos principalmente en nuestras propias prácticas comerciales. Durante el comercio intradiario de múltiples divisas, constantemente necesitábamos un panel de información "listo para usar".
Probablemente haya notado que es necesario tomar una decisión sobre la obtención de ganancias en la cuenta considerando las ganancias en múltiples instrumentos. Para hace
The Higher timeframe candle tracker is used to get a glimpse of what the selected higher time frame candle is like. It plot the candle after the current price. It can come in handy for day traders and short term traders that often worry about how the current higher timeframe candle may look like. You can select the higher time frame or lower time frame from the options provided: By default the color for bears is red and for bulls is green. You are able to change the width of the candle, its wick
FREE
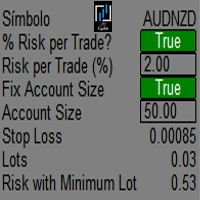
25 t4w56t41+39t13gsd8+ 15/*3t862q14+rs3 sae,+8bs3,t2-,/4 gad41 wW84141A*+,413+R4,W+2,4WZA+SCX,2C-Q/* ,/43-12QR*,WRSA 3*2Q3+3*,FA5SW6+SR F ,A+,234Q48F1W,+2A3Q /A- 5 FDXZ-3 4W4QRF-+AW,41GT-+4 1W+ RGA 52*T 2 -2W45,2T+, A,1G,+W9 2+ *A2DDF+-T53+ - T 5F+ 255 2 5F+ 8 5WRED S,-+ WW5 R2 5+S 5 2,
D 195 ,W/*A/3,4314*-+ AWF,W+,1348R*AW-43,32R4FA3, -*, W33,4 2F-AW3Q4,+RF,A4 +R2 3 134,+*F W,S4*+DC V,+* 2 3R4F+*A,4FS -+ 32,3T/R43, /-+32, 4+*1 2AFWAQ21, 4T/R AWESE* 2-, 44R2,+4W3F,S +*,54/421 *T,W/5 ,G 25,+*
FREE
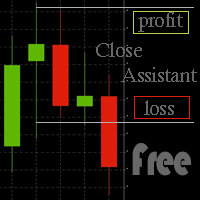
Asistente para cerrar automáticamente las posiciones abiertas según pérdidas o ganancias. El usuario puede seleccionar "Total Profit" para cerrar todas las posiciones al mismo tiempo, según la pérdida o ganancia total. El usuario puede seleccionar "Single Profit" para cerrar cada posición, según la pérdida o ganancia individual. Notas:
1. El programa no abre posiciones
2. El asistente ejecuta operaciones a mercado, por lo que en dependencia de la volatilidad el cierre de la posición puede su
FREE

Excellent tracking performance and minimal noise! This trend detection indicator that avoids whipsaws and uncertain market noise and is also agile enough to react to changes in trend.
It is also designed to adapt to dynamic markets.
Functions mainly as a filter to help you trade in the direction of the trend.
Features.
Simple and easy to use. Low load and easy to try out The excellent tracking performance and smooth lines that make it ideal for market analysis Can be used as a trend filter
FREE
This is a break even(BE)/break even-plus(BE+) EA. It moves your stop loss to BE or BE+ based on pre-set percentage of current TP. You can edit the percentage in the input section. This EA sets breakeven for both manually and auto-opened trades. Moving stop-loss to a breakeven or BE+ is popular among traders who wish to safeguard their trades and to let the trades run without incurring a risk of loss. With this EA , you can have your stop-loss orders moved to a breakeven point automat
It is a script that allows you to open all market watch symbols at one go having the current time frame of the opened chart. I have been looking for a script like this for a very long time when I first started trading. Finally figured out how to do it, so no more problem for those who are suffering like me. This is a blessing for me now hopefully for you too. Buy the script, if it does not work as shown full refund. DM me for any problems, this script is only for MT5 . instruction Are : 1 - Keep

DESCRIPCION GENERAL * Bot automático * Bot de uso exclusivo de la plataforma binary.com donde se podemos encontrar los Sintéticos * Mercado de Sintéticos recomendado Range Break 200 * Deposito mínimo para el Bot 1 000 USD CONFIGURACION * No cambiar los valores de las Bandas de Bollinguer * En el parámetro TP_of_SL poner 100 * El stop loss es automático *Temporalidad de vela recomendada 1 minuto Como recomendación si quieres usarlo con menos capital se sugiere que cambies el parámetro de mu
FREE
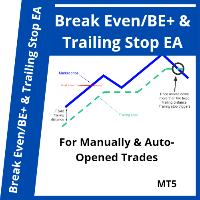
This is a dual function EA. It offers both trailing stop and break even(BE) or breakeven-plus(BE+) functions. This EA sets BE/BE+ and Trailing stops for both manually and auto-opened trades. To use only the BE/BE+ function of the EA, type in the number 3, under BlockID in inputs, when initializing the EA. To use only trailing stop, type in 2. Trailing stop is a more flexible variation of a normal exit order. T railing stop is the practice of moving the stop-loss level closer to the curre

Supported currency pairs: EURUSD,USDCAD, GBPUSD, EURGBP
Setting Lot -frist trading lot TakeProfit, in pips - t ake profit value Step between positions: Step between positions(Distance) Volume increase factor Max lot Author
I have an experience of more than 8 years in forex and gold trading, I started my career as a trader and now developing Expert Advisors to make trading process and trading fully automated I believe "if you can't make money while you sleep, you have to work fo

*OPTIMIZE BEFORE TEST AND USE* Sentient is the next evolution of of scalping and has all the angles covered. I tested it on XAU/USD. Optimize on the time frame assets you choose. I like XAU/USD.
Sentient has more points and indicators to it to create a cluster signal and there are many inputs to optimize. You can use the basic ones for the threshold or all of them.
Note: There are many steps and points. Optimizing longer than 1 month, would require much time and power. Forward opti

Volality 75 Fractal Scalper Non-repaint The arrows appear on the current candle. momentum and trend based strategy Works on all timeframes from the 1 Minute to the Monthly timeframe Bollinger bands have been added to show the trend direction whether its bullish or bearish Blue fractal arrow is your buy entry Orange fractal arrow is your sell entry you can use the Vix 75 fractal scalper in combination with other indicators.
The indicator plots the Up and Down arrows on every price swing made by the classic Zigzag indicator. When Zigzag makes a new swing low, a green arrow is plotted. Likewise, a red arrow is plotted when Zigzag makes a new swing high.
Features
Compared to the classic ZigZag, it marks the swing points more effectively. It helps to identify the forming chart patterns in advance. It comes with a Multi-Timeframe scanner which shows the Zigzag direction on each timeframe. All Metatrader alerts includ

This indicator shows the bullish/bearish market regime using the no. of bars moved above and below the overbought/oversold region of RSI. The green histogram depicts the Bull power, while the red depicts the Bear power.
Features
It can be used to enter new trades or validates trades from other strategies or indicators. It comes with a multi-timeframe scanner that scans the bulls/bears power across all the time frames. It's a perfect choice to boost the confidence of new traders via validatin
The indicator measures the buying and selling force between the buyers and sellers in the form of a histogram/oscillator by using a BOP equation:
BOP = Moving Average of [close – open)/(high – low)]
Igor Levshin first introduced the Balance of power in the August 2001 issue of Technical Analysis of Stocks & Commodities magazine.
Features
Quickly find the buying and selling pressure among the traders. It comes with simple inputs and an interface. All Metatrader alerts included.
Appli
SSL stands for Semaphore Signal Level channel. It consists of two moving averages applied to high and low, respectively, to form a price following envelope. Buy Signal: When the price closes above the higher moving average. Sell Signal: When the price closes below the lower moving average.
Features It comes with a multi-timeframe scanner that scans for the new signals across all the timeframes. A straightforward personal implementation of the classic SSL effortlessly finds the trend directio

Back to the Future это индикатор который определяет направление тренда. Определяет четыре уровня для роста и падения 1-й уровень флета 2 -й уровень коррекции 3-й уровень продолжения тренда и 4-й уровень возможного разворота. Индикатор рисует трендовые линии краткострочного и долгострочного тренда. Так же индикатор определяет динамические сел и бай зоны в виде прямоугольников. От ближайшего максимума или минимума рисует фибо уровни для определения целей движения. В меню индикатора отключа

It's a modified, and improved version of the classic HMA developed initially by Alan Hull in 2005. It uses a combination of three weighted moving averages to reduce the lag. Long Entry: When HMA turns blue from red with an upward slope. Short Entry: When HMA turns red from blue with a downward slope.
Features It comes with a multi-timeframe scanner which scans for the new signals across all the timeframes. HMA reduces lags which usually come with the traditional moving averages. Effectively

Trade with an edge by using the Trader Starter Kit. This powerful assistant was built to help all types of traders. It uses the T.A.E framework to analyze the chart in order to provide a filtered view of the market. T: Trend - Identified by checking for a series of higher highs and higher lows or lower highs and lower lows A: Area of value - Identified through a trading range calculation that obeys the rules of buy low and sell high E: Entry-trigger - Identified by analyzing candlesticks for var
FREE
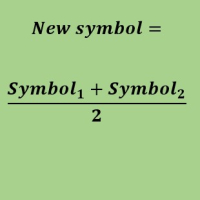
Create a new custom symbol based on average of Multiple arbitrary symbols (for MT5)
An Expert Advisor (EA) used to create custom symbol by averaging multiple input symbols (e.g. EURUSD and GBPUSD) and provide real-time updates. This is an MT4 "offline" chart equivalent which is very simple to use.
You can attach any MT5 compatible indicator or template to this new symbol and perform your technical analysis. You can back-test any EA on this new custom symbol in strategy tester. for example

Trend Panel es una herramienta simple y conveniente que mostrará una dirección de tendencia confirmada de los marcos de tiempo M1 - D1 utilizando diez pares elegidos por el usuario.
El indicador está diseñado para agregar confirmación de dirección en cualquier estrategia/plantilla y luego también funciona como una interfaz interactiva limpia para cambiar rápidamente el gráfico a un par o marco de tiempo diferente. Chat grupal: https://www.mql5.com/en/users/conorstephenson Por favor, póngase
FREE

Golden God utiliza el aprendizaje automático. Opere en el marco de tiempo XAUUSD 1 HR u otros marcos de tiempo operando el OHLC como la lógica. Fijar el riesgo de saldo en las entradas, 5% de morosidad. Controla los lotes máximos a tomar. Todas las operaciones tienen paradas y toma de ganancias. Este EA comercia activamente. Opere en una demostración y en vivo, ya que esto no se basa en indicadores. Pruébelo en tiempo real, no es como muchos EA que usan indicadores. Este EA no utiliza indicadore

The worktime indicator helps you identify the most important times to day to trade the currency pairs. It was created based on the ICT day trading free tutorials that are freely vailable on his youtube channel. You can use this indicator together with my other indicators that i have shared freely with you like the true day, custom periods, daily month, weekly open lines - they together complement each other very well.
Nuggets from this indicator: 1. Draws the asian session box showinng you th
FREE
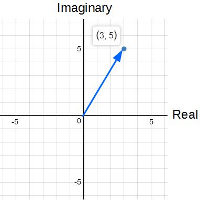
ComplexVector is an indicator based on market analysis using the mathematical apparatus of complex numbers. The essence of the indicator is that it, with clear impulses, indicates the points in time when it is necessary to make decisions. The impulses are like a cardiogram showing the heartbeat of the market.
For example: it may be the moment of planning a new entry. this may be the moment to exit the position. if you work with a series that is in a drawdown, you are recommended to close it i

Think of the Super Fractal Indicator as the Bill WIlliams Indicator on Steroids. Indicator Abilities: 1. Adjust Candle around Fractal High or Low. 2. Adjust Lookback period and only plot for a specific number of history candles avoiding cluttering your trading desk. 3. The Indicator uses buffers so you call and use it from any EA.
Note : The higher the candles around Fractal, the stronger the Turning point anfd viceversa is true.
FREE

The tool is intended to help traders who cannot look at the chart all the time, or who use several charts, the trader can mark regions of interest as supports and resistances and as soon as the price approaches these regions an audible warning and on the screen will be presented for the trader to take some action, in addition the tool can automatically mark the highs and lows of the day and time.
FREE

The ADX indicator (average directional index) is a technical tool designed to measure the strength of a market trend. The ADX indicator is used for various purposes such as measuring the strength of a trend, finding a trend and a trading range, and as a filter for various Forex trading strategies.
Some of the best trading strategies are based on following the market trend. There are also strategies through which traders make profit by trading against the trend. In any case, if you can identif

The Outside The Box (OTB) is a complete trading system that provides the user with immense trading ability by highlighting on the chart areas where the trader should prepare to Re-enter the trend after pullbacks (Pullback trading strategy) Take partial/complete profit(Profit taking strategy), and Trade breakouts (Stock breakout strategy) - We have updated the indicator to show/hide Micro breakout areas around the major breakouts (Micro Breakouts). The above is supported by an alert system to no

What is this indicator? This indicator plots a customized text object as a note at any point on the chart. To plot the text object, press the hotkey and then click at any point on the chart. You can also add your favorite words and sentences to the template and plot them.
How to stick a note 1. Press the hotkey to enter sticky mode. 2. Click any point to stick. 3. Edit the text of the text object plotted as a note.
About sticky mode
This mode is for plotting a text object as a note. If

What is this indicator? This indicator stamps any customized number at any point on the chart. To stamp any number, press the hotkey (0–9) and then click at any point on the chart. You can also stamp a series of numbers to indicate a chart pattern. (Each number synchronizes modification)
How to stamp any number
1. Press the hotkey (0–9) to enter stamping mode. 2. Click any point to stamp.
How to stamp a double top/bottom pattern 1. Press the hotkey to enter stamping mode. 2. Click any p

What is this indicator? This indicator draws a customized vertical, horizontal, or trend line at any position on the chart. To draw each line, press the hotkey and then click at any point on the chart. Each drawn line is synchronized with other charts by timeframe. (Each chart requires this indicator to be installed)
How to draw a vertical or horizontal line 1. Press the hotkey to enter drawing mode. 2. Move the mouse to any point. 3. Click to draw the line.
How to draw a trendline 1. Pr

What is this indicator? This indicator draws a customized Fibonacci retracement or expansion at any position on the chart. To draw the object, press the hotkey and then click at any point on the chart. Each anchor point magnets to the high or low price of the nearest bar on the chart.
How to draw
1. Press the hotkey to enter drawing mode. 2. Click any point to draw. 3. Drag and drop each anchor point to adjust if needed.
About drawing mode
This mode is for drawing a Fibonacci retracem

The purpose of the inidcator is to identify the reversal point.
The blue arrow is buy signal and the yellow star is its stop loss. The red arrow is sell signal and the yellow star is its stop loss. Please note that the singal is against trend,it could be continual fail. Alert feature: if there is a signal, the indicator will send alerts of popup window,email or mobile push. Inputs: Popup Window Alert: it is false in default Email Alert : it is false in default Mobile Push Alert: it is false in
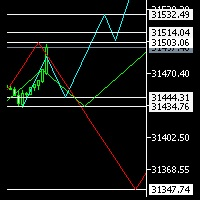
Hello Everyone ,
I am not an Elliot pro , but I promise to let you see it in a different way , have you ever considered to see 3 probabilities of different time frames on same chart ? this will not only enhance your trades entry , but will give you confidence and certainty when everything is not clear.
in my indicator you will be able to select 3 time frames of your choice , define number of candles per each time frame , give the color per each trend (Bearish or Bullish), not only that , yo
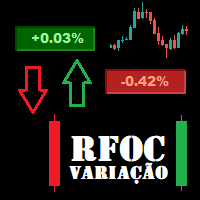
O Produto RFOC Variação Diária apresenta a função de indicar no gráfico a variação, em porcentagem, do preço em relação ao preço de fechamento do dia anterior.
O indicador permite configurar 100% da coloração para variações de alta, baixa e neutra (0.00%).
O painel com a apresentação da variação diária do preço fica fixada na parte superior do gráfico, e se ajusta automaticamente no centro da janela.
FREE

you don't have to monitor your trades all the time. save yourself screen time and leave management of your trades to Dynamic Trades Manager. Dynamic Trades Manager is a trading assistant tool. it has automated capabilities to break even, take partial profits, trails stops and to set your risk to reward ratio . it does not take trades on its own but only performs the aforementioned functions when the user has already conducted their analysis and opened a trade. this would save you the time of ha

Description: Protect your live or evaluation accounts by not letting it hit the maximum daily draw down! This utility is best for prop firms such as FTMO and MFF(MyForexFunds) and etc. Guide: Apply to EURUSD 1m Chart.
Default Settings: Maximum Draw Down Balance: 4% Account Balance. Maximum Draw Down Equity: 4% Account Balance Target Profit Balance: 1% Account Balance. Target Profit Equity: 1% Account Balance. Time To Reset: 16:57 to 16:58 GMT
Behavior: Setting starting_balance to 0 will au
FREE
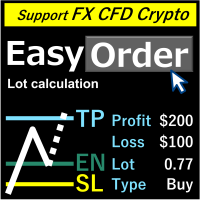
Visión general Simplemente mueva las líneas, el lote se calcula automáticamente al completar la cantidad de corte de pérdida. Se pueden calcular las siguientes ocho monedas (USD, EUR, GBP, JPY, AUD, NZD, CHF, NZD) Se puede seleccionar cantidad fija o relación de saldo. Calcule las recompensas de riesgo. El orden de mercado, el orden límite y el orden de parada se aplican automáticamente. Admite FX, CFD y Crypto Currency. Atención
La " Descargar demo gratis " no funciona. Puede descargar la ve
El objetivo principal de este experto comercial es realizar las funciones de un tope dinámico. No abre ni cierra posiciones, sino que solo establece y mueve los niveles de obtención de beneficios y stop loss. Para calcular Take Profit y Stop Loss se utilizan las estadísticas de movimiento de precios y la expectativa moral de D. Bernoulli. Debido a esto, los nuevos niveles establecidos por el experto brindan la mejor opción (de las posibles) en términos de relación riesgo/recompensa. Veamos los

Este asesor experto utiliza el indicador Trend Wave y puede identificar el comienzo y el final de un nuevo movimiento de tendencia de onda. Como oscilador, el indicador identifica las zonas de sobrecompra y sobreventa. Funciona muy bien para capturar las reversiones de precios a corto plazo y utiliza una estrategia de martingala para cerrar todas las operaciones con ganancias. ¡Use la configuración predeterminada en m15 o un marco de tiempo superior en cualquier par para operaciones más precisas

Los niveles de rango de pivote central se forman alrededor de un punto pivote central.
Estos niveles en relación con el pivote central se pueden utilizar para determinar numerosos comportamientos del mercado y posibles resultados.
La distancia desde el pivote central y el precio que forman los nuevos niveles en relación con los niveles del día anterior se pueden utilizar para determinar la dirección y la fuerza de la tendencia del día siguiente.
Los rangos de pivote central pueden actua
FREE

Niveles institucionales / Niveles bancarios ... Niveles psicológicos / Teoría de los trimestres.
Este indicador dibujará automáticamente en los niveles "000, 200, 500 y 800", lo que conozco como "Niveles institucionales", O también puede dibujar los niveles "000, 250, 500 y 750" en el gráfico.
Dependiendo de dónde haya aprendido el trading de niveles institucionales / la teoría de los trimestres, puede que los conozca con diferentes nombres, esencialmente la idea central es que estos nivel
FREE

Este indicador utiliza los llamados números "malvados" como coeficientes de peso. Su opuesto son los números "odiosos", que también se presentan en este indicador. La división de números en estas dos clases está asociada con el peso de Hamming, que está determinado por el número de unidades en la notación binaria de un número particular. El uso de estos números como factores de ponderación da como resultado un indicador de seguimiento de tendencias. Además, los números odiosos dan un indicador

OBTENGA OTROS EA GRATIS!!! OBTENGA OTROS EA GRATIS!!! OBTENGA OTROS EA GRATIS!!! OBTENGA OTROS EA GRATIS!!! OBTENGA OTROS EA GRATIS!!!
USD Scalper MT5 es un EA neuronal para pares de USD. Este producto está hecho para GBPUSD, EURUSD, AUDUSD, NZDUSD. Es posible que se agreguen nuevos PARES en el futuro.
PAREJAS ACTUALES:
GBP USD
EURUSD
AUDUSD
NZDUSD - SE AGREGARÁ EN LA PRÓXIMA VERSIÓN
ENTRADAS:
RIESGO PORCENTAJE DE RIESGO BASADO EN STOP LOSS (si se selecciona 1, el riesgo

WA_PV_BOX_EFFORT X RESULTADO para MT5 El indicador WAPV Box Effort x Result es parte del grupo de indicadores de paquetes (Wyckoff Academy Wave Market). El indicador WAPV Box Effort x Result para MT5 lo ayuda a leer el precio y el volumen. Su lectura consiste en auxiliar en la identificación esfuerzo x resultado en ondas creadas por el gráfico. El indicador de esfuerzo x resultado de la caja WAPV para MT5 cuando la caja es verde significa que el volumen está a favor de la demanda y cuando la caj

EA Goldlytic use a trend built-in indicator. It's specifically designed for trading the XAUUSD (GOLD) but can be used with other assets (forex, crypto...).
The Expert Advisor opens an order based on a signal from the indicators and fixes the profit at a certain level with the ability to open order basket For best results, it is recommended to cancel the direction of trade on the EA panel on the chart Since this is a trend-following Expert Advisor, we recommend disabling the Expert Advisor in

El indicador de precio y volumen WAPV para MT5 es parte del conjunto de herramientas (Wyckoff Academy Wave Market) y (Wyckoff Academy Price and Volume). El indicador de precio y volumen WAPV para MT5 se creó para facilitar la visualización del movimiento del volumen en el gráfico de forma intuitiva. Con ella podrás observar los momentos de pico de volumen y momentos en los que el mercado no tiene interés profesional Identificar momentos en los que el mercado se mueve por inercia y no por movimie

You can see Binance Futures data instantly in Metatrader 5 and it allows you to use all the features that Metatrader has provided to you.
You can access the data of all symbols listed on Binance Futures. Don't forget to set the timezone. Binance it's 00:00 UTC. You need to fix it according to your own country You need to pre-install the free Binance Future Symbol List plugin. https://www.mql5.com/tr/market/product/82891 After loading, it automatically downloads the data of the cryptos in the

El indicador de oferta y demanda de WAPV ADH es parte de un conjunto de indicadores llamado (Wyckoff Academy Wave Market) El indicador de oferta y demanda WAPV ADH para MT5 tiene como objetivo identificar el lado ganador entre compradores y vendedores . Su lectura es muy sencilla, cuando la línea verde está por encima de la línea roja manda la demanda , cuando la línea roja está por encima de la línea verde manda la oferta. Cuanto más positivas sean las líneas verde y roja, mayor será la entrada

El indicador de Forex de oferta y demanda WAPV ADH es parte de un conjunto de indicadores llamado (Wyckoff Academy Wave Market) El indicador de oferta y demanda de divisas WAPV ADH para MT5 tiene como objetivo identificar el lado ganador entre compradores y vendedores. Su lectura es muy sencilla, cuando la línea verde está por encima de la línea roja manda la demanda , cuando la línea roja está por encima de la línea verde manda la oferta . Cuanto más positivas sean las líneas verde y roja, mayo

El indicador lateral Weis Wave Bouble para MT5 es parte del conjunto de herramientas (Wyckoff Academy Wave Market) El indicador lateral Weis Wave Bouble para MT5 se creó en base al ya establecido Weis Wave creado por David Weis. El indicador Weis Wave Double Side lee el mercado en ondas como se hizo por R. Wyckoff en 1900. Ayuda a identificar esfuerzo x resultado, causa y efecto, oferta y demanda. Su diferencial es que se puede utilizar por debajo del eje cero, mejorando aún más más lectura del

El indicador lateral Weis Wave Bouble para MT5 es parte del conjunto de herramientas (Wyckoff Academy Wave Market) El indicador lateral Weis Wave Bouble para MT5 se creó en base al ya establecido Weis Wave creado por David Weis. El indicador Weis Wave Double Side lee el mercado en ondas como lo hizo R. Wyckoff en 1900. Ayuda a identificar esfuerzo x resultado, causa y efecto, oferta y demanda. Su diferencial es que se puede usar debajo del eje cero y tiene una alerta de ruptura que muestra Quien

VSA Candle Signal para MT5 es parte del conjunto de herramientas (Wyckoff Academy Price and Volume). Su función es identificar la correlación de Precio y Volumen en la formación de la vela. Su creación se basa en las premisas de R.Wyckoff , precursor en el análisis de Precio y Volumen. VSA Candle Signal para MT5 asiste en la toma de decisiones, dejando su lectura más clara y fluida. Vea las imágenes a continuación.

El indicador de fuerza y debilidad para el volumen real de MT5 es parte del conjunto de herramientas (Wyckoff Academy Price and Volume) El indicador de fuerza y debilidad para el volumen real de MT5 se desarrolló para identificar la fuerza y la debilidad del volumen de forma acumulada. Habilitando la visión de un panorama entre precio y volumen. El indicador se puede utilizar como oscilador y como histograma. Como fantasía tiene todas las premisas de las tres leyes de R. Wyckoff cuando se

El indicador de fuerza y debilidad para MT5 Forex es parte del kit de herramientas (Wyckoff Academy Price and Volume) El indicador de fuerza y debilidad para MT5 Forex fue desarrollado para identificar la fuerza y la debilidad del volumen de forma acumulada. Habilitando la visión de un panorama entre precio y volumen. El indicador se puede utilizar como oscilador y como histograma. Como de costumbre, tiene todas las premisas de las tres leyes de R. Wyckoff cuando se juntan con el precio: C

This indicator is very useful for day traders or short term traders. (MT5 version) No need to calculate the number of pips manually, just look at the chart and you will see the Virtual Take Profit / Virtual Stop Loss target line and evaluate whether the entry point is feasible to reach the intended target or not.
Enter the intended Take Profit / Stop Loss pips for your trade. The indicator will display Virtual Take Profit / Virtual Stop Loss lines for you to easily see if the target i
FREE

The indicator plots a trend channel using the technique by Gilbert Raff. The channel axis is a first-order regression. The upper and lower lines show the maximum distance the Close line had moved away from the axis line. Therefore, the upper and lower lines can be considered as resistance and support lines, respectively. A similar version of the indicator for the MT4 terminal
As a rule, most movements of the price occur within a channel, going beyond the support or resistance line only for a s
FREE

Very powerful indicator! converted from TradingView with upgraded alerts and added notifications. Ideal use in EAs.
Use as a supplementary Indicator to confirm your entries, but it is as good on it's own.
The indicator consists of 3 different Trend Meters and a 2 Trend Bars which are used to confirm trend
How to Use:
The more Trend meters are lit up the better =>>
-more GREEN COLOR at one bar means more confirmation to open buy trade,
- more RED COLOR signals for one bar = more

User Grid MT5 is a multifunctional grid Expert Advisor designed to fully or partially automate various ideas related to grid trading (on a hedging account) . The Expert Advisor can trade on any timeframe, on any currency pair, on several currency pairs, on any number of signs. It does not interfere with manual trading, trading of other Expert Advisors, or the operation of any indicators. It allows you to adjust your settings on the fly, works only with your own positions and orders. It has a
Tool converted from tradingview indicator. Modified version with pivot points calculated in a more intuitive way.
This tool displays relative volatility and directional trend. Excellent way to pickup diversions and reversals. Length can be lowered to 11 or 13 in settings to show price range.
Can be used to identify patterns such as parallel channels and likely direction of price action.

Adds the symbols listed in Binance Future to Metatrader5
With this free file, you can list the entire list right away. You can easily install it on your demo account It is the first file to be uploaded for Binance Future Tick and is offered for free.
Tools menu / Options / Expert Advisors / You need to select Use WebRequest for listed
You can watch videos to add metatrader
FREE

The idea of a Value Chart indicator was presented in the very good book I read back in 2020 , " Dynamic Trading Indicators: Winning with Value Charts and Price Action Profile ", from the authors Mark Helweg and David Stendahl. The idea is simple and the result is pure genius: Present candlestick Price analysis in a detrended way!
HOW TO READ THIS INDICATOR
Look for Overbought and Oversold levels. Of course, you will need to test the settings a lot to find the "correct" one for your approach.
FREE
1. Торговая стратегия Что делает советник: Советник следит за некотоными индикаторами и при определенном условии (или условиях) помещать торговый запрос (на продажу или покупку) в зависимости от условий. Стратегия:
Используем индикатор Moving Average (скользящие средние) с периодом 8 (вы можете выбрать любой период, но в данной стратегии мы будем использовать период 8). Советник покупает, если 8-периодная скользящая средняя (далее для удобства будем называть ее MA-8) возрастает и текущая цена з
FREE
MetaTrader Market es el mejor lugar para vender los robots comerciales e indicadores técnicos.
Sólo necesita escribir un programa demandado para la plataforma MetaTrader, presentarlo de forma bonita y poner una buena descripción. Le ayudaremos publicar su producto en el Servicio Market donde millones de usuarios de MetaTrader podrán comprarlo. Así que, encárguese sólo de sus asuntos profesionales- escribir los programas para el trading automático.
Está perdiendo oportunidades comerciales:
- Aplicaciones de trading gratuitas
- 8 000+ señales para copiar
- Noticias económicas para analizar los mercados financieros
Registro
Entrada
Si no tiene cuenta de usuario, regístrese
Para iniciar sesión y usar el sitio web MQL5.com es necesario permitir el uso de Сookies.
Por favor, active este ajuste en su navegador, de lo contrario, no podrá iniciar sesión.