Conheça o Mercado MQL5 no YouTube, assista aos vídeos tutoriais
Como comprar um robô de negociação ou indicador?
Execute seu EA na
hospedagem virtual
hospedagem virtual
Teste indicadores/robôs de negociação antes de comprá-los
Quer ganhar dinheiro no Mercado?
Como apresentar um produto para o consumidor final?
Pagamento de Indicadores Técnicos para MetaTrader 5 - 52
On this occasion I am pleased to present the (Boom 300 Professional Pack) where it consists of 4 indicators for the Boom 300 index of synthetic indices (Deriv Broker) Acquiring this indicator enables you the pack of the 4 boom 300 indicators where the rest of the indicators will be sent, This indicator is 1 of the 4 that includes the Buy/Sell strategy, sending you clear alerts where there buy or sell the pair It is recommended to use in a period of 15 minutes, to have a greater profit since the
Professional Pack Crash 300 Indicators, On this occasion I present the trend indicator that is for the crash index 300 (Deriv Broker) The indicator consists of a strategy where trends are caught in periods of 15 minutes, very clearly the indicator shows the purchase marking the tip of red until the trend develops, and then mark the green point of purchase, it is very simple to use, It is recommended to use in that temporality since it serves to catch longer trends and increase profit, the indica
Channel Stochastic Boom 1000 I am pleased to present the pack (Tendence Boom 1000) where on this occasion I present the Channel Stochastic Boom 1000 indicator for (Deriv Broker) where is 1 of the 4 indicators that the pack brings! The indicator consists of the sthochastic strategy, where it reaches the point of (0 Level) the purchase is made, taking advantage of hunting spike, where it reaches the point of (90 Level) the sale is made taking advantage of the trend candles! It is used in 1 minute
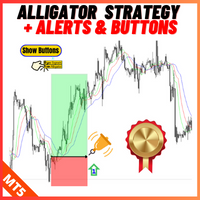
Description: For a comprehensive understanding of our indicators, we invite you to explore the entire Q&A section within this MQL5 blog post here . The Alligator Cross Strategy with Alert and Button is an effective technical analysis tool designed to assist traders in identifying potential entry and exit points with enhanced trading. Based on the popular Alligator Indicator, this tool brings an added layer of convenience with real-time alerts and trading buttons for seamless execution. Key F
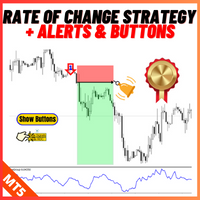
Description: For a comprehensive understanding of our indicators, we invite you to explore the entire Q&A section within this MQL5 blog post here . The Rate Of Change Cross Strategy with Alert Indicator is a valuable tool for traders seeking to identify potential trend reversals and capitalize on market opportunities. Based on the Rate of Change (ROC) indicator, this tool provides clear and timely buy or sell signals, helping traders make informed decisions in their trading endeavors. Key Fe
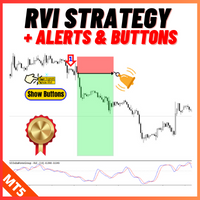
Description: For a comprehensive understanding of our indicators, we invite you to explore the entire Q&A section within this MQL5 blog post here . The RVI Cross Strategy with Alert and Button Indicator is a powerful technical analysis tool designed to help traders identify potential trend changes and seize opportunities in the financial markets. Utilizing the Relative Vigor Index (RVI) indicator, this tool offers precise and timely buy/sell signals, enabling traders to make well-informed tradi
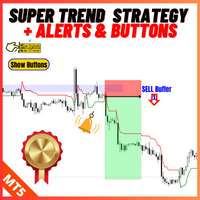
Description: For a comprehensive understanding of our indicators, we invite you to explore the entire Q&A section within this MQL5 blog post here . The Super Trend Line Strategy with Alert Indicator is a versatile technical analysis tool designed to help traders with valuable insights into market trends and potential entry and exit points. By effectively capturing trend movements, this indicator helps traders make informed trading decisions across various financial markets. Key Features: - S

The Fisher Transform is a technical indicator created by John F. Ehlers that converts prices into a Gaussian normal distribution. The indicator highlights when prices have moved to an extreme, based on recent prices. This may help in spotting turning points in the price of an asset. It also helps show the trend and isolate the price waves within a trend. The Fisher Transform is a technical indicator that normalizes asset prices, thus making turning points in price clearer. Takeaways Turning poi

"Advanced Daily VWAP with Standard Deviation and Trading Bands" Description: "The 'Advanced Daily VWAP with Standard Deviation and Trading Bands' indicator offers a comprehensive view for traders who wish to make the Volume Weighted Average Price (VWAP) the crux of their trading strategy. It not only calculates the VWAP on a daily basis but also incorporates standard deviation to give an accurate representation of market volatility. The trading bands are calculated using a 1.5% multiplier for th

Description: The CCI Arrow Indicator is a powerful trading tool designed to offer clear buy and sell signals based on the Commodity Channel Index (CCI). Buffer 0 signifies the buy signal, while Buffer 1 represents the sell signal, providing a straightforward visual representation of market conditions. Users can easily install and apply the indicator to their MetaTrader platform, where arrows indicate potential entry and exit points, aiding in informed trading decisions. A green arrow (Buffer 0)

Probability-Based Indicator This indicator analyses price movements of a given period to obtain crucial information for probability distribution analysis such as their mean and standard deviation, Once it has such piece of information it does all the necessary calculations and finally calculates the probability that the current market value will go above or below the given period bars. Since this indicator effectively leverages the power of probability which doesn't lie, It is a powerful indicat
O indicador Palantir prevê uma reversão de preço pelo número de pontos especificados pelo usuário nas configurações. Você seleciona o tamanho da tendência de seu interesse e o indicador irá prever com que probabilidade o preço se moverá na direção oposta ao número especificado de pontos do extremo mais próximo.
O funcionamento do indicador baseia-se no cálculo estatístico de tendências históricas. Palantir analisa tendências históricas com o tamanho especificado nas configurações, coleta estat

The ChanLun or Chan theory is one of the most popular trading theories in China. But it seems like that it has little influence in western countries. Actually, the Chan Theory is based on a sophisticated mathematical model. The basic idea ChanLun is to simplify the bar chart by its model. With the help of ChanLun, a trader can analyze and predict the trend of future goods, stocks.
In ChanLun, there are several basic elements called fractals, strokes, line segments and pivots . A trader should pa

Canal King of Dragon, Indicador King of Dragon, Sistema King of Dragon, King of Dragon MT5, indicador clássico King of Dragon, sistema de passagem King of Dragon, Rei do Dragão Tudo em Um
O sistema de negociação de canal King of Dragon, que é um sistema de negociação de canal clássico, muitos usuários solicitam fortemente a versão MT5. Este programa foi otimizado para desempenho em várias versões e já é um sistema relativamente suave. 49$ → 59$ Área vermelha, tendência longa, apenas longa, não

*This is trading view indicator converted in mql5*
The HA Market Bias Indicator is a popular tool used in trading and technical analysis, designed to help traders identify market bias and potential trend reversals. It is commonly used in conjunction with candlestick charts and provides valuable insights into market sentiment. The indicator is based on the Heiken Ashi (HA) candlestick charting technique, which aims to filter out market noise and provide a smoother representation of price action.

The Breaker Blocks with Signals indicator aims to highlight a complete methodology based on breaker blocks. Breakout signals between the price and breaker blocks are highlighted and premium/discount swing levels are included to provide potential take profit/stop loss levels.
This script also includes alerts for each signal highlighted.
SETTINGS
Breaker Blocks
Length: Sensitivity of the detected swings used to construct breaker blocks. Higher values will return longer term break
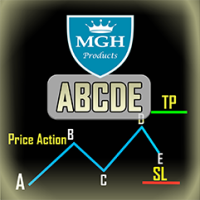
Indicador ABCDE
Este indicador é baseado nos padrões primários de abc da ação do preço (ou seja, quebra, retorno, movimento). Esses padrões se assemelham ao padrão de rali-base-rally, e um conjunto de análises, como análise de tendência e análise de divergência, são verificados para emitir um sinal preciso. Ele fornecerá sinais de negociação bastante precisos e dirá quando é melhor abrir e fechar uma negociação. Pode ser aplicado a qualquer ativo financeiro: forex, criptomoedas, metais, ações,
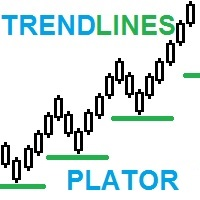
TrendPlator: Um Poderoso Indicador de Projeção de Tendência para Estratégias de Negociação Otimizadas Descubra o poder do nosso novo indicador! Com a capacidade de calcular linhas de tendência de timeframes maiores e projetá-las diretamente no seu timeframe atual, ele proporciona um suporte estratégico que atrai a atenção de todos os traders. Esses pontos se tornam poderosos níveis de suporte ou resistência para suas operações, impulsionando sua estratégia de negociação. Imagine ter acesso a um
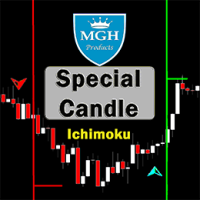
Vela Especial
Você gostaria de usar um dos melhores indicadores de câmbio baseado na estratégia Ichimoku, que é muito bem sucedida? Você pode usar um ótimo indicador baseado na estratégia Ichimoku.
A versão MT4 está disponível aqui.
Primeira estratégia:
Esta estratégia inclui identificar intersecções semelhantes e raras e poderosas.
Os horários mais adequados para esta estratégia são 30 minutos (30M) e 1 hora (H1).
Os símbolos adequados para o gráfico de 30 minutos são:
• CAD/JPY
• CHF/JPY
• U

-- BEST SWING --
L'indicateur BEST SWING est un indicateur technique personnalisé, un excellent outil pour négocier les cassures en fonction des niveaux de support et de résistance horizontaux. L'indicateur BEST SWING utilise une formule complexe en analysant des données de prix autrement incongrues sur les cours de clôture de chaque période, ainsi que les hauts et les bas du prix, afin de donner un aperçu de la force ou de la faiblesse de la tendance du marché et de sa probabilité

O indicador Trading Hours desenha os quadros que representam as horas de abertura e fechamento da bolsa concreta em um gráfico. Entradas: O parâmetro de entrada `Mudança de fuso horário UTC` define a mudança de fuso horário do usuário do UTC, Os outros parâmetros são usados para mostrar ou ocultar os quadros ou definir a cor. Características: Desenha os quadros que representam as horas de abertura e fechamento da troca concreta em um gráfico, Mostra/oculta quadros para a troca selecionada, Defi

Um Book de Ofertas visual é uma ferramenta poderosa utilizada no mercado financeiro para fornecer uma visão detalhada das ordens de compra e venda em um determinado instrumento financeiro em tempo real. Essa representação visual permite aos operadores observar a liquidez disponível no mercado, identificar os níveis de oferta e demanda em diferentes preços e acompanhar a evolução das ordens conforme elas são inseridas, modificadas ou retiradas. Ao analisar o Book de Ofertas visual, os operadores
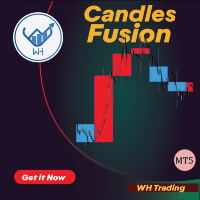
O Candles Fusion é um poderoso indicador MT5 que aprimora sua análise de negociação, exibindo velas de período de tempo mais alto no período de tempo atual.
Esse recurso exclusivo fornece aos traders uma visão abrangente da ação do preço em diferentes prazos, permitindo que eles tomem decisões comerciais mais informadas.
Características:
Sobreposição de vários períodos de tempo. Seleção de prazo personalizável. Visualização clara. Atualizações em tempo real. Interface amigável.
O Can

Boom Scalper Gold It is an indicator, programmed to scalp in a timeframe of 1/5 and 15 Minutes, perfect for hunting spikes and trend sails, where in the parameters of (70) it sends you a sale/sell alert and in the level parameter (8) it sends you a buy signal It is used for indices (BOOM) of synthetic indices (Deriv) It's easy and simple to use, it does all the work by sending you the alerts! the indicator during this period will remain on SALE! Without further ado, enjoy! Good profit. World Inv
Crash Scalper Gold It is an indicator, where it marks points of purchase and points of sale As the name says, it is used to scalp in the pairs of (Crash) 1000/500/300 where it sends you signals of sale/Sell and purchase/Buy at level points (90) he sends you the sell signal, (Spike) at the level point (27) it sends you the buy signal, (Trend Candles) It is very simple and easy to use. to make the best tickets possible! For this period it will remain on sale! Without further ado, enjoy! Good profi

Introducing the Power Trade Plus indicator designed by a small group of traders with a few years of experience trading the market profitably. The Power Trade Plus is derived from the Power Trade indicator, the indicator strive in powerful sniper entries and take profit levels, with an algorithm that's can determine the markets volatility and Provides entries based on the current market volatility. This indicator is much more effective in stock ,currencies and indices.

The "AI Forecast" indicator is the result of a unique experiment in which I asked an AI how to create the best indicator to anticipate the market. The AI suggested measuring the past history of the price and its reactions to different levels, and then calculating the probabilities of the price reaction in the future.
With this idea, I designed with the help of another AI the "AI Forecast" indicator, which adapts to any MetaTrader chart and shows you three lines: one for entry and two for possi
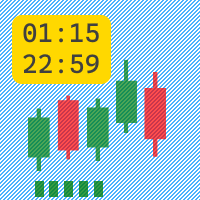
The Active Session indicator displays an active trading session in the form of green candles in a separate window.
Indicator parameters:
Monday = true/false - trade on Monday if the parameter is true.
Tuesday = true/false - trade on Tuesday if the parameter is true.
Wednesday = true/false - trade on Wednesday if the parameter is true.
Thursday = true/false - trade on Thursday if the parameter is true.
Friday = true/false - trade on Friday if the parameter is true.
StartHour - start o
Xau/Usd Scalper It is a unique indicator where it counts the low/high to make buy and sell entries! where you mark the entries with arrows next to the lows and highs used in m15/H1 to make longer and more valuable entries It is very simple and easy to use It also works for forex pairs and synthetic indices! Without further ado, enjoy! good profit World Investor!!
Step Scalper , It is an indicator with alerts, where it sends you buy and sell alerts accompanied by a moving average of 21 periods It is very easy and simple to use. where on the path of the green period marks the purchase of the asset , and the path of the red period marks the sale of the asset, It is used for scalping on M5/M15 but it is also recommended use it in periods of 1 hour since it captures the buying or selling trend, to get more profit! no more to enjoy good profit World Investor!

Indicator show best signals for buy and sell orders. Indicator uses only 2 inputs: DEMA Fast Period - fast double exponential moving average period DEMA Slow Period - slow double exponential moving average period Crossings of fast and slow double double exponential moving averages shows buy and sell signals, which are drawn as green and magenta arrows respectively.

https://youtu.be/JJanqcNzLGM , https://youtu.be/l70MIHaQQa4 , https://youtu.be/pg0oiT5_8y0 Automated Supply and Demand Trading Edge MT5. These videos demonstrate how we apply the supply and demand system to our latest trading review and market analysis
Enhance your Trading Strategy with the Supply and Demand Trading Edge MT5. Gain a competitive market advantage with the Supply and Demand Trading Edge MT5 indicator, a powerful tool that combines MACD signals with supply and demand zones. By

Indicator show best signals for buy and sell orders. Indicator uses only 3 inputs: DEMA Fast Period - fast double exponential moving average period DEMA Slow Period - slow double exponential moving average period DEMA Trend Period - trend double exponential moving average period
Position of price according to trend double double exponential moving average and crossings of fast and slow double double exponential moving averages shows buy and sell signals, which are drawn as gre

Indicator show best signals for buy and sell orders. Indicator uses only 2 inputs: PEMA Bounce Period - bounce percentage exponential moving average period PEMA Confirm Period - confirm percentage exponential moving average period Positions of price according to bounce and confirm percentage exponential moving averages and directions of bounce and confirm percentage exponential moving average shows buy and sell signals, which are drawn as green and magenta arrows respecti
Volumen del especulador Es un indicador que captura la fuerza del volumen de compra y venta. donde es muy fácil de usar, mostrándote la fuerza alcista y la fuerza bajista. En este gráfico está el claro ejemplo de cómo se utiliza, en el par VOLATILITY 75 donde esta la tea verde junto con la flecha que indica la compra, y ahí está la vela roja con la flecha marcando la venta del par, los parámetros a utilizar son Volumen : 5 Tiempo : 1000 para que capte toda la tendencia y se note mejor cuando co
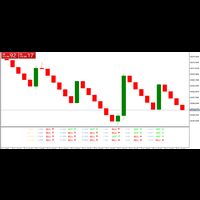
ZZA TRADE ASSISTANT This ZAA trade assistant indicator is very powerful. Here you can use this as your trading assistant . So while applying this use money management . This indicator can be use on 5 minutes timeframe, 15 minutes timeframe, 1 hour minutes timeframe and above . Try practice this on your demo account before using on real account . This indicator should apply on meta trader 5 .

The "RMA Signal Indicator MT5" refers to an indicator called "RMA" (Running Moving Average) Signal Indicator designed specifically for the MetaTrader 5 (MT5) trading platform. The RMA is a variation of the Moving Average indicator that emphasizes recent price data. The specific details and functionality of the "RMA Signal Indicator MT5" may depend on the developer or the version you are using. However, in general, here is a general approach to using a signal indicator like RMA on the MT5 platfor
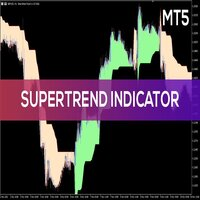
The "Super Trend Alert MT5" is an indicator designed for the MetaTrader 5 (MT5) trading platform. The specific details and functionality of this indicator may depend on the version or settings you are using. The Super Trend indicator is a popular technical analysis tool that helps identify the direction of the current market trend. It is displayed as a line on the price chart and is accompanied by alerts to notify traders of potential trend changes. To use the "Super Trend Alert MT5" indicator i
Automated Supply and Demand Tracker MT5. The following videos demonstrate how we use the system for trade setups and analysis.US PPI, Fed Interest Rates, and FOMC Trade Setup Time Lapse: U.S. dollar(DXY) and Australian dollar vs U.S. dollar(AUD/USD) https://youtu.be/XVJqdEWfv6s The EUR/USD Trade Setup time lapse 8/6/23. https://youtu.be/UDrBAbOqkMY . US 500 Cash Trade Setup time lapse 8/6/23 https://youtu.be/jpQ6h9qjVcU . https://youtu.be/JJanqcNzLGM , https://youtu.be/MnuStQGjMyg,  ;
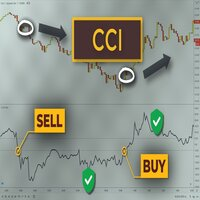
CCI Indicator Super is based on Pending Position strategy ( PPS ) and a very advanced secretive trading algorithm. The strategy of CCI Indicator Super is a combination of a secretive custom indicator, Trendlines, Support & Resistance levels ( Price Action ) and most important secretive trading algorithm mentioned above. DON'T BUY AN EA WITHOUT ANY REAL MONEY TEST OF MORE THAN 3 MONTHS, IT TOOK ME MORE THAN 100 WEEKS(MORE THAN 2 YEARS) TO TEST BONNITTA EA ON REAL MONEY AND SEE THE RESULT
The Volume Change indicator displays in a separate window the change in volume and the direction of price movement in the form of a line.
Indicator parameters: VolumeTimeframe - timeframe on which the indicator takes data. VolumeApplied - volume type: Tick volume/Real volume. VolumePeriod - period of the moving average on the VolumeTimeframe, against which the volume change is calculated.
This indicator can be used to build a trading system based on tracking price movements wit
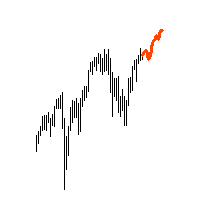
"AV Forecast MT5" is a preview or forecast indicator for MetaTrader 5, which draws forecast future price changes on the chart based on historical data. To do this, it primarily uses the everyday rhythm and the seasonality of the year. For timeframes below H1 closer dates can be selected. The lines for calculation can be made visible.
Settings:
- Draw line for x candles: draw x candles in the future
- Show all lines: yes/no
- Look back years or mixed (> H1 same): one year back or less beneath

The Point Trend Point indicator was created on the basis of the original indicators for searching for extreme points, the indicator is well suited for determining a reversal or a large sharp jerk to one side, thanks to it you will know when this happens, it will notify you with the appearance of a blue dot to buy red to sell. This is a fundamental technical indicator that allows you to assess the current market situation in order to enter the market of the selected currency pair in a trend and w

"Piranha" - an autonomous trading system that determines overbought and oversold levels on the chart. Red and blue zones represent overbought and oversold levels respectively. Entry points are marked with arrows: a downward arrow in the red zone for "sell" and an upward arrow in the blue zone for "buy". The Take profit level is indicated by the green moving average. Key features: Adjusting the Take profit level as the green moving average changes position. Averaging ability when a new market e

Victory Channel is a forex trend arrow indicator for identifying potential entry points. I like it, first of all, because it has a simple mechanism of work, adaptation to all time periods and trading tactics. Created on the basis of a regression channel with filters. We display the signals of the Victory Channel indicator on the chart of the price function using a mathematical approach.
How it works - when the price breaks through the overbought/oversold zone (channel levels), a buy or sell si

The MultiTimeframe Volume Zones Indicator is a powerful tool designed to provide traders with comprehensive insights into market dynamics. It combines several essential features, including volume analysis, Dow Zones, buy and sell arrows, candle timer, and market movement across different time frames. This all-in-one indicator equips traders with valuable information to make informed trading decisions. Key Features: Volume Analysis: Gain a deep understanding of market sentiment and strength by an

To get access to MT4 version please click here . This is the exact conversion from TradingView: "ZLSMA - Zero Lag LSMA" by "veryfid". The screenshot shows similar results from tradingview and Metatrader when tested on ICMarkets on both platforms. This is a light-load processing indicator. This is a non-repaint indicator. Buffers are available for processing in EAs. All input fields are available. You can message in private chat for further changes you need. Thanks for downloading
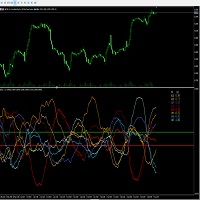
The qualitative indicator calculates the difference between USD, EUR, GBP, AUD, JPY, CHF, NZD, CAD currency pairs. The calculation is carried out online; it calculates supply and demand among themselves in various bundles. The display can be observed in two modes: general for all eight pairs and also specifically for the selected pair. An important indicator of the indicator is the zero axis, which indicates the general trend of currencies and their advantage relative to each other. The indicato
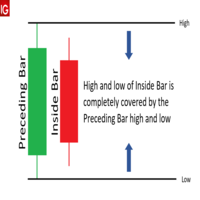
The Inside bar indicator can detect where inside bars occur in the charts and will change the color of the candle based on user inputs. Please note that the color can differ based on the current color of the candle due to supposition of the colors. Here are the characteristics of an inside bar pattern: High: The high of the bearish candle is lower than the high of the previous bullish candle. Low: The low of the bearish candle is higher than the low of the previous bullish candle. Body: The bo
Market screener: Price, Spread and Swap, for selected Symbols (Market Watch) You can customize the list: set only the Symbols (currency pairs) that are needed. The number of Symbols is unlimited. The list can be sorted in ascending or descending order (Symbol name). The panel can be moved to any place on the chart. You can also minimize the panel. There is an option to notify about the increased spread size compared to the average value. My #1 Utility : includes 65+ functions | Contact me

"Dragon's Tail" is an integrated trading system, not just an indicator. This system analyzes each candle on a minute-by-minute basis, which is particularly effective in high market volatility conditions. The "Dragon's Tail" system identifies key market moments referred to as "bull and bear battles". Based on these "battles", the system gives trade direction recommendations. In the case of an arrow appearing on the chart, this signals the possibility of opening two trades in the indicated directi
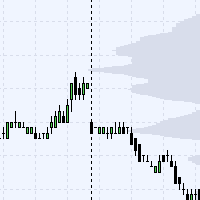
This indicator is showing level's density prices on background's graph.
Theses levels are showing the prices that are the most traded by the market. This means that these levels can be used in order to place stoploss or takeprofit for swing orders, or for scalping manually in short time periods. This gives a statistical advantage as these levels are more likelely to be reached or pullbacked by the market. It is also usefull on VIX for example to determine when to enter local low volatility.
Th

This indicator builds upon the previously posted Nadaraya-Watson Estimator. Here we have created an envelope indicator based on kernel smoothing with integrated alerts from crosses between the price and envelope extremities. Unlike the Nadaraya-Watson Estimator, this indicator follows a contrarian methodology. Please note that the indicator is subject to repainting. The triangle labels are designed so that the indicator remains useful in real-time applications.
Settings
Window Size: Determin

The indicator detects the beginning of a new trend not directly, but by comparing two forecast values based on the available history. Its action is based on the assumption that the predicted (historically normal) price and the real price differ due to the appearance of "new" force (unbalanced impact on the market), which usually leads to a significant market correction in an unstable market. The indicator does not track market stability, so it is recommended to use other methods to control vol
The indicator is a gold mine that works with the MACDI strategy with alert supported by AI
it working on gold 5m time frame with 92% win
the stratige take 15 pip tp and 15 stop 1:1
follow us on telegram :
t.me/tuq98
youtube :
youtube.com/ssfx1
green color its buy with alert
red color its sell with alert
this indicator is one from top 10 in greece
and one from top 5 in iraq

Trend in Channel is not an ordinary forex channel. This corridor is built on the basis of the analysis of several candles, starting from the last one, as a result of which the extremums of the studied interval are determined. It is they who create the channel lines. It, like all channels, has a middle line as well as a high and low line. This channel is worth attention because of its unusual behavior. The use of the Trend in Channel indicator allows the trader to respond in time to the price go
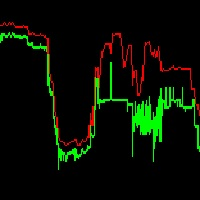
It is super imporant to know what the spread is on your charts!
This indicator displays the Ask High of the past bars, similar to that of the backtester. This allows you to see the spread of bars in real time.
The spread of the bar is the ask-bid price. The spread of a bar is the minimum spread of any ticks found within that bar. I hope this makes sense.
If you have any questions or feedback, let me know - thank you.

This is one of my preferred indicators where it plots on the chart Railroad Track candles, i.e. candles that have similar size. It is a very good indicator for trend direction. In the settings there is an option for Max candle size and Min candle size and also for the percentage for the tolerance between the Min and Max candle size. The candles values are calculated for High and Low. Have fun and enjoy trading! P.S. Please send me a message or leave a comment with any suggestions or improvements

XP Speed Meter the best indicator that measures the price/tick’s currency speed for you. It will give you the ability to know when the pair moving fast or slow . So, you can trade or not trade. It’s very important tool for scalper traders – news traders. Even for trend traders it will be useful to know if the market is trending fast or slow . XP Speed Meter is better than the volume type indicators of course. Because it shows the currency speed on the run-time without any lacking like what the v
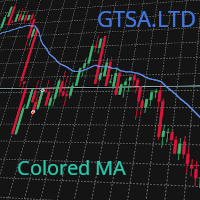
NOTE: Please don't forget to give us some stars, and keep following our work, there are more tools we are going to release. A simple colored MA that you can include in your EA for ease of reading/viewing, you can specify the line color and width during OnInit() and include it in your projects with ease, to include it just use iCustom instead of iMA:
int MyCustomMA; MyCustomMA = iCustom ( Symbol (), PERIOD_CURRENT , "Market/GTSA Colored MA" , 5 , 0 , MODE_SMA , clrCornflowerBlue , 2 , PRICE_CLOSE

With Fixed Range Volume Profile,The traces left by the big players will not go unnoticed by you.
Professional Volume Profile Indicator reveals Institutional order flow. This advanced market indicator will teach you to spot the buying and selling. Dont want to say more because its well known by most professionals trader. This Indicator : - Quickly Identify the Strongest Institutional S/R Zones. - W orks with all Trading Instruments (Forex, Futures, Indexes, Commodities, Stocks, Cryptocurr

This will find a possible reverse area and show entry signal and this strategy is using every candle and calculate them
buyer should us e with other indicators to get the best trade entry like Macd , RSI , or EMA . SMA.
Make sure try demo first it will supprise you all because how good it is
i hope you guy enjoy it but my coding is not good, so i cant code any EA for this , my own strategy
O Draw smart money concepts and Price Action assistent foi criado para auxiliar os traders que utilizam o SMC como base de suas operações de compra e venda.
Com o Assistent você terá as opções de desenhar: - Orderblocks de compra e venda, indicando apenas o candle de referência; - Fair Value Gaps, apenas indicando os 2 Candle de referência; - Indicar melhores regiões de compra e venda após indicado o movimento de referência (60 a 80% do fibonacci); - Desenhar a ilustração da estrutura do
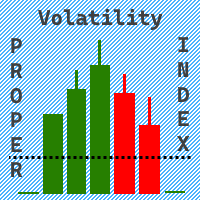
The Volatility Proper Index indicator displays the volatility index of a trading symbol in a separate window.
To calculate volatility, the calculation of price deviations from the moving average is used.
Indicator parameters:
Period - the number of recent bars for which the volatility index is calculated.
MinThreshold - the minimum price deviation from the moving average, at which this deviation is taken into account in the calculations.
AveragePeriod - moving average period, default =

The Riko Trend indicator is a revolutionary trend trading and filtering solution with all the important features of a trend tool built into one tool! The Riko Trend indicator is good for any trader, suitable for any trader for both forex and binary options. You don’t need to configure anything, everything is perfected by time and experience, it works great during a flat and in a trend.
The Riko Trend indicator is a technical analysis tool for financial markets that reflects the current price f

O indicador mostra os pontos de entrada e saída mais adequados. Também apresenta dados estatísticos sobre todos os sinais para uma melhor análise da negociação.
Com a ajuda deste indicador, será capaz de compreender melhor o mercado.
Assim que a força da tendência começar a enfraquecer (isto será mostrado no painel), a linha de tendência gravitará para a posição horizontal - este é o sinal para sair da transação. Ou pode sair quando o nível de lucro médio/mediano for atingido.
O indicador foi
The FCPI indicator or Forex Currency Power Index indicator is a multi currency pairs indicator that displays 28 pairs on 1 chart, which consists of 8 Major Pairs and 20 Cross pairs. 8 Major Pairs dan 20 Cross pairs: EURUSD,GBPUSD,AUDUSD,NZDUSD,USDCAD,USDCHF,USDJPY,EURGBP,EURAUD,EURNZD,EURCAD,EURCHF,EURJPY,GBPAUD, GBPNZD,GBPCAD,GBPCHF,GBPJPY,AUDNZD,AUDCAD,AUDCHF,AUDJPY,NZDCAD,NZDCHF,NZDJPY,CADCHF,CADJPY,CHFJPY. Automatically detects symbols that have a symbol prefix and/or a symbol suffix.
The

To test the adviser, do you open a separate account for each of them? this is very inconvenient, but thanks to this indicator, this is no longer a problem!
Do not be too lazy to read the full description and do not close the page ahead of time, this indicator is needed by almost every trader, no matter if he trades with his hands or uses advisors.
Buying this indicator as a gift you will receive an adviser with not bad results.. if you have already received a gift from me from other purch

Super Trend Plus is a trading system that uses four Supertrends set with different parameters. The idea behind this system is that when three Supertrends move in the same direction, there is a strong trend confirmation, but entry occurs only when the fourth Supertrend also moves in the same direction as the other three. For example, the first Supertrend could be used with a volatility multiplier of 3 and a period of 10, the second Supertrend with a volatility multiplier of 3 and a period of 12,

To get access to MT4 version please click here . This is the exact conversion from TradingView: "RedK_Supply/Demand Volume Viewer v3.0" by "RedKTrader" This is a light-load processing and non-repaint indicator. All input options are available. Buffers are available for processing in EAs. You can message in private chat for further changes you need. Thanks for downloading
Saiba como comprar um robô de negociação na AppStore do MetaTrader, a loja de aplicativos para a plataforma MetaTrader.
O Sistema de Pagamento MQL5.community permite transações através WebMoney, PayPay, ePayments e sistemas de pagamento populares. Nós recomendamos que você teste o robô de negociação antes de comprá-lo para uma melhor experiência como cliente.
Você está perdendo oportunidades de negociação:
- Aplicativos de negociação gratuitos
- 8 000+ sinais para cópia
- Notícias econômicas para análise dos mercados financeiros
Registro
Login
Se você não tem uma conta, por favor registre-se
Para login e uso do site MQL5.com, você deve ativar o uso de cookies.
Ative esta opção no seu navegador, caso contrário você não poderá fazer login.