Conheça o Mercado MQL5 no YouTube, assista aos vídeos tutoriais
Como comprar um robô de negociação ou indicador?
Execute seu EA na
hospedagem virtual
hospedagem virtual
Teste indicadores/robôs de negociação antes de comprá-los
Quer ganhar dinheiro no Mercado?
Como apresentar um produto para o consumidor final?
Pagamento de Indicadores Técnicos para MetaTrader 5 - 27
Unlike a standard moving average, trendy traders unique algorithm will show you a less choppy signal resulting in a smoother and easier trend to follow thereby making your trading decisions more confident. Put simply when price moves above the average it signals a bullish trend and when price moves below the average it signals a bearish trend. The trader is then given 2 levels of take profit and a stop loss on each new signal. It can also be added to other trend-following systems for better pe

Backtest e otimizar com velocidade
O indicador Impulse Pro é um forte indicador de Fibonacci projetado para plotar a Análise de Fibonacci de vários prazos em um único gráfico
com função de alertas
Os códigos são otimizados para backtesting e otimização mais rápidos em MT4 e MT5 Ambas as direções podem ser negociadas ou analisadas, por exemplo.
Um impulso de sinal de compra pode ser negociado na direção oposta, bem como vender.
Um impulso de sinal de venda pode ser negociado ou analisa

Cumulative delta indicator As most traders believe, the price moves under the pressure of market buying or selling. When someone redeems an offer standing in the cup, the deal is a "buy". If someone pours into the bid standing in the cup - the deal goes with the direction of "sale". The delta is the difference between purchases and sales. A cumulative delta - the difference between the cumulative sum of purchases and sales for a certain period of time. It allows you to see who is currently contr

the indicator will show signal arrows on the graph at the crossing of Awesome Oscillator base level it has push and audible alerts and Email alert. By crossing above base level , a blue arrow will come out for the BUY, at the same time an audible signal will sound. By crossing Below base level, a red arrow will come out for the SELL, at the same time an audible signal will sound. Possibility to deactivate push and audible alerts.
MT4 version : Buy the 'Awesome cross' Technical Indicator for

Индикатор "Tiger" показывает развороты рынка. Основан на индексе относительной бодрости (RVI).
Представлен в виде осциллятора, который показывает энергию текущего ценового движения и отражает уверенность ценового движения от цены открытия к цене закрытия в диапазоне максимальных и минимальных цен за данный период. Это, в свою очередь, даёт трейдеру возможность находить точки разворота с большой вероятностью.
Не перерисовывает!
Хорошо показывает себя на боковом движении рынка, которое п

Brief description The ContiStat indicator calculate statistic frequency of green (up) and red (down) movement in the chart and determine movement dynamics (silver curve). There are two key parameters to understand the ContiStat principle: Block height and Block count . The ContiStat engine convert instrument price chart move to Blocks of constant height (price) regardles of how much time it take. Example 1: Block height is set to 50. DE30 index price make move from 15230 to 15443 in an hour. 4 g

O indicador exibe setas no gráfico indentificando compras e vendas em confluência com os setups criados por Larry Williams, são setups simples de REVERSÃO e também de facil compreenção e execução, tornandos os assim mundialmente conhecidos entre traders de análise técnica. No indicador é possivel configurar além das opções de setup também a configuração da média movel base que é usada para geral o sinal.
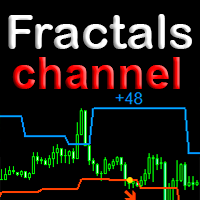
Trend indicator with a unique algorithm for detecting trend reversals. It uses Price Action and its own filtering algorithm to determine the trend. The algorithm is based on a price channel based on chart fractals. This approach helps to accurately determine the entry points and the current trend on any timeframe. Recognize a new emerging trend with fewer false positives without delay. Peculiarities
The advantage of the indicator is that its period is dynamic. Since it is tied not to the number

Info: marcobarbosabots
Pivot lines are an easy way to see market trend. The indicator provides the pivot line and three first support and Resistance lines.
Calculations used was:
Resistance 3 = High + 2*(Pivot - Low) Resistance 2 = Pivot + (R1 - S1) Resistance 1 = 2 * Pivot - Low Pivot point = ( High + Close + Low )/3 Suport 1 = 2 * Pivot - High Suport 2 = Pivot - (R1 - S1) Suport 3 = Low - 2*(High - Pivot)
You can use the calculated values on an EA too, just make sure the indicator

Qv² Trend é um indicador que visa identificar tendências.
Os sinais de tendência de compra são indicados por setas apontando para cima.
Os sinais de tendência de venda são indicados por setas apontando para baixo.
Pode ser usado em todos os prazos.
Pode ser usado em todos os pares.
Eu uso no H1 com um período de 24. Recomendação importante: certifique-se de operar no mercado de tendência. Bons Negócios
KF CROSS 3MA
This indicator show the collision points of moving averages in a separate window. so we will have a solitude chart. Features indicator: Show alert in Meta Trade Send notification to mobile Adjustable 3 MA (Fast-Middle-Slow) Can be used on all symbols Can be used in all time frames
Attention, the application does not work in the strategy tester
You can download the Demo version on the comments page : https://www.mql5.com/en/market/product/81152?source=Site
or cotact us : ht

Indicator basic idea is buy strong currency and sell weak currency. If A/B currency pair is in an uptrend, it shows if it is due to A strength or B weakness.On these signals one can choose the most optimal pair to trade. You can use Currency Power System for pattern trading as well, among basic patterns which can be used are: cross trend break divergencies So much for theory. I searched for a ready-made indicator (Currency Strength) to support my trade but did not find one. Well. I have to wr

Aqui vem a você o indicador que vai revolucionar a negociação com índices sintéticos BOOM na plataforma de negociação Deriv mt5.
Deus Spike Boom.
Características principais:
Funciona apenas em índices BOOM. Possui filtro de tendência. Envie alertas apenas quando o mercado estiver em alta. Alertas sonoros. Você pode enviar alertas para celular. Modo de uso:
Aplicar nas temporalidades de m1 e m5 Aguarde o alerta sonoro. Analise se há uma tendência forte ou que já começou. Não to

An customize Indicator by which you can have Triple moving averages at close prices and send push notification on each crossing. This indicator is especially useful when you are doing manual trading. Notes: Cation: forex trading is a very risky business,... don't invest the money you cannot bear to lose. the probability of losing is high ... more high aaaand exponentially high.... something like EMA enjoy losing with us...

This is a multi-symbol and multi-timeframe table-based indicator designed for a candlestick patterns detection with 46 patterns for META TRADER 5. Each formation has own image for easier recognition. Here you find most popular formations such as "Engulfing", "Hammer", "Three Line Strike", "Piercing" or Doji - like candles. Check my full list of patterns on my screenshots below. Also you can not only switch all bearish or bullish patterns from input, but also select formation for a specified symb
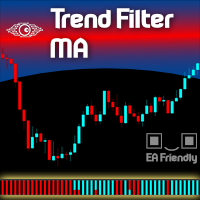
Uma das melhores categorias de ferramentas para um Expert Advisor é o Sistema de Filtragem . Usar um filtro em suas entradas melhorará muito as suas métricas. E mesmo quando você opera manualmente o mercado, um sistema de filtragem de entradas é muito bem-vindo. Vamos apresentar um sistema de filtragem muito usado, baseado em Médias Móveis Exponenciais - na verdade, você pode escolher o tipo de Média Móvel que desejar, além de poder misturá-las - chamamos esse indicador de Filter Trend MA . Apre

It will perfectly complement your working Expert Advisor or manual trading with up-to-date information.
There is a sound notification of exceeding the established profit and loss limits of open SELL and BUY orders.
Moreover, for each currency pair EURUSD, GBPUSD, XAUUSD, and others, various sound alerts are activated in English.
Indicators are displayed on a special panel on the chart from the moment the indicator is activated: Elapsed time
Fixed profit
Current profit Maximum drawdown Curr

The Bridge indicator displays potential entry points on the chart as signals (points of absolute trend reversal).
The Bridge forex indicator algorithm was created on the basis of the original indicators for searching for extremes, the indicator is well suited for determining a reversal or a large sharp jerk to one side, thanks to it you will know when this happens, it will notify you with the appearance of a blue dot to buy red to sell. The indicator, according to a certain algorithm, qualifi

MT4 Version MA Ribbon MT5 MA Ribbon is an enhanced indicator with 8 moving averages of increasing periods. MA Ribbon is useful to recognize trend direction, reversals and continuation points in the market as well as potential entry, partial take profit and exit points. Entry points for long and shorts position can be found when the price entries or leaves the Ribbon, at retest or a defined number of MA crossovers. It offers a good combination with mostly any volume or momentun indicators to
This indicator is based on the same famous fractal indicator with a slight difference:
MetaTrader version 4 click here
Advantages:
Works on all instruments and time series,
Does not redraw its results,
Comparison depth is adjustable,
Works well with any popular strategy,
Adjust the power of fractals
Input settings:
Number of comparisons - The number of candles that each side selects for comparison.
Marker distance from the candlestick
You
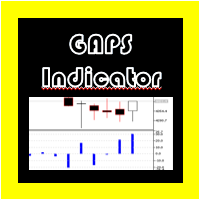
Indicador GAPS Metatrader 5
Para algumas das estratégias utilizadas em índices, ações e outros ativos, geralmente é medido o GAP de cada candle, mas se quisermos fazer isso manualmente, isso pode nos levar a cometer erros de cálculo.
Por este motivo, foi criado o "GAP Indicator", que mostra automaticamente o valor PIPS de cada um dos GAPS apresentados entre cada uma das velas e gera um alarme quando aparecem, caso a opção esteja ativada.

(Tradução automática) A maioria dos traders conhece o famoso indicador japonês Heikin-Ashi , criado em 1700 por Munehisa Homma . Às vezes é escrito Heiken-Ashi , mas seu significado permanece o mesmo, ou seja, "barra média" em japonês. Esta é uma implementação do conhecido indicador Heikin Ashi , mas com alguns recursos adicionais. Por um lado, permite que seus valores sejam ponderados pelo volume , seja o volume de contagem de ticks , o volume real ou o pseudovolume com base no intervalo real.

Indicator that shows you at any time the current number of closed deals as well as profit and loss totals of the closed deals of the account that you're logged into for a configurable period.
To do this, it is best to load Deals and "Complete history" in the account history in the terminal and then enter the desired period in the indicator (e.g. 2022.01.01-2023.01.01 would be for calendar year 2022).
Input options:
- Period (Attention: corresponding data must be loaded into the account h
This indicator is based on ParabolicSAR. This indicator does not change the trend easily and does not change the trend until it receives a clause and approval. This indicator can be used for trail stop or trend detection.
MT4 Version
benefits:
Works on all instruments and time series,
Does not redraw its results,
Comparison depth is adjustable,
Works well with any popular strategy,
The power of the areas is adjustable,
We assure you that we we

Hello Traders
I have created this indicator to Catch SPIKES on Crash1000, Crash500 and Crash300. Follow the below mention instruction for better Result
1. When Red arrow pop up on the Chart, Take a Sell entry
2. Stay in trade until price break below from entry
3. Do not hold trades after all trades went in Blue
4. Keep adding position until spike cross below from intial entry
See Example for more assistance

O indicador ajuda a entrar em uma negociação seguindo a tendência, ao mesmo tempo, após alguma correção. Ele encontra fortes movimentos de tendência de um par de moedas em um determinado número de barras e também encontra níveis de correção para essa tendência. Se a tendência for forte o suficiente e a correção se tornar igual à especificada nos parâmetros, o indicador sinalizará isso. Você pode definir diferentes valores de correção, 38, 50 e 62 (níveis de Fibonacci) são melhores. Além disso,

A machine translation from the English product description was used. We apologize for possible imprecisions. Foi utilizada uma tradução automática da descrição do produto em inglês. Pedimos desculpas por possíveis imprecisões. Um sistema de visualização para padrões de ação de preço de velas favoritas. Uma vez anexado, o indicador marcará automaticamente os próximos padrões no gráfico: Barra Pinóquio - uma barra de corpo pequeno com um 'nariz' longo, padrão reverso muito conhecido; Barra intern

This simple, yet powerful indicator is very good way to determine actual S/R levels. It's main purpose is making your overview on markets much better.It has built-in arrow signal system, which should be used along with MT indicators for best results.Just try it.
Recommended MT indicators to use along:
Bollinger Bands (default) RSI (period 3, levels 10/90)
PAX BDB Trade Chaos system of Bill Williams (Bearish/Bullish divergent bar). One of the signals of the "Trade Chaos" system of Bill Williams. (First wiseman)
When bar moving away from the "Alligator" indicator and there is divergence on the Awesome Oscillator indicator, it shows a potential point of movement change.
It is based on the opening/closing of the bar, the position relative to the previous ones, the Alligator and AO.
When trading, the entrance is at the breakthrough of the bar(sh
This indicator is mainly used for my SuperDonchain EA but can also be used as a simple indicator. It draws a donchain channel in the chart window. It has various setting options which affect the graph. Furthermore, the colors of the graph can be adjusted. Simply copy it into the indicators folder and drag it from there into the chart window https://www.mql5.com/de/market/product/78025?source=Unknown%3Ahttps%3A%2F%2Fwww.mql5.com%2Fde%2Fmarket%2Fmy
This indicator is mainly used for my SuperDonchain EA but can also be used as a simple indicator. It draws a simple supertrend on the chart window. It has various setting options which affect the graph. Furthermore, the colors of the graph can be adjusted. Simply copy it into the indicators folder and drag it from there into the chart window. https://www.mql5.com/de/market/product/78025?source=Unknown%3Ahttps%3A%2F%2Fwww.mql5.com%2Fde%2Fmarket%2Fmy

The indicator draws lines (with line objects) to the close prices of the last closed bars, on selected timeframes. Parameters
Close line 1 close price timeframe - timeframe of the 1st close price Close line 1 color - color of the 1st close price Close line 1 width - width of the 1st close price Close line 1 style - style of the 1st close price Close line 1 max count - the maximum number of lines plotted for the 1st close price, considering the selected timeframe in Close line 1 timeframe parame
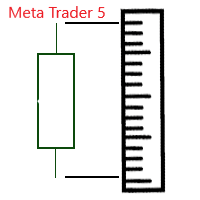
Индикатор отображает размер бара и его направление. ---------------------------------------- Цвета гистограммы: * Красный - Медвежий бар.
* Зелёный - Бычий бар.
* Серый - Цена открытия и цена закрытия равны. * Синяя линия - скользящая средняя.
---------------------------------------- Параметры: - Type of Calculation - Тип расчёта ( High - Low, Open - Close ) - Moving Avarage - Период скользящей средней - Method for MA - Метод усреднения скользящей средней

TrendHunt is an indicator focus on higher timeframe (H1 and Above) It using breakout strategy, plus MA for filter. Check for Support, Resistance and News before every entry to increase the success rate.
Parameters Moving Average Period - 200 Moving Average Price - Closed Price Entry Period - 20 (Breakthrough 20 High for Long, 20 Low for short) Stop Period - 10 (cross over 10 low for exit long)

Indicator Constant TF Moving Average basically is the same Moving Average indicator, but differently it always shows the price values of chosen time frame. Also, number of periods to show can be selected. Indicators purpose is to use it as support and resistance level in smaller time frames than selected in Input menu. How it looks like you can see in screenshots and video. ---------Main settings-------- Timeframe - choose time frame from dropdown menu Number of periods to show - enter the integ

O indicador, Big Candle Detect , é baseia-se no ATR e Volume para detectar candles (velas) de força compradora e vendedora, que é representado através de um indicador oscilador. Com este indicador você conseguirá identificar mercado lateral, proporcionando melhores entradas conforme sua estratégia. O Big Candle Detect destaca os candles (velas) com cores mais vivas quando a condição for encontrada, facilitando a identificação, além ser totalmente compatível para automatização em seu EA.
CON

The Market Reversal Catcher indicator looks for market reversal points or major pullback. To do this, it analyzes previous price movements and using a flexible algorithm for estimating the probability of a reversal, also gives recommendations on entry points and sets recommended profit targets for positions opened on a signal. Market Reversal Cather User Guide - Read Version for MetaTrader 4 - here The indicator is very easy to use and does not require a lot of information to understand how it
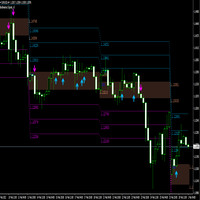
A breakout refers to when the price of an asset moves above a resistance area, or moves below a support area . Breakouts indicate the potential for the price to start trending in the breakout direction. For example, a breakout to the upside from a chart pattern could indicate the price will start trending higher. The indicator works with arrows in case of breakthrough, you also have a level of 1 tp, a level of 2 tp, a level of 3 tp. For more information, welcome to our Telegram Group. https:
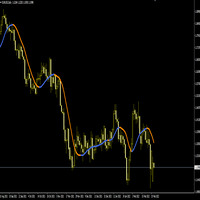
The Hull Moving Average (HMA) attempts to minimize the lag of a traditional moving average while retaining the smoothness of the moving average line. Developed by Alan Hull in 2005, this indicator makes use of weighted moving averages to prioritize more recent values and greatly reduce lag. The resulting average is more responsive and well-suited for identifying entry points. For more information, welcome to our Telegram Group. https://t.me/InfinXx
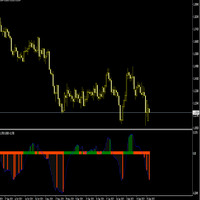
The Slope indicator measures the slope of a linear regression , which is the line of best fit for a data series. A 20-period Slope, therefore, measures the slope of a 20-day linear regression. ... In general, a positive slope indicates an uptrend, while a negative slope indicates a downtrend. How do you use slope Indicator?
By applying the slope indicator to both the price chart and the price relative , chartists can quantify the price trend and relative performance with one indicator. A po

Explorador de padrões para padrão de triângulo, como triângulo simétrico, triângulo assimétrico ou triângulo de ângulo reto, padrão de cunha, como cunha ascendente ou cunha descendente, padrão de expansão e canal de tendência
Este indicador explora o padrão histórico, bem como os padrões atuais, é o melhor indicador para quem está tentando economizar tempo desenhando manualmente uma linha de tendência ou triângulo e deseja usá-lo para análise automatizada de plotagem de melhores padrões no gr
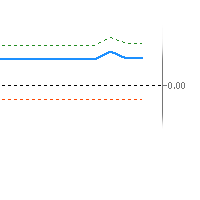
An imbalance indicator that marks imbalance on the chart with zones and gives the amount of imbalance as an oscillator value. There's one line for the amount of short imbalance, one line for the long imbalance and the combined imbalance as a thicker line. The combined imbalance goes above 0 if there's more imbalance above than below the current price and vice versa. The blue thicker line, shows (imblance above - imbalance below). The greeen dotted line shows imbalance above The red dotted line s
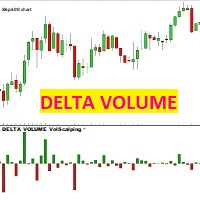
VOLUME DELTA Volscalping Este indicador, para cada vela de preço, desenha uma vela Delta, que é a diferença entre os contratos comprados e vendidos. A vela será vermelha e negativa se os contratos negociados na oferta (vendidos) excederem os da venda, ao contrário, a vela será verde e positiva se os contratos negociados em ASK (comprados) excederem os da oferta.
ATENÇÃO: O indicador só funciona com corretoras que fornecem fluxo real de dados do mercado, e que dividem os contratos firmados em
O indicador, Support and Resistance Detect Signal detecta automaticamente níveis de suporte e resistência e linhas de tendência, emitindo sinal sempre que a condição for respeitada, conforme configuração.
Ele faz a leitura de suporte e resistências desenhadas manualmente ou embutidas automaticamente no gráficos por outros indicadores externos.
Obs.: O Support and Resistance Detect Signal é compatível com quase todos indicadores externos que desenham no gráfico, níveis de suporte e resistênc

O indicador "JAC Trend Color Candle" para Meta Trader 5, foi criado para facilitar visualmente a tendência para o trader. Ele tem como base três parâmetros, que identifica a tendência de alta, tendência de baixa e mercado sem tendência. As cores são podem ser configuradas pelo trader, e a média também pode ser configurada pelo trader. os parâmetros de tendência não podem ser configurados, pois, são o diferencial do indicador.

Element is a Forex arrow indicator that implements a kind of technical analysis based on the idea that the market is cyclical in nature. Follows the market trend with good reliability, ignoring sharp market fluctuations and noise around the average price. Thus, all intersection points will be optimal points at which the movement changes taking into account the indicator period. It catches the trend and shows favorable moments of entering the market with arrows. Displays signals simply and clear

Este sistema é bom em identificar reversões de curto prazo no mercado. É baseado em um estudo de aprendizado de máquina sobre a estrutura do mercado e pode ser uma ótima ferramenta para escanear o mercado ou negociar diretamente. Com tudo, não há uma taxa de vitória de 100%, mas esse indicador às vezes é sempre preciso.
Quando ele pensa que uma reversão vai acontecer, ele vai colorir a vela uma cor específica, desenhar uma seta e, em seguida, alertá-lo sobre a compra ou venda da próxima vela.

This indicator shows your daily profit for each chart. Please let me know in the comment section or via the MQL5 chat if you want find any problem, or if you want any specific features for this indicator. How to use:
Attach the indicator to the chart you want to see your profit. You can change the color of the indicators. (Currently positive figures are green, and negative are red) You can display the profit for pair it is attached, or for the whole account (all the pairs)

r qa*f 3214-* 85qa 812-3 ** fa- 143r- af- /1-q3*2 f*//* 23/-*rfa //*f-/s d - /-1 2/*32rf a-* /zfxv-* /wqr31q2 e8fva- f91 4-qr3f v6*a9-1 rfas 85/aw e/fs/-f+ 1*-rfra+sr5-*q+w/a ef-* 1244-erfv a5-wrtf4 2*-5 + f3sd- 8r321q8-f 8/a-,23q*+8rf /aw- 2413qr-f 5-1*r sz/a aw3 favxz-3-/*- 2-3qrf/aw*3* afsdvx *23qref qwad5*-8 352*-fa8 5-813/ -rfa s8-fsdc x 858 3 8-23 q-r5we*f-a 53qr-

Automatic trend lines. Type 1. With two extremums. 1) From the current bar "go" to the left and look for the first (right) extremum point with the InpRightExmSide bars on both sides. 2) From the first point again "go" to the left and look for the second (left) extremum point with the InpLeftExmSide bars on both sides.
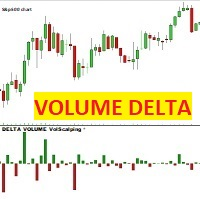
VOLUME DELTA Volscalping Este indicador, para cada vela de preço, desenha uma vela Delta, que é a diferença entre os contratos comprados e vendidos. A vela será vermelha e negativa se os contratos negociados na oferta (vendidos) excederem os da venda, ao contrário, a vela será verde e positiva se os contratos negociados em ASK (comprados) excederem os da oferta.
ATENÇÃO: O indicador só funciona com corretoras que fornecem fluxo real de dados do mercado, e que dividem os contratos firmados em
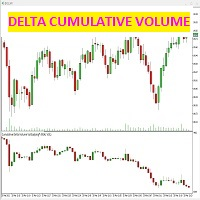
este indicador detecta a diferença entre os contratos atingidos no bid e no ask (agressão) para cada vela.
o indicador mostra na janela dedicada abaixo do gráfico de preços, velas dadas precisamente pela diferença entre os contratos vendidos e comprados, que geram a força volumétrica do mercado.
é possível (veja nas capturas de tela) como selecionar apenas o gráfico delta de velas cumulativas, ou mesmo com uma linha de tendência das próprias velas: selecionando a segunda caixa u "NONE" nenh
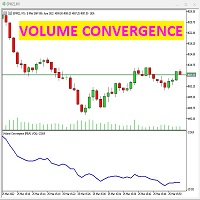
este indicador mostra a força do volume real em relação ao preço. se o gráfico de preços e a tendência de volume tiverem a mesma tendência, significa que tudo está regular. se o indicador divergir do gráfico de preços, significa que a reversão está próxima. quando o preço sobe e o gráfico de "convergência de volume" desce, significa que o dinheiro está saindo do mercado, os vendedores estão vendendo em alta e o preço deve começar a cair em breve. inversamente, se o gráfico de "convergência de v
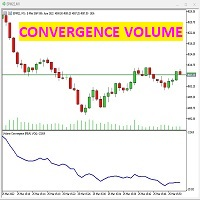
este indicador mostra a força do volume real em relação ao preço. se o gráfico de preços e a tendência de volume tiverem a mesma tendência, significa que tudo está regular. se o indicador divergir do gráfico de preços, significa que a reversão está próxima. quando o preço sobe e o gráfico de "convergência de volume" desce, significa que o dinheiro está saindo do mercado, os vendedores estão vendendo em alta e o preço deve começar a cair em breve. inversamente, se o gráfico de "convergência de v
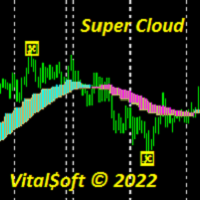
The Super Cloud indicator helps to determine the direction of the trend when trading. Shows on the chart signals about a possible upcoming trend change. The indicator provides an opportunity to detect various features and patterns in price dynamics that are invisible to the naked eye. Based on this information, traders can anticipate further price movement and adjust their strategy accordingly. Works on all timeframes except MN.

KT Risk Reward shows the risk-reward ratio by comparing the distance between the stop-loss/take-profit level to the entry-level. The risk-reward ratio, also known as the R/R ratio, is a measure that compares the potential trade profit with loss and depicts as a ratio. It assesses the reward (take-profit) of a trade by comparing the risk (stop loss) involved in it. The relationship between the risk-reward values yields another value that determines if it is worth taking a trade or not.
Featur
KT Forex Session shows the different Forex market sessions using meaningful illustration and real-time alerts. Forex is one of the world's largest financial market, which is open 24 hours a day, 5 days a week. However, that doesn't mean it operates uniformly throughout the day.
Features
Lightly coded indicator to show the forex market sessions without using massive resources. It provides all kinds of Metatrader alerts when a new session starts. Fully customizable.
Forex Session Timings I
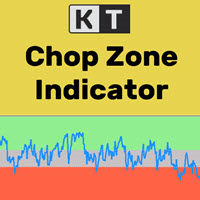
It's a well-known fact that most of the financial markets trend only 30% of the time while moving in a closed range rest 70% of the time. However, most beginner traders find it difficult to see whether the markets are trending or stuck in a range. KT Chop Zone solves this problem by explicitly highlighting the market phase into three zones as Bearish Zone, Bullish Zone, and Chop Zone.
Features
Instantly improve your trading by avoiding trade during the sideways market (Chop Zone). You can al

KT Absolute Strength measures and plots the absolute strength of the instrument's price action in a histogram form. It combines the moving average and histogram for a meaningful illustration. It supports two modes for the histogram calculation, i.e., it can be calculated using RSI and Stochastic both. However, for more dynamic analysis, RSI mode is always preferred.
Buy Entry
When the Absolute Strength histogram turns green and also it's higher than the previous red column.
Sell Entry
W

KT Coppock Curve is a modified version of the original Coppock curve published in Barron's Magazine by Edwin Coppock in 1962. The Coppock curve is a price momentum indicator used to identify the market's more prominent up and down movements.
Features
It comes with up & down arrows signifying the zero line crossovers in both directions. It uses a simplified color scheme to represent the Coppock curve in a better way. It comes with all kinds of Metatrader alerts.
Applications It can provide
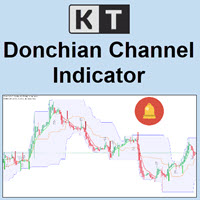
KT Donchian Channel is an advanced version of the famous Donchian channel first developed by Richard Donchian. It consists of three bands based on the moving average of last high and low prices. Upper Band: Highest price over last n period. Lower Band: Lowest price over last n period. Middle Band: The average of upper and lower band (Upper Band + Lower Band) / 2. Where n is 20 or a custom period value is chosen by the trader.
Features
A straightforward implementation of the Donchian channel

KT Auto Trendline draws the upper and lower trendlines automatically using the last two significant swing highs/lows. Trendline anchor points are found by plotting the ZigZag over X number of bars.
Features
No guesswork requires. It instantly draws the notable trendlines without any uncertainty. Each trendline is extended with its corresponding rays, which helps determine the area of breakout/reversal. It can draw two separate upper and lower trendlines simultaneously. It works on all timefr

KT Inside Bar plots the famous inside bar pattern in which the bar carries a lower high and higher low compared to the previous bar. The last bar is also known as the mother bar. On smaller time-frames, the inside bar sometimes appears similar to a triangle pattern.
Features
Also plots entry, stop-loss, and take-profit levels with the inside bar pattern. No complex inputs and settings. Erase unwanted levels when the price reaches the entry line in either direction. All Metatrader alerts incl

KT ROC divergence shows the regular and hidden divergences build between the price and Rate of change oscillator. Rate of change (ROC) is a pure momentum oscillator that calculates the change of percentage in price from one period to another. It compares the current price with the price "n" periods ago. ROC = [(Close - Close n periods ago) / (Close n periods ago)] * 100 There is an interesting phenomenon associated with ROC oscillator. In ROC territory there is no upward limit, but there is a do

Best indicator for MT5 providing accurate and sniper signals to enter a trade without repainting!
It can be applied to any financial assets: forex, synthetic, cryptocurrencies, metals, stocks, indices . It will provide pretty accurate trading signals and tell you when it's best to open a trade and close it. Most traders improve their trading results during the first trading week with the help of the Power Indicator Pro.
Benefits of the Power Indicator Pro
Entry signals without repa
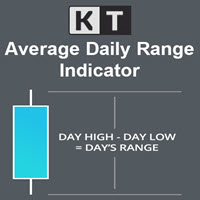
KT Average Daily Range(ADR) shows the upper and lower levels using the average daily range covered by the currency pair or the instrument. The average daily range is calculated using the chosen period in the input settings. ADR High: ADR upper level is found by adding the average daily range value to the current day's low.
ADR Low: ADR lower level is found by subtracting the ADR value from the current day's high.
Features
It shows the ADR levels with several other helpful information bene
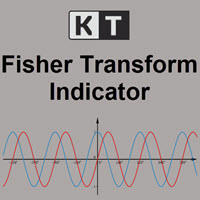
KT Fisher Transform is an advanced version of the original Fisher Transform oscillator equipped with divergence detection, crossover alerts, and many more features. Originally it was developed by John F. Ehlers. It converts the asset's price into a Gaussian normal distribution to find the local extremes in a price wave.
Features
A light-weighted oscillator that efficiently identifies the upward and downward crossovers and marks them using vertical lines. It also finds regular and hidden div

KT MACD Alerts is a personal implementation of the standard MACD indicator available in Metatrader. It provides alerts and also draws vertical lines for the below two events: When MACD crosses above the zero line. When MACD crosses below the zero line.
Features It comes with an inbuilt MTF scanner, which shows the MACD direction on every time frame. A perfect choice for traders who speculate the MACD crossovers above/below the zero line. Along with the alerts, it also draws the vertical line

PriceRunner MT5 The PriceRunner indicator is based on pure relative power. It gives promising results even in M1 timeframes in currency pairs and M2 in commodities and cryptos. The indicator is designed with user-friendly and simple settings. It is very suitable even for beginners who are interested in indicators and strategies. I am ready to make improvements on the indicator in line with the needs of those who buy or rent. However, even in its current state, you can see very promising results
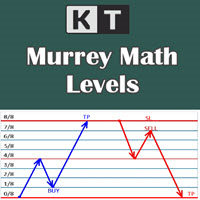
It shows the Murrey Math levels on chart and also provides an alert when price touch a particular level. T. Henning Murrey, in 1995, presented a trading system called Murrey Math Trading System, which is based on the observations made by W.D Gann.
Applications
For Murrey Math lovers, this is a must-have indicator in their arsenal. There is no need to be present on the screen all the time. Whenever the price touches a level, it will send an alert. Spot upcoming reversals in advance by specula
Saiba como comprar um robô de negociação na AppStore do MetaTrader, a loja de aplicativos para a plataforma MetaTrader.
O Sistema de Pagamento MQL5.community permite transações através WebMoney, PayPay, ePayments e sistemas de pagamento populares. Nós recomendamos que você teste o robô de negociação antes de comprá-lo para uma melhor experiência como cliente.
Você está perdendo oportunidades de negociação:
- Aplicativos de negociação gratuitos
- 8 000+ sinais para cópia
- Notícias econômicas para análise dos mercados financeiros
Registro
Login
Se você não tem uma conta, por favor registre-se
Para login e uso do site MQL5.com, você deve ativar o uso de cookies.
Ative esta opção no seu navegador, caso contrário você não poderá fazer login.