Conheça o Mercado MQL5 no YouTube, assista aos vídeos tutoriais
Como comprar um robô de negociação ou indicador?
Execute seu EA na
hospedagem virtual
hospedagem virtual
Teste indicadores/robôs de negociação antes de comprá-los
Quer ganhar dinheiro no Mercado?
Como apresentar um produto para o consumidor final?
Indicadores Técnicos para MetaTrader 5 - 59

Our goal is to empower every trader with their own unique trading system.
Indicator - Red-Green Series
Ultimate simplicity: Red for uptrend, green for downtrend! It can be used independently or in combination with other indicators. This is a red-green indicator based on the crossover of two moving averages. We have more indicators in store and will be adding them gradually. Friends who make a purchase are kindly requested to contact us after their purchase.
In the world of financial tradi

Liberte o Potencial das suas Operações com o Indicador AlphaWave! Tranquilidade nas suas Operações: O Indicador AlphaWave foi desenvolvido para trazer calma às suas operações, suavizando o gráfico e proporcionando uma leitura precisa da direção da tendência. Nunca foi tão fácil tomar decisões de operação claras. Tecnologia Revolucionária de Suavização com 10 Modos: Experimente uma apresentação suave e clara do gráfico com o Indicador AlphaWave. A tecnologia revolucionária de suavização oferece
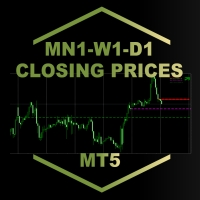
MN1-W1-D1 Close Price Indicator to Index Trading for MT5
The indicator draws lines to the close prices of the last closed bars of monthly, weekly and daily timeframes. Observably, these prices are significant support and resistance prices at major indices, like Nasdaq, DAX. The info panel always shows the prices relative to each other in the correct order. If the current price is the highest - i.e. higher than the last monthly, weekly and daily closing price - it is in the first row. The lowest

Smart Delta Volume: Precisa e Adaptável às Condições Dinâmicas do Mercado O Smart Delta Volume é um indicador técnico avançado, projetado para oferecer uma análise precisa e adaptável às constantes mudanças do mercado. Utilizando níveis dinâmicos que se ajustam automaticamente conforme a volatilidade, este indicador proporciona uma visão mais abrangente e confiável da interação entre fluxo de volume e ação do preço. Essa capacidade de adaptação é crucial para traders que buscam insights rápid

Este é um indicador projetado mecanicamente com base na ação do preço do castiçal. Funciona em qualquer instrumento de negociação produzindo alertas sempre que um impulso de compra ou venda é gerado, porém possui vídeo e documentos explicativos para validação de sinais fornecendo também técnicas de entrada e saída. Pesquise no youtube benjc trade advisor e localize vídeos explicativos deste produto.
A versão mais recente apresenta restrição de tendência e oscilador para filtrar sinais e torná

Subscribe to the 'MA7 Trading' channel to receive notifications about new programs, updates and other information. Ask questions in the profile on the MQL5 .
Description of work
The 'MA7 Flax' indicator is based on the standard Average True Range (ATR) indicator and candle data. Shows candles that are larger in size relative to the ATR indicator value. Detailed information about the 'MA7 Flax' indicator.
Indicator settings
General settings: ATR period – Average True Range indicator period

Subscribe to the 'MA7 Trading' channel to receive notifications about new programs, updates and other information. Ask questions in the profile on the MQL5 .
Description of work
The 'MA7 Viola' indicator is based on the standard Moving Average (MA) indicator. Shows a sharp increase or decrease in the moving average. Detailed information about the 'MA7 Viola' indicator.
Indicator settings
General settings: Difference – difference between the last two MA values, percentage; Period ; Method

We have turned one application of the RSI indicator into a separate indicator, represented by red and green bars, which is incredibly simple and effective.
By simply inputting the parameters for the RSI, you can obtain the RSI indicator represented by red and green bars. The application of the RSI indicator has been expanded into a powerful new indicator, visually presented through red and green bars, undoubtedly an innovative move in the field of financial technical analysis. The design of t

RSI Barometer Pro provides traders and investors with intuitive insights into market sentiment and potential trend reversals by representing RSI values using red and green bars. The meticulous design of red and green bars in RSI Barometer Pro visually showcases market dynamics. When the bars appear green, it indicates that the RSI is below 50, suggesting a relatively stable market phase. Conversely, when the bars turn red, it signifies that the RSI is above 50, indicating potential market volat

Product Name: RSI Momentum Gauge
Product Description: The RSI Momentum Gauge is an advanced indicator that transforms the traditional concept of overbought and oversold signals from the RSI (Relative Strength Index) into a visually intuitive representation using red and green bars. Designed to empower traders and investors with actionable insights, this innovative indicator provides a clear assessment of market conditions and potential trend reversals. The RSI Momentum Gauge's distinctive fea

Pips on Candles shows the number of pips involved in each candle on the chart. It is possible to set 3 different ranges for counting on each single candle via the RangeType parameter: With "HighLow" you count the pips present between the minimum and the maximum. The number is shown under each candlestick on the chart. With "OpenClose" you count the pips present between the opening and closing price of the candle. The number is shown under each candlestick on the chart. With "HighDistAndLowDist"

Exclusive Limited Time Offer! Grab this useful indicator for a lifetime at just $49. Enhance your trading experience with this amazing Metatrader indicator that tracks your live trade status. The indicator displays live take profit, stop loss & trailed stop loss, or trailed profit value with the best dashboard with account balance alert. Indicator Features:
Trade Details The indicator shows the last 5 active trades data in chronological order. Don't miss this opportunity to get your copy tod
Exclusive Limited Time Offer! Grab this powerful indicator for a lifetime at just $65. Open the power of precise decision-making with our revolutionary product, FX Correlation Matrix. This indicator is your key to understanding multiple FX currency pairs' positive and negative correlations at a glance, providing valuable insights to elevate your trading strategies.
Indicator Features:
Multiple-Frame Multi-Currency Dashboard: Displays 10 multiple currency pairs positive and negative correla

Subscribe to the 'MA7 Trading' channel to receive notifications about new programs, updates and other information. Ask questions in the profile on the MQL5 .
Description of work
The 'MA7 Galega' indicator is based on the standard Moving Average (MA) indicator. Shows a puncture of the moving average. Detailed information about the 'MA7 Galega' indicator.
Indicator settings
General settings: Period – MA period; Method – MA method; Apply to – price type; Consider the direction of the candle

Embrace the Power With Ultimate Trend Trader Indicator. Facing the reality of individual traders, we are far from harnessing the capabilities of AI and high-frequency trading algorithms that dominate today's markets. Without access to massive data centers or infrastructure to compete on microseconds, the battle seems skewed. Yet, the true advantage lies not in technological arms but in leveraging human intellect to outsmart the competition. The Ultimate Trend Trader Indicator embodies this appr

Subscribe to the 'MA7 Trading' channel to receive notifications about new programs, updates and other information. Ask questions in the profile on the MQL5 .
Description of work
The 'MA7 Ixora' indicator is based on the standard Moving Average (MA) indicator. Shows the intersection of the fast and slow moving averages. Detailed information about the 'MA7 Ixora' indicator.
Indicator settings
General settings: Consider the direction of the candle .
Fast moving average settings: Period – M

Subscribe to the 'MA7 Trading' channel to receive notifications about new programs, updates and other information. Ask questions in the profile on the MQL5 .
Description of work
The 'MA7 Aster' indicator is based on the standard Moving Average (MA) indicator. Shows the price deviation from the moving average. Detailed information about the 'MA7 Aster' indicator.
Indicator settings
General settings: Period – MA period; Method – MA method; Apply to – price type; Minimum distance – minimum d
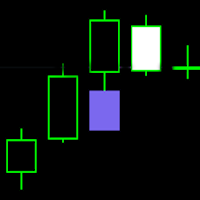
FVG - Fair Value Gap indicator is a three candle pattern indicator . It find inefficiencies or imbalances in market. It act as magnet before continue the trend.
indicator key function
1. No object is used to draw the plot. You can use this to build EA and backtest also.
2. Min and max value to Filter-out the noises .
It use as retest zone and can be use as entry price also. It popular among price action traders. your suggestion and comments are welcome and hopping that you will find th

Subscribe to the 'MA7 Trading' channel to receive notifications about new programs, updates and other information. Ask questions in the profile on the MQL5 .
Description of work
The 'MA7 Hypnum' indicator is based on the standard Commodity Channel Index (CCI) indicator. Shows overbought and oversold zones. Detailed information about the 'MA7 Hypnum' indicator.
Indicator settings
General settings: Period – period of the CCI indicator; Apply to – price type for calculating the CCI indicator

Este indicador é criado para os comerciantes que perceberam a necessidade de estudar mudanças fundamentais na economia sobre as tendências globais dos mercados mundiais. Entendendo que não há maneiras fáceis no mundo de muito dinheiro, suas chances. O indicador Secret Fairway é projetado como uma ferramenta universal no arsenal de trader, analista, investidor. Com ele, você pode criar seu próprio painel que reflete suas opiniões sobre teoria e prática econômica. Ao evoluir com cada transação,
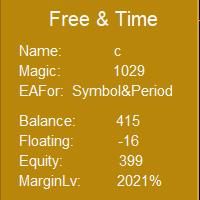
This indicator can use EAMagic to statistics EA since the operation of the revenue data and the current trading volume and trade data statistics, now the first version, should be slowly updated. When using, you must enter the number of EA's Magic when loading, in order to receive EA's transaction data. The part of the input currency pair and cycle can be filled in by the user to more clearly understand the currency pair and cycle that is currently being traded, and to facilitate the screenshot
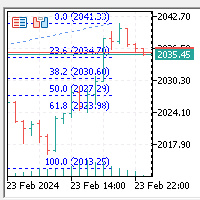
This indicator automatically generates Fibonacci regression lines in the K-line window: 0.0%, 23.6%, 38.2%, 50.0%, 61.8%, and 100.0%, following the displayed price. Zoom In, Zoom Out, Time Frame (M1, M5, M15, M30, H1, H4, D1, W1, MN) can automatically update and generate when the cycle changes, with the highest price worn up and the lowest level broken down. Both upward and downward trends can automatically adjust the direction of the Fibonacci regression line.

O indicador Critical Zones foi criado especialmente para os operadores manuais que procuram entradas mais exactas no mercado. Este indicador utiliza algoritmos avançados para detetar áreas de interesse, calculando o suporte e a resistência mais relevantes no gráfico, bem como os seus rompimentos e retestes. Este indicador pode ser configurado para enviar alertas e notificações quando são detectadas oportunidades de compra/venda potencialmente lucrativas, permitindo que os operadores se mant

Candlesize Histogram is an indicator for monitoring candlestick sizes. This indicator is based on the high and low of a candle, also adopting the use of a histogram to easily determine the length of each candlestick bar. We can determine if the market is gaining momentum using this indicator. The histogram is calculated based on the size of the bars.
Key benefits
- Easily get the length of every candlestick
- Determine market condition if trending or not trending using the Candl
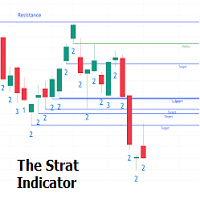
The Strat indicator is a full toolkit regarding most of the concepts within "The Strat" methodology with features such as candle numbering, pivot machine gun (PMG) highlighting, custom combo highlighting, and various statistics included.
Alerts are also included for the detection of specific candle numbers, custom combos, and PMGs.
SETTINGS
Show Numbers on Chart: Shows candle numbering on the chart.
Style Candles: Style candles based on the detected number. Only effective on no

Indicador mostra linhas de "Suporte" e "Resistência" (essas linhas são desenhadas usando o estilo de desenho DRAW_LINE - ou seja, não são objetos gráficos). Uma busca por novos mínimos e máximos é realizada à esquerda e à direita da “barra de sinalização” - a “barra de sinalização” é o meio convencional de cada nova construção. Por que a palavra Flexível está no nome do indicador? Porque temos a possibilidade de especificar diferentes números de barras à esquerda ('Left Bars') e à direita

Scanner de Volatilidade Multimoeda em Tempo Real Olá, traders. Apresento-lhes uma solução única: o Scanner de Volatilidade Multimoeda em Tempo Real. Este indicador é um dos resultados da minha observação pessoal do mercado ao longo de muitos anos. Aborda vários pontos-chave enfrentados pelos traders: Rastreamento de Volatilidade em Tempo Real: Elimina a necessidade de atualizar constantemente ou trocar de gráficos para ver onde estão ocorrendo movimentos significativos. Compreensão das Correl

To get access to MT4 version please click here . This is the exact conversion from TradingView: "Schaff Trend Cycle" by "everget". This is a light-load processing indicator. This is a non-repaint indicator. Buffers are available for processing in EAs. All input fields are available except fillings(due to graphical aesthetics). You can message in private chat for further changes you need. Thanks for downloading

O Pips Hunter PRO foi desenvolvido ao longo de vários anos e é uma versão melhorada do seu antecessor. Este poderoso indicador analisa o mercado e o histórico de preços para gerar entradas de compra e venda. Para o cálculo destas entradas, utiliza diferentes indicadores que funcionam em conjunto, bem como um logaritmo estatístico complexo que filtra as entradas menos favoráveis e as elimina / versão MT4 . O preço aumentará progressivamente devido à procura constante de manter um elevado n
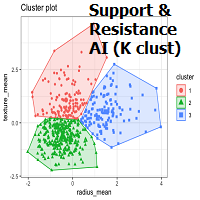
OVERVIEW
K-means is a clustering algorithm commonly used in machine learning to group data points into distinct clusters based on their similarities. While K-means is not typically used directly for identifying support and resistance levels in financial markets, it can serve as a tool in a broader analysis approach.
Support and resistance levels are price levels in financial markets where the price tends to react or reverse. Support is a level where the price tends to stop falling
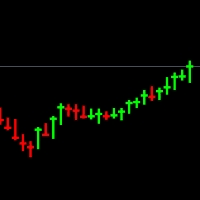
Nota - você tem que ocultar o tipo de gráfico existente, você pode fazer isso alterando as cores do gráfico, se não souber como fazer, confira este vídeo - https://youtu.be/-4H6Z5Z4fKo ou entre em contato comigo em priceaction9@outlook.com
Este é um tipo de gráfico que será mostrado no lugar do seu gráfico, e mostra apenas a máxima, a mínima e o fechamento, e possui mechas grossas. Ajuda você a entender melhor cada vela, reduzindo o ruído introduzido pelos preços de abertura de cada vela.

This indicator, named Edyx_Candle_Size, is designed to be used with the MetaTrader 5 trading platform. It displays the size of the candlestick body for the current timeframe as a histogram. The indicator does not provide any specific trading signals or recommendations
Measures the size of of the candlestick. That is the difference between the open and close as the case may be for either a bullish or a bearish candle. This can be use to filter out entry position as to maximise profit and minimi

Order Blocks are supply or demand zones in which big traders can find the comfort of placing large buy and sell orders and completing a big, very big transaction. Order blocks are a unique trading strategy that helps traders find a direction in the market. Usually, it allows traders to find out what financial institutions are planning to do in a particular market and better indicate the next price movement.

Você está pronto para levar sua negociação para o próximo nível? Apresentando WH Divergence Pro MT5 ,
um indicador de divergência avançado que permite escolher entre uma variedade de indicadores técnicos populares.
Agora, você pode adaptar seus sinais de divergência para corresponder à sua estratégia de negociação exclusiva. Entre em contato comigo após a compra para orientá-lo sobre os profissionais Características principais :
Seleção de Indicador : Escolha seu indicador preferi

Combination of Ichimoku and Super Trend indicators, with Signals and live notifications on Mobile App and Meta Trader Terminal. Features: Display five reliable signals of ARC Ichimoku Filter signals by their strength level (strong, neutral, weak) Send live notifications on Mobile App and Meta Trader terminal S ignals remain consistent without repainting Applicable across all time-frames Suitable for all markets Notifications format: "ARC Ichimoku | XAUUSD | BUY at 1849.79 | Tenken-Kijun cross |

O painel verifica as leituras de dois indicadores: ‘MACD’ e ‘Estocástico’. Exibe sinais em três colunas: para MACD, para Estocástico e a coluna resultante (se o sinal for o mesmo para ambos os indicadores). A digitalização pode ser selecionada em um ou mais períodos de tempo. Se você desabilitar todos os prazos, o painel ainda será carregado, mas com configurações específicas para esses casos. Os sinais são sempre verificados para a barra zero (a barra zero é a barra mais à direita do gráfico) d

The well-known ZigZag indicator that draws rays based on the "significant movement" specified by the pips parameter. If a ray appears, it will not disappear (the indicator is not redrawn), only its extremum will be updated until the opposite ray appears. You also can display text labels on each rays describing the width of the ray in bars and the length of the ray in points.
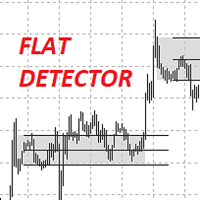
I present to you the IndFlatDetector indicator.
It belongs to the level indicators and shows the Trading Levels. This indicator combines the simplicity of intuitive settings and the accuracy of drawing levels.
Up count - the number of candlesticks up to determine the upper range
Down count - the number of candlesticks down to determine the lower range
Borders on the body or shadow - calculate the range by shadows or by body
Change the borders or not - change the boundaries of the orig

The ZigZag Wave Entry Alert** indicator, created by Azad Gorgis in 2024, is designed for MetaTrader 5 and aims to provide traders with entry signals based on ZigZag patterns. Here's a brief overview of its functionality and key features:
Functionality:
- Detection of ZigZag Patterns: The indicator identifies significant price movements and outlines potential ZigZag patterns on the chart. It detects new highs and lows based on user-defined parameters such as Depth, Deviation, and Backstep. -

The " Session Control " indicator is designed to display trading sessions on a price chart. This allows the trader to see at what points of activity the most important trading sessions occur: Pacific, European, American and Asian. Each of these sessions is characterized by a certain volatility and activity in the market, which is important for making trading decisions.
Peculiarities: Displaying sessions : The indicator shows time periods on the price chart corresponding to different trading s
Este indicador é um oscilador de escala semilogarítmica ancorado. Uma escala logarítmica é amplamente utilizada por cientistas de dados profissionais para mapear com mais precisão as informações coletadas ao longo de um período de tempo, da mesma forma que o MT5 mapeia os dados de preços. Na verdade, a lógica subjacente a este indicador foi obtida gratuitamente de um cientista biotecnológico estrangeiro.
Um gráfico log-log exibe valores logarítmicos nos eixos x (horizontal) e y (vertical), o

Brief Description: A tool to display historical Open, High, Low, and Close (OHLC) price points for various time periods. Gain insights into market behavior with data from yesterday, the day before, the previous week, and the previous month. Recognize liquidity zones effectively. Features: 1. Comprehensive Timeframe Insights: Visualize crucial OHLC points for different timeframes. Historical data for yesterday, day before yesterday, previous week, and previous month. 2. Built on ICT's Teachings:

Introducing the Consecutive Green/Red Candle Alert Indicator for MT5 - Your Trend Spotting Companion!
Are you ready to take your trading to the next level? We present the Consecutive Green/Red Candle Alert Indicator, a powerful tool designed to help you spot trends and potential reversals with ease. Whether you're a new trader looking for clarity in the market or an experienced pro seeking additional confirmation, this indicator is your trusted companion.
Key Features of the Consecutive Gre

Buy CTS scalping indicator, provide buying and selling signals, automatic channeling and sending signals to mobile phones
Using technical analysis and price action methods and modern methods, CTS indicator can draw price channels and recognize price trends with high accuracy and issue entry and exit signals according to them. Traders can easily fluctuate using this indicator in different time frames and in different markets. With the CTS indicator, you can signal in different ways. This indicat
Buy DEMA 3 Scalp Indicator, Signaling and Trend Finder for Forex DEMA 3 indicator is a professional indicator for finding trends as well as finding entry and exit points for a symbol. This indicator is designed based on the DEMA indicator, which can tell you the signals accurately and quickly. The DEMA 3 indicator can give you accurate and early entry points for swings. Features of the DEMA indicator 3
Receive signals as notifications on the Metatrader mobile application. Receive signals by em
Linear regression AI powered Indicator: Linear regression is a simple yet effective AI technique that is the foundation of complex neural networks, This indicator is built based on linear regression analysis and tries to make predictions on the upcoming event in the market Inputs : train_bars: This controls the number of bars that the price information will be collected and used to train the AI inside it, The greater this value the better also the slower the indicator becomes during initializati

The best quality application of the famous Super Trend indicator that requires no introduction. It is completely faithful to the original algorithm and powered by the CCI indicator.
- easy to trade - It implements all kinds of warnings. - It implements a multi-timezone dashboard. - It cannot be repainted or backpainted.
Input parameters - ATR Period – This is the average true range period. - ATR Multiplier - The ATR multiplier that defines the trend. - CCI - Makes trend following powerful. -
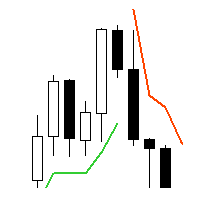
Supertrend - невероятно мощный и универсальный индикатор, предназначенный для помощи трейдерам в определении текущего тренда на конкретном торговом инструменте. С помощью двух встроенных индикаторов, Average True Range и Standard Deviation, трейдеры могут выбрать наиболее подходящий индикатор для своей стратегии торговли. Пользователи также могут настроить период этих индикаторов и выбрать цену (Close, High, Low, Open, Weighted), к которой он должен быть применен, с Typical price в качестве опци

Heikin Ashi Heikin Ashi is a charting technique that can be used to predict future price movements. It is similar to traditional candlestick charts. However, unlike a regular candlestick chart, the Heikin Ashi chart attempts to filter out some of the market noise by smoothing out strong price swings to better identify trend movements in the market.
To create Heiken Ashi, a formula is used in which price data is entered, while ordinary candles are built only on bare numbers, without using any

An invention that will turn your working principles upside down.
Especially in horizontal and stagnant markets, annoying losses can occur.
Besides, following trend lines, support and resistance can be tiring.
To put an end to all this, I decided to create a professional "moving average" indicator.
All you have to do is follow the colors.
If you need additional support, I recommend the "Heiken-Ashi" candle indicator in my profile.
I wish you lots of profit..

Description: Dimatis Watchtower is a powerful backtesting tool designed for traders seeking for an efficient way to test and optimize their trading strategies on the MetaTrader 5 platform. With a minimalist interface and advanced features, this tool provides an outstanding solution for evaluating the performance of your strategies in various market conditions. Key Features: Backtesting: Perform precise and reliable backtests of your strategies using historical data from your broker directly on M

Supertrend is a trend following indicator based on the Average True Range (ATR) . Calculating the odd line combines trend detection and volatility. It can be used to detect changes in trend direction and position stops.
Basic knowledge Supertrend is a trend following indicator. It takes up space on the main chart and its plots show the current trend. A Supertrend can be used for varying durations (daily, weekly, intraday, etc.) and varying instruments (stocks, futures or forex). Super

Certainly! Let’s discuss the RSI Rush , an aggressive momentum indicator that combines weighted moving averages (WMAs) at lows, mid-price, and tight highs. Here are the key components: Weighted Moving Averages (WMAs) : The RSI Rush employs three WMAs: WMA at Lows : Calculated based on the lowest prices during a specific period. WMA at Mid-Price : Considers the average price (midway between highs and lows) during the same period. WMA at Tight Highs : Based on the highest prices during the speci

É desafiador capturar rompimento com forte momento. O propósito do Super Breakouts Monitor é identificar tais condições de mercado. Este indicador foi inspirado em um conceito do renomado Analista Técnico Tushar Chande, que combina dois indicadores altamente adaptativos, VIDYA e o Índice de Momento Dinâmico (ambos suas criações), para capturar as fases iniciais de um rompimento de sucesso. Na Minions Labs, adicionamos nossos próprios aprimoramentos para adaptar essas ótimas ideias para mercados

Moving Average Scanner é um scanner multi-período perfeito para ver a tendência ao longo de vários períodos de tempo de uma só vez, sem alterar o gráfico.
Ele pode usar até 4 médias móveis de sua escolha em 9 unidades de tempo. É totalmente configurável e pode ser movido para qualquer lugar do gráfico simplesmente “arrastar e soltar”.
As médias móveis podem ser configuradas em 4 métodos de cálculo diferentes. Você também pode definir alertas com base no número de médias móveis e no número
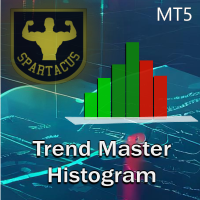
Trend Chart Histogram é um indicador baseado em um algoritmo que usa duas médias móveis e vários osciladores. Graças ao seu código de cores, permite identificar rapidamente a tendência e aproveitar os maiores impulsos do mercado.
As cores claras indicam a tendência, as escuras definem os impulsos e o cinza indica que você não deve entrar no mercado.
Versão MT4 aqui.
Parâmetros de entrada:
- Período 1 (período rápido)
- Período 2 (período lento)
- Período do oscilador
Você pode a
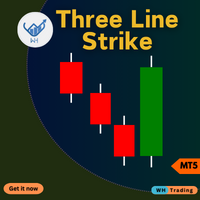
Indicador de greve de três linhas para MetaTrader 5 (MT5). Esta ferramenta avançada foi projetada para ajudá-lo a identificar possíveis reversões no mercado com precisão e facilidade.
Quer você seja um trader iniciante ou experiente, este indicador pode aprimorar suas decisões comerciais e maximizar seus lucros. Contact me after purchase for guidance Características principais: Sinais de reversão precisos : detecte possíveis reversões de tendência com base no padrão de ataque de três linha

Subscribe to the 'MA7 Trading' channel to receive notifications about new programs, updates and other information. Ask questions in the profile on the MQL5 .
Description of work
The 'MA7 Clover' indicator is based on candle shapes. Shows the 'Pin Bar' candle pattern. Detailed information about the 'MA7 Clover' indicator.
Indicator settings
General settings: Min body size ; Max body size ; Min nose size ; Max nose size .
Message settings: Send message to the terminal (Alert) – permission
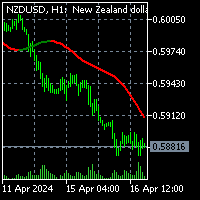
To download MT4 version please click here. - This is the exact conversion from TradingView: "Sentiment Range Ma" By "ChartPrime". - This is a non-repaint and light processing load indicator - You can message in private chat for further changes you need. - All input options are available. - Buffers are available for processing within EAs. - Highlight option is omitted as does not show good in Metatrader.

To download MT4 version please click here .
- This is the exact conversion from TradingView: " PA-Adaptive Hull Parabolic " By "Loxx".
- This is a non-repaint and light processing load indicator
- You can message in private chat for further changes you need.
- All input options are available.
- Buffers are available for processing within EAs.
- Highlight option is omitted as does not show good in Metatrader.

This DYJ PowerSignalSource is a complete trading system based on ATR technical indicators. This indicator will analyze and record the trend intensity of each cycle and current currency pair from M1-MN
DYJ PowerSignalSource creates a trend intensity and entry point signal list display by evaluating this data. When the trend percentage reaches 75% or greater, we consider it a strong currency. If the trend intensity percentage reaches 100%, we consider it the strongest, and a warning will pop up
Você quer ter sucesso no mercado Forex? Nosso inovador indicador AI Swing Trading é a sua chave secreta para negociações lucrativas e bem-sucedidas. Apresentamos a você esta ferramenta única:
Nosso indicador está equipado com uma rede neural integrada que permite analisar grandes quantidades de dados, identificar mudanças e prever movimentos de preços. Esta tecnologia permite que você tome decisões comerciais informadas com base em análises de mercado aprofundadas. O algoritmo do indicado
O MA Killer Indicator é a arma definitiva para os traders que utilizam médias móveis. É um sistema completo que utiliza diversas ferramentas acessíveis diretamente por um painel de gestão . Graças às suas ferramentas tem uma visão geral do mercado e um auxílio valioso na tomada de decisões para a entrada numa posição.
Consiste:
- O indicador Trend Master chart que exibe a tendência diretamente no gráfico utilizando um código de cores. Esta tendência é calculada por um algoritmo que utiliza
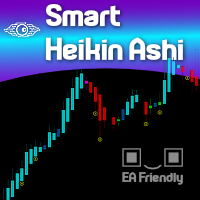
Os candlesticks Heikin Ashi suavizam os dados de preço para ajudar os traders a identificar tendências e padrões no mercado. Ao média os valores de preço, esses candlesticks fornecem uma representação visual mais clara, facilitando a identificação de tendências e a previsão de movimentos futuros sem o ruído dos candlesticks padrão. Nós, da Minions Labs, estamos revisitando este tópico por causa de nossos colegas Swing Trades, que adoram Heikin Ashi.
POR QUE EU DEVERIA ME IMPORTAR com o Smart
Welcome to the next level of trading sophistication with the Bollinger Bands Scanner for MT5! Elevate your trading experience and unlock enhanced insights and efficiency with our powerful MT5 indicator. Key Features: Effortless Bollinger Bands Scanning: Seamlessly harness the power of the Bollinger Bands Scanner to scan multiple assets effortlessly. Receive instant alerts when specific Bollinger Bands conditions are met, ensuring you're always ahead of market movements. Comprehensive Dashboard I
O indicador RSI Pro Analyzer é uma ferramenta poderosa projetada para traders que buscam tomar decisões informadas em vários intervalos de tempo simultaneamente. Este indicador utiliza o RSI para fornecer sinais de sobrecompra, sobrevenda e tendência , facilitando a identificação de oportunidades de entrada no mercado. Sua principal vantagem é a facilidade de leitura graças aos códigos de cores claros e distintos para indicar as diferentes condições do mercado.
O indicador exibe valores RSI e
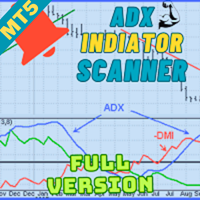
Welcome to advanced trading with the ADX Multicurrency Scanner for MT5! Elevate your trading experience with our powerful MT5 indicator, meticulously designed to offer seamless currency scanning and real-time insights. Key Features: Effortless Multicurrency Scanning: Unlock the full potential of the ADX Multicurrency Scanner for MT5 by effortlessly scanning multiple currencies. Receive instant alerts when specific conditions are met, ensuring you stay ahead of the market and capitalize on every
The DYJ StochasticSignalSource is displayed as two lines. The main line is called %K. The second line, called %D, is a Moving Average of %K. The %K line is usually displayed as a solid line and the %D line is usually displayed as a dotted line. There are several ways to interpret a Stochastic Oscillator. four popular methods include: Buy when the Oscillator (either %K or %D) falls below a specific level (for example, 20) . Sell when the Oscillator rises above a specific level (for example, 80)
Welcome to the world of advanced trading with the MACD Multicurrency Scanner for MT5! Elevate your trading experience with our powerful MT5 indicator meticulously designed for seamless analysis and real-time insights. Key Features: Effortless MACD Scanning: Unlock the full potential of the MACD Multicurrency Scanner for MT5 by effortlessly scanning multiple currency pairs. Receive instant alerts when specific Moving Average Convergence Divergence (MACD) conditions are met, ensuring you stay ahea

This indicator obeys the popular maxim that: "THE TREND IS YOUR FRIEND" It paints a Blue line for BUY and also paints a RED line for SELL. (you can change the colors). It gives alarms and alerts of all kinds. IT DOES NOT REPAINT COLOR and can be used for all currency pairs and timeframes. Yes, as easy and simple as that. Even a newbie can use it to make great and reliable trades. https://www.mql5.com/en/market/product/115553
O Mercado MetaTrader oferece um local conveniente e seguro para comprar aplicativos para a plataforma MetaTrader. Faça download de versões de demonstração gratuitas de Expert Advisors e indicadores a partir do seu terminal para testes no Testador de Estratégia.
Teste os aplicativos em diferentes modos para monitoramento do desempenho e assim fazer um pagamento para o produto que você deseja, usando o sistema de pagamento MQL5.community.
Você está perdendo oportunidades de negociação:
- Aplicativos de negociação gratuitos
- 8 000+ sinais para cópia
- Notícias econômicas para análise dos mercados financeiros
Registro
Login
Se você não tem uma conta, por favor registre-se
Para login e uso do site MQL5.com, você deve ativar o uso de cookies.
Ative esta opção no seu navegador, caso contrário você não poderá fazer login.