Guarda i video tutorial del Market su YouTube
Come acquistare un Robot di Trading o un indicatore
Esegui il tuo EA
hosting virtuale
hosting virtuale
Prova un indicatore/robot di trading prima di acquistarlo
Vuoi guadagnare nel Market?
Come presentare un prodotto per venderlo con successo
Indicatori tecnici per MetaTrader 5 - 59

Our goal is to empower every trader with their own unique trading system.
Indicator - Red-Green Series
Ultimate simplicity: Red for uptrend, green for downtrend! It can be used independently or in combination with other indicators. This is a red-green indicator based on the crossover of two moving averages. We have more indicators in store and will be adding them gradually. Friends who make a purchase are kindly requested to contact us after their purchase.
In the world of financial tradi

Sfrutta il Potenziale delle Tue Operazioni con l'Indicatore AlphaWave! Porta Serenità alle Tue Operazioni: L'Indicatore AlphaWave è progettato per portare calma alle tue operazioni, levigando il grafico e offrendo una lettura precisa della direzione del trend. Prendere decisioni di trading chiare non è mai stato così facile. Tecnologia di Levigatura Rivoluzionaria con 10 Modalità: Scopri una presentazione fluida e chiara del grafico con l'Indicatore AlphaWave. La tecnologia rivoluzionaria di lev
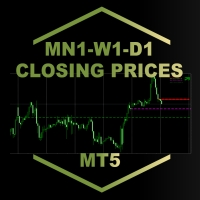
MN1-W1-D1 Close Price Indicator to Index Trading for MT5
The indicator draws lines to the close prices of the last closed bars of monthly, weekly and daily timeframes. Observably, these prices are significant support and resistance prices at major indices, like Nasdaq, DAX. The info panel always shows the prices relative to each other in the correct order. If the current price is the highest - i.e. higher than the last monthly, weekly and daily closing price - it is in the first row. The lowest

Smart Delta Volume: Preciso e Adattabile alle Condizioni Dinamiche del Mercato Smart Delta Volume è un indicatore tecnico avanzato progettato per offrire un'analisi precisa e adattabile in un ambiente di mercato in continua evoluzione. Utilizzando livelli dinamici che si regolano automaticamente in base alla volatilità, questo indicatore fornisce una visione più completa e affidabile dell'interazione tra flusso di volume e azione dei prezzi. Questa capacità di adattamento è cruciale per i tra

Questo è un indicatore progettato meccanicamente basato sull'azione del prezzo del candeliere. Funziona su qualsiasi strumento di trading producendo avvisi ogni volta che viene generato un impulso di acquisto o vendita, tuttavia sono disponibili un video e documenti esplicativi per la convalida dei segnali che forniscono anche tecniche di entrata e uscita. Cerca su YouTube Benjc Trade Advisor e individua i video esplicativi su questo prodotto.
L'ultima versione presenta vincoli di trend e osc

Subscribe to the 'MA7 Trading' channel to receive notifications about new programs, updates and other information. Ask questions in the profile on the MQL5 .
Description of work
The 'MA7 Flax' indicator is based on the standard Average True Range (ATR) indicator and candle data. Shows candles that are larger in size relative to the ATR indicator value. Detailed information about the 'MA7 Flax' indicator.
Indicator settings
General settings: ATR period – Average True Range indicator period

Subscribe to the 'MA7 Trading' channel to receive notifications about new programs, updates and other information. Ask questions in the profile on the MQL5 .
Description of work
The 'MA7 Viola' indicator is based on the standard Moving Average (MA) indicator. Shows a sharp increase or decrease in the moving average. Detailed information about the 'MA7 Viola' indicator.
Indicator settings
General settings: Difference – difference between the last two MA values, percentage; Period ; Method

We have turned one application of the RSI indicator into a separate indicator, represented by red and green bars, which is incredibly simple and effective.
By simply inputting the parameters for the RSI, you can obtain the RSI indicator represented by red and green bars. The application of the RSI indicator has been expanded into a powerful new indicator, visually presented through red and green bars, undoubtedly an innovative move in the field of financial technical analysis. The design of t

RSI Barometer Pro provides traders and investors with intuitive insights into market sentiment and potential trend reversals by representing RSI values using red and green bars. The meticulous design of red and green bars in RSI Barometer Pro visually showcases market dynamics. When the bars appear green, it indicates that the RSI is below 50, suggesting a relatively stable market phase. Conversely, when the bars turn red, it signifies that the RSI is above 50, indicating potential market volat

Product Name: RSI Momentum Gauge
Product Description: The RSI Momentum Gauge is an advanced indicator that transforms the traditional concept of overbought and oversold signals from the RSI (Relative Strength Index) into a visually intuitive representation using red and green bars. Designed to empower traders and investors with actionable insights, this innovative indicator provides a clear assessment of market conditions and potential trend reversals. The RSI Momentum Gauge's distinctive fea

Pips on Candles mostra il numero di pips coinvolte in ogni candela del grafico. E' possibile impostare 3 range differenti per il conteggio su ogni singola candela tramite il parametro RangeType : Con " HighLow " si contano le pips presenti tra il minimo e il massimo. Il numero viene mostrato sotto ogni candela del grafico. Con " OpenClose " si contano le pips presenti tra il prezzo d'apertura e quello di chiusura della candela. Il numero viene mostrato sotto ogni candela del grafico. Con " Hi

Exclusive Limited Time Offer! Grab this useful indicator for a lifetime at just $49. Enhance your trading experience with this amazing Metatrader indicator that tracks your live trade status. The indicator displays live take profit, stop loss & trailed stop loss, or trailed profit value with the best dashboard with account balance alert. Indicator Features:
Trade Details The indicator shows the last 5 active trades data in chronological order. Don't miss this opportunity to get your copy tod
Exclusive Limited Time Offer! Grab this powerful indicator for a lifetime at just $65. Open the power of precise decision-making with our revolutionary product, FX Correlation Matrix. This indicator is your key to understanding multiple FX currency pairs' positive and negative correlations at a glance, providing valuable insights to elevate your trading strategies.
Indicator Features:
Multiple-Frame Multi-Currency Dashboard: Displays 10 multiple currency pairs positive and negative correla

Subscribe to the 'MA7 Trading' channel to receive notifications about new programs, updates and other information. Ask questions in the profile on the MQL5 .
Description of work
The 'MA7 Galega' indicator is based on the standard Moving Average (MA) indicator. Shows a puncture of the moving average. Detailed information about the 'MA7 Galega' indicator.
Indicator settings
General settings: Period – MA period; Method – MA method; Apply to – price type; Consider the direction of the candle

Embrace the Power With Ultimate Trend Trader Indicator. Facing the reality of individual traders, we are far from harnessing the capabilities of AI and high-frequency trading algorithms that dominate today's markets. Without access to massive data centers or infrastructure to compete on microseconds, the battle seems skewed. Yet, the true advantage lies not in technological arms but in leveraging human intellect to outsmart the competition. The Ultimate Trend Trader Indicator embodies this appr

Subscribe to the 'MA7 Trading' channel to receive notifications about new programs, updates and other information. Ask questions in the profile on the MQL5 .
Description of work
The 'MA7 Ixora' indicator is based on the standard Moving Average (MA) indicator. Shows the intersection of the fast and slow moving averages. Detailed information about the 'MA7 Ixora' indicator.
Indicator settings
General settings: Consider the direction of the candle .
Fast moving average settings: Period – M

Subscribe to the 'MA7 Trading' channel to receive notifications about new programs, updates and other information. Ask questions in the profile on the MQL5 .
Description of work
The 'MA7 Aster' indicator is based on the standard Moving Average (MA) indicator. Shows the price deviation from the moving average. Detailed information about the 'MA7 Aster' indicator.
Indicator settings
General settings: Period – MA period; Method – MA method; Apply to – price type; Minimum distance – minimum d
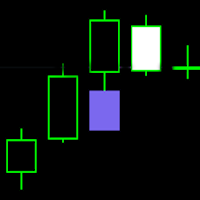
FVG - Fair Value Gap indicator is a three candle pattern indicator . It find inefficiencies or imbalances in market. It act as magnet before continue the trend.
indicator key function
1. No object is used to draw the plot. You can use this to build EA and backtest also.
2. Min and max value to Filter-out the noises .
It use as retest zone and can be use as entry price also. It popular among price action traders. your suggestion and comments are welcome and hopping that you will find th

Subscribe to the 'MA7 Trading' channel to receive notifications about new programs, updates and other information. Ask questions in the profile on the MQL5 .
Description of work
The 'MA7 Hypnum' indicator is based on the standard Commodity Channel Index (CCI) indicator. Shows overbought and oversold zones. Detailed information about the 'MA7 Hypnum' indicator.
Indicator settings
General settings: Period – period of the CCI indicator; Apply to – price type for calculating the CCI indicator

This indicator is created for traders who realized the need to study fundamental changes in the economy on global trends of world markets. Understanding that there are no easy ways in the world of big money, your odds. Secret Fairway indicator is designed as a universal tool in the arsenal of trader, analyst, investor. With it, you can create your own dashboard that reflects your views on economic theory and practice. By evolving with each transaction, each read book, article, and every entry
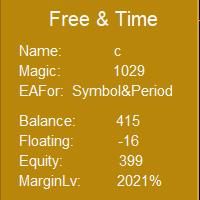
This indicator can use EAMagic to statistics EA since the operation of the revenue data and the current trading volume and trade data statistics, now the first version, should be slowly updated. When using, you must enter the number of EA's Magic when loading, in order to receive EA's transaction data. The part of the input currency pair and cycle can be filled in by the user to more clearly understand the currency pair and cycle that is currently being traded, and to facilitate the screenshot
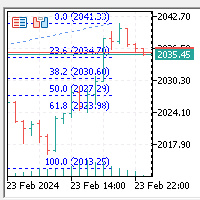
This indicator automatically generates Fibonacci regression lines in the K-line window: 0.0%, 23.6%, 38.2%, 50.0%, 61.8%, and 100.0%, following the displayed price. Zoom In, Zoom Out, Time Frame (M1, M5, M15, M30, H1, H4, D1, W1, MN) can automatically update and generate when the cycle changes, with the highest price worn up and the lowest level broken down. Both upward and downward trends can automatically adjust the direction of the Fibonacci regression line.

Critical Zones è stato creato appositamente per i trader manuali alla ricerca di entrate nel mercato più accurate. Questo indicatore utilizza algoritmi avanzati per individuare le aree di interesse, calcolando i supporti e le resistenze più rilevanti sul grafico, nonché i loro breakout e retest. Questo indicatore può essere configurato per inviare avvisi e notifiche quando vengono rilevate opportunità di acquisto/vendita potenzialmente redditizie, consentendo ai trader di rimanere in cima all

Candlesize Histogram is an indicator for monitoring candlestick sizes. This indicator is based on the high and low of a candle, also adopting the use of a histogram to easily determine the length of each candlestick bar. We can determine if the market is gaining momentum using this indicator. The histogram is calculated based on the size of the bars.
Key benefits
- Easily get the length of every candlestick
- Determine market condition if trending or not trending using the Candl
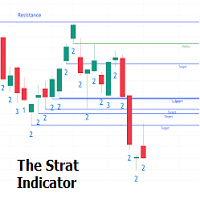
The Strat indicator is a full toolkit regarding most of the concepts within "The Strat" methodology with features such as candle numbering, pivot machine gun (PMG) highlighting, custom combo highlighting, and various statistics included.
Alerts are also included for the detection of specific candle numbers, custom combos, and PMGs.
SETTINGS
Show Numbers on Chart: Shows candle numbering on the chart.
Style Candles: Style candles based on the detected number. Only effective on no

Indicatore mostra le linee "Supporto" e "Resistenza" (queste linee sono disegnate utilizzando lo stile di disegno DRAW_LINE - cioè non sono oggetti grafici). La ricerca di nuovi minimi e massimi avviene a sinistra e a destra della "barra del segnale" - la "barra del segnale" è il centro convenzionale di ogni nuova costruzione. Perché la parola Flessibile nel nome dell'indicatore? Perché abbiamo la possibilità di specificare un numero diverso di barre a sinistra (“Left Bars”) e a destra

Scanner di Volatilità Multivaluta in Tempo Reale Ciao, trader. Vi presento una soluzione unica: lo Scanner di Volatilità Multivaluta in Tempo Reale. Questo indicatore è uno dei risultati delle mie osservazioni personali di mercato nel corso di molti anni. Affronta diversi punti chiave con cui si confrontano i trader: Tracciamento della Volatilità in Tempo Reale: Elimina la necessità di aggiornare costantemente o cambiare grafici per vedere dove si stanno verificando movimenti significativi. C

To get access to MT4 version please click here . This is the exact conversion from TradingView: "Schaff Trend Cycle" by "everget". This is a light-load processing indicator. This is a non-repaint indicator. Buffers are available for processing in EAs. All input fields are available except fillings(due to graphical aesthetics). You can message in private chat for further changes you need. Thanks for downloading

Pips Hunter PRO è stato sviluppato nel corso di diversi anni ed è una versione migliorata del suo predecessore. Questo potente indicatore analizza il mercato e la storia dei prezzi per generare entrate in acquisto e in vendita. Per il calcolo di queste entrate utilizza diversi indicatori che lavorano insieme, nonché un complesso logaritmo statistico che filtra le entrate meno favorevoli e le elimina / versione MT4 . Il prezzo aumenterà progressivamente a causa della costante ricerca di mant
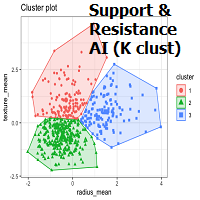
OVERVIEW
K-means is a clustering algorithm commonly used in machine learning to group data points into distinct clusters based on their similarities. While K-means is not typically used directly for identifying support and resistance levels in financial markets, it can serve as a tool in a broader analysis approach.
Support and resistance levels are price levels in financial markets where the price tends to react or reverse. Support is a level where the price tends to stop falling
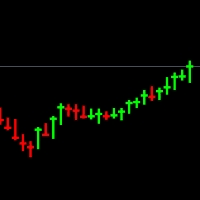
Nota: devi nascondere il tipo di grafico esistente, puoi farlo cambiando i colori del grafico, se non sai come farlo, guarda questo video - https://youtu.be/-4H6Z5Z4fKo o contattami a priceaction9@outlook.com
Questo è un tipo di grafico che verrà mostrato al posto del tuo grafico e mostra solo il massimo, il minimo e la chiusura e ha stoppini spessi. Ti aiuta a comprendere meglio ogni candela riducendo il rumore introdotto dai prezzi aperti su ciascuna candela.
Ad esempio, sulla scala da 1

This indicator, named Edyx_Candle_Size, is designed to be used with the MetaTrader 5 trading platform. It displays the size of the candlestick body for the current timeframe as a histogram. The indicator does not provide any specific trading signals or recommendations
Measures the size of of the candlestick. That is the difference between the open and close as the case may be for either a bullish or a bearish candle. This can be use to filter out entry position as to maximise profit and minimi

Order Blocks are supply or demand zones in which big traders can find the comfort of placing large buy and sell orders and completing a big, very big transaction. Order blocks are a unique trading strategy that helps traders find a direction in the market. Usually, it allows traders to find out what financial institutions are planning to do in a particular market and better indicate the next price movement.

Sei pronto a portare il tuo trading al livello successivo? Presentazione di WH Divergence Pro MT5 ,
un indicatore di divergenza avanzato che ti consente di scegliere tra una varietà di indicatori tecnici popolari.
Ora puoi personalizzare i tuoi segnali di divergenza per adattarli alla tua strategia di trading unica. Contattami dopo l'acquisto per guidarti attraverso i processi Caratteristiche principali :
Selezione dell'indicatore : scegli il tuo indicatore preferito tra le seguen

Combination of Ichimoku and Super Trend indicators, with Signals and live notifications on Mobile App and Meta Trader Terminal. Features: Display five reliable signals of ARC Ichimoku Filter signals by their strength level (strong, neutral, weak) Send live notifications on Mobile App and Meta Trader terminal S ignals remain consistent without repainting Applicable across all time-frames Suitable for all markets Notifications format: "ARC Ichimoku | XAUUSD | BUY at 1849.79 | Tenken-Kijun cross |

Il dashboard scansiona le letture di due indicatori: "MACD" e "Stocastico". Visualizza i segnali in tre colonne: per MACD, per Stocastico e la colonna risultante (se il segnale è lo stesso per entrambi gli indicatori). La scansione può essere selezionata su uno o più intervalli temporali. Se disabiliti tutti gli intervalli di tempo, la dashboard verrà comunque caricata, ma con impostazioni specifiche per questi casi. I segnali vengono sempre controllati per la barra zero (la barra zero è la barr

The well-known ZigZag indicator that draws rays based on the "significant movement" specified by the pips parameter. If a ray appears, it will not disappear (the indicator is not redrawn), only its extremum will be updated until the opposite ray appears. You also can display text labels on each rays describing the width of the ray in bars and the length of the ray in points.
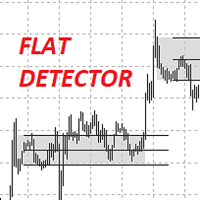
I present to you the IndFlatDetector indicator.
It belongs to the level indicators and shows the Trading Levels. This indicator combines the simplicity of intuitive settings and the accuracy of drawing levels.
Up count - the number of candlesticks up to determine the upper range
Down count - the number of candlesticks down to determine the lower range
Borders on the body or shadow - calculate the range by shadows or by body
Change the borders or not - change the boundaries of the orig

The ZigZag Wave Entry Alert** indicator, created by Azad Gorgis in 2024, is designed for MetaTrader 5 and aims to provide traders with entry signals based on ZigZag patterns. Here's a brief overview of its functionality and key features:
Functionality:
- Detection of ZigZag Patterns: The indicator identifies significant price movements and outlines potential ZigZag patterns on the chart. It detects new highs and lows based on user-defined parameters such as Depth, Deviation, and Backstep. -

The " Session Control " indicator is designed to display trading sessions on a price chart. This allows the trader to see at what points of activity the most important trading sessions occur: Pacific, European, American and Asian. Each of these sessions is characterized by a certain volatility and activity in the market, which is important for making trading decisions.
Peculiarities: Displaying sessions : The indicator shows time periods on the price chart corresponding to different trading s
Questo indicatore è un oscillatore ancorato su scala semi-logaritmica. Una scala logaritmica è ampiamente utilizzata dai data scientist professionisti per mappare in modo più accurato le informazioni raccolte in un intervallo di tempo, nello stesso modo in cui MT5 mappa i dati sui prezzi. In effetti, la logica alla base di questo indicatore è stata ottenuta liberamente da uno scienziato biotecnologico straniero.
Un grafico log-log visualizza i valori logaritmici su entrambi gli assi x (orizzo

Brief Description: A tool to display historical Open, High, Low, and Close (OHLC) price points for various time periods. Gain insights into market behavior with data from yesterday, the day before, the previous week, and the previous month. Recognize liquidity zones effectively. Features: 1. Comprehensive Timeframe Insights: Visualize crucial OHLC points for different timeframes. Historical data for yesterday, day before yesterday, previous week, and previous month. 2. Built on ICT's Teachings:

Introducing the Consecutive Green/Red Candle Alert Indicator for MT5 - Your Trend Spotting Companion!
Are you ready to take your trading to the next level? We present the Consecutive Green/Red Candle Alert Indicator, a powerful tool designed to help you spot trends and potential reversals with ease. Whether you're a new trader looking for clarity in the market or an experienced pro seeking additional confirmation, this indicator is your trusted companion.
Key Features of the Consecutive Gre

Buy CTS scalping indicator, provide buying and selling signals, automatic channeling and sending signals to mobile phones
Using technical analysis and price action methods and modern methods, CTS indicator can draw price channels and recognize price trends with high accuracy and issue entry and exit signals according to them. Traders can easily fluctuate using this indicator in different time frames and in different markets. With the CTS indicator, you can signal in different ways. This indicat
Buy DEMA 3 Scalp Indicator, Signaling and Trend Finder for Forex DEMA 3 indicator is a professional indicator for finding trends as well as finding entry and exit points for a symbol. This indicator is designed based on the DEMA indicator, which can tell you the signals accurately and quickly. The DEMA 3 indicator can give you accurate and early entry points for swings. Features of the DEMA indicator 3
Receive signals as notifications on the Metatrader mobile application. Receive signals by em
Linear regression AI powered Indicator: Linear regression is a simple yet effective AI technique that is the foundation of complex neural networks, This indicator is built based on linear regression analysis and tries to make predictions on the upcoming event in the market Inputs : train_bars: This controls the number of bars that the price information will be collected and used to train the AI inside it, The greater this value the better also the slower the indicator becomes during initializati

The best quality application of the famous Super Trend indicator that requires no introduction. It is completely faithful to the original algorithm and powered by the CCI indicator.
- easy to trade - It implements all kinds of warnings. - It implements a multi-timezone dashboard. - It cannot be repainted or backpainted.
Input parameters - ATR Period – This is the average true range period. - ATR Multiplier - The ATR multiplier that defines the trend. - CCI - Makes trend following powerful. -
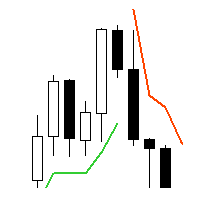
Supertrend - невероятно мощный и универсальный индикатор, предназначенный для помощи трейдерам в определении текущего тренда на конкретном торговом инструменте. С помощью двух встроенных индикаторов, Average True Range и Standard Deviation, трейдеры могут выбрать наиболее подходящий индикатор для своей стратегии торговли. Пользователи также могут настроить период этих индикаторов и выбрать цену (Close, High, Low, Open, Weighted), к которой он должен быть применен, с Typical price в качестве опци

Heikin Ashi Heikin Ashi is a charting technique that can be used to predict future price movements. It is similar to traditional candlestick charts. However, unlike a regular candlestick chart, the Heikin Ashi chart attempts to filter out some of the market noise by smoothing out strong price swings to better identify trend movements in the market.
To create Heiken Ashi, a formula is used in which price data is entered, while ordinary candles are built only on bare numbers, without using any

An invention that will turn your working principles upside down.
Especially in horizontal and stagnant markets, annoying losses can occur.
Besides, following trend lines, support and resistance can be tiring.
To put an end to all this, I decided to create a professional "moving average" indicator.
All you have to do is follow the colors.
If you need additional support, I recommend the "Heiken-Ashi" candle indicator in my profile.
I wish you lots of profit..

Description: Dimatis Watchtower is a powerful backtesting tool designed for traders seeking for an efficient way to test and optimize their trading strategies on the MetaTrader 5 platform. With a minimalist interface and advanced features, this tool provides an outstanding solution for evaluating the performance of your strategies in various market conditions. Key Features: Backtesting: Perform precise and reliable backtests of your strategies using historical data from your broker directly on M

Supertrend is a trend following indicator based on the Average True Range (ATR) . Calculating the odd line combines trend detection and volatility. It can be used to detect changes in trend direction and position stops.
Basic knowledge Supertrend is a trend following indicator. It takes up space on the main chart and its plots show the current trend. A Supertrend can be used for varying durations (daily, weekly, intraday, etc.) and varying instruments (stocks, futures or forex). Super

Certainly! Let’s discuss the RSI Rush , an aggressive momentum indicator that combines weighted moving averages (WMAs) at lows, mid-price, and tight highs. Here are the key components: Weighted Moving Averages (WMAs) : The RSI Rush employs three WMAs: WMA at Lows : Calculated based on the lowest prices during a specific period. WMA at Mid-Price : Considers the average price (midway between highs and lows) during the same period. WMA at Tight Highs : Based on the highest prices during the speci

Breakouts with strong momentum are challenging to catch. The purpose of the Super Breakouts Monitor is to identify such market conditions. This indicator is inspired by a concept from renowned Technical Analyst Tushar Chande, who combines two highly adaptive indicators, VIDYA and the Dynamic Momentum Index (both his creations), to capture the early stages of a successful breakout. At Minions Labs, we've added our unique enhancements to adapt these great ideas for modern markets like stocks, cryp

Moving Average Scanner è uno scanner multi-timeframe perfetto per vedere la tendenza su diversi intervalli di tempo a colpo d'occhio senza modificare il grafico.
Può utilizzare fino a 4 medie mobili a tua scelta su 9 unità di tempo. È completamente configurabile e può essere spostato in qualsiasi punto del grafico semplicemente “trascinando e rilasciando”.
Le medie mobili possono essere configurate in 4 diversi metodi di calcolo. Puoi anche impostare avvisi in base al numero di medie mobil
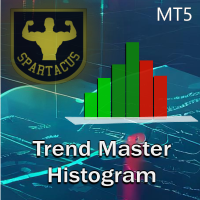
Trend Chart Histogram è un indicatore basato su un algoritmo che utilizza due medie mobili e diversi oscillatori. Grazie al suo codice colore, consente di identificare rapidamente la tendenza e sfruttare i maggiori impulsi del mercato. I colori chiari indicano la tendenza, i colori scuri definiscono gli impulsi e il grigio indica che non dovresti entrare nel mercato.
Versione MT4 qui.
Parametri di input:
- Periodo 1 (periodo veloce)
- Periodo 2 (periodo lento)
- Periodo dell'oscillato
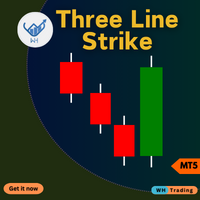
Indicatore di strike a tre linee per MetaTrader 5 (MT5). Questo strumento avanzato è progettato per aiutarti a identificare potenziali inversioni di mercato con precisione e facilità.
Che tu sia un principiante o un trader esperto, questo indicatore può migliorare le tue decisioni di trading e massimizzare i tuoi profitti. Contact me after purchase for guidance Caratteristiche principali: Segnali di inversione accurati : rileva potenziali inversioni di tendenza in base al modello di strike

Subscribe to the 'MA7 Trading' channel to receive notifications about new programs, updates and other information. Ask questions in the profile on the MQL5 .
Description of work
The 'MA7 Clover' indicator is based on candle shapes. Shows the 'Pin Bar' candle pattern. Detailed information about the 'MA7 Clover' indicator.
Indicator settings
General settings: Min body size ; Max body size ; Min nose size ; Max nose size .
Message settings: Send message to the terminal (Alert) – permission
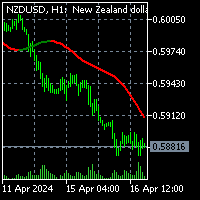
To download MT4 version please click here. - This is the exact conversion from TradingView: "Sentiment Range Ma" By "ChartPrime". - This is a non-repaint and light processing load indicator - You can message in private chat for further changes you need. - All input options are available. - Buffers are available for processing within EAs. - Highlight option is omitted as does not show good in Metatrader.

To download MT4 version please click here .
- This is the exact conversion from TradingView: " PA-Adaptive Hull Parabolic " By "Loxx".
- This is a non-repaint and light processing load indicator
- You can message in private chat for further changes you need.
- All input options are available.
- Buffers are available for processing within EAs.
- Highlight option is omitted as does not show good in Metatrader.

This DYJ PowerSignalSource is a complete trading system based on ATR technical indicators. This indicator will analyze and record the trend intensity of each cycle and current currency pair from M1-MN
DYJ PowerSignalSource creates a trend intensity and entry point signal list display by evaluating this data. When the trend percentage reaches 75% or greater, we consider it a strong currency. If the trend intensity percentage reaches 100%, we consider it the strongest, and a warning will pop up
Vuoi avere successo nel mercato Forex? Il nostro innovativo indicatore AI Swing Trading è la tua chiave segreta per un trading di successo e redditizio. Ti presentiamo questo strumento unico:
Il nostro indicatore è dotato di una rete neurale integrata che consente di analizzare enormi quantità di dati, identificare i cambiamenti e prevedere i movimenti dei prezzi. Questa tecnologia ti consente di prendere decisioni di trading informate basate su un'analisi di mercato approfondita. L'algor
L'indicatore MA Killer è l'arma definitiva per i trader che utilizzano le medie mobili. Si tratta di un sistema completo che si avvale di numerosi strumenti accessibili direttamente da un pannello di gestione. Grazie ai suoi strumenti hai una panoramica del mercato e un prezioso aiuto nel processo decisionale per l'ingresso in una posizione.
Consiste:
- L'indicatore Trend Master chart che visualizza la tendenza direttamente sul grafico utilizzando un codice colore. Questa tendenza è calcol
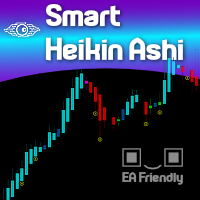
Heikin Ashi candlesticks smooth out the price data to help traders spot trends and patterns in the market. By averaging the price values, these candlesticks provide a clearer visual representation, making it easier to identify trends and predict future movements without the noise of standard candlesticks. We at Minions Labs are revisiting this topic because of our fellow Swing Traders, who love Heikin Ashi.
WHY SHOULD I CARE about the Smart Heikin Ashi? The Smart Heikin Ashi is an innovative
Welcome to the next level of trading sophistication with the Bollinger Bands Scanner for MT5! Elevate your trading experience and unlock enhanced insights and efficiency with our powerful MT5 indicator. Key Features: Effortless Bollinger Bands Scanning: Seamlessly harness the power of the Bollinger Bands Scanner to scan multiple assets effortlessly. Receive instant alerts when specific Bollinger Bands conditions are met, ensuring you're always ahead of market movements. Comprehensive Dashboard I
L'indicatore RSI Pro Analyser è un potente strumento progettato per i trader che desiderano prendere decisioni informate su più intervalli di tempo contemporaneamente. Questo indicatore utilizza l'RSI per fornire segnali di ipercomprato, ipervenduto e di tendenza, rendendo più semplice identificare le opportunità di ingresso nel mercato. Il suo vantaggio principale è la facilità di lettura grazie ai codici colore chiari e distinti per indicare le diverse condizioni di mercato.
L'indicatore mo
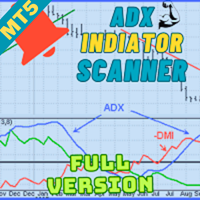
Welcome to advanced trading with the ADX Multicurrency Scanner for MT5! Elevate your trading experience with our powerful MT5 indicator, meticulously designed to offer seamless currency scanning and real-time insights. Key Features: Effortless Multicurrency Scanning: Unlock the full potential of the ADX Multicurrency Scanner for MT5 by effortlessly scanning multiple currencies. Receive instant alerts when specific conditions are met, ensuring you stay ahead of the market and capitalize on every
The DYJ StochasticSignalSource is displayed as two lines. The main line is called %K. The second line, called %D, is a Moving Average of %K. The %K line is usually displayed as a solid line and the %D line is usually displayed as a dotted line. There are several ways to interpret a Stochastic Oscillator. four popular methods include: Buy when the Oscillator (either %K or %D) falls below a specific level (for example, 20) . Sell when the Oscillator rises above a specific level (for example, 80)
Welcome to the world of advanced trading with the MACD Multicurrency Scanner for MT5! Elevate your trading experience with our powerful MT5 indicator meticulously designed for seamless analysis and real-time insights. Key Features: Effortless MACD Scanning: Unlock the full potential of the MACD Multicurrency Scanner for MT5 by effortlessly scanning multiple currency pairs. Receive instant alerts when specific Moving Average Convergence Divergence (MACD) conditions are met, ensuring you stay ahea

This indicator obeys the popular maxim that: "THE TREND IS YOUR FRIEND" It paints a Blue line for BUY and also paints a RED line for SELL. (you can change the colors). It gives alarms and alerts of all kinds. IT DOES NOT REPAINT COLOR and can be used for all currency pairs and timeframes. Yes, as easy and simple as that. Even a newbie can use it to make great and reliable trades. https://www.mql5.com/en/market/product/115553
Scopri come acquistare un robot di trading dal MetaTrader Market, il negozio di applicazioni per la piattaforma MetaTrader.
Il sistema di pagamento di MQL5.community supporta le transazioni tramite PayPal, carte bancarie e gli altri sistemi di pagamento più diffusi. Per essere pienamente soddisfatto, ti consigliamo vivamente di testare il robot di trading prima di acquistarlo.
Ti stai perdendo delle opportunità di trading:
- App di trading gratuite
- Oltre 8.000 segnali per il copy trading
- Notizie economiche per esplorare i mercati finanziari
Registrazione
Accedi
Se non hai un account, registrati
Consenti l'uso dei cookie per accedere al sito MQL5.com.
Abilita le impostazioni necessarie nel browser, altrimenti non sarà possibile accedere.