Conheça o Mercado MQL5 no YouTube, assista aos vídeos tutoriais
Como comprar um robô de negociação ou indicador?
Execute seu EA na
hospedagem virtual
hospedagem virtual
Teste indicadores/robôs de negociação antes de comprá-los
Quer ganhar dinheiro no Mercado?
Como apresentar um produto para o consumidor final?
Indicadores Técnicos para MetaTrader 5 - 27
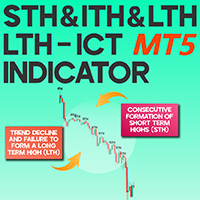
STH, ITH & LTH ICT Indicator for MT5 – Free Download The STH, ITH & LTH Indicator is a specialized ICT tool designed for MetaTrader 5 (MT5) , utilizing Advanced Market Structure to identify key price highs across multiple timeframes. This indicator pinpoints short-term (STH), mid-term (ITH), and long-term (LTH) highs , providing traders with a broader perspective on market movements and price action behavior. «Indicator Installation & User Guide» MT5 Indicator Installation | STH & ITH & LTH IC
FREE

The Magic SMMA indicator is of great help in determining trend direction. It can be an excellent addition to your existing strategy or the basis of a new one. We humans can make better decisions when we see better visually. So we designed it to show a different color for rising and falling trends. Everyone can customize this in the way that suits them best. By setting the Trend Period, we can optimize it for longer or shorter trends for our strategy. It is great for all time frames.
IF YOU NEE
FREE

Indicador "Fair Value Gap" (FVG) - Descubra o Poder das Descontinuidades de Mercado O mundo do trading está repleto de oportunidades ocultas, mas somente aqueles que possuem as ferramentas certas conseguem identificá-las e aproveitá-las de forma eficaz. O nosso Indicador FVG foi projetado para ajudá-lo a fazer exatamente isso. Se você é um trader que busca aprimorar sua capacidade de leitura do mercado e identificar os melhores pontos de entrada e saída, o Indicador FVG é o seu aliado perfeito.

The technical indicator Trend Strength Analyzer measures the deviation of the price of an instrument from average values over a specific period of time. A comparative analysis of the relative strength of bulls and bears underlies the indicator. If bulls prevail, an upward trend. If bears are stronger - a downward trend.
Settings:
Strike Energy (2 solid lines) = 14.
Influence Power (2 dotted lines) = 50. The TSA oscillator is effective in an active market. The most commonly used indicator
FREE

Hi All ! I want to share with you my favorite indicator to identify strong trend bias. It helps me a lot with my entries and exits. You can use it on any market and any instrument. It works best on daily tiimeframe 1D but you can also use it on 1H and be carefull with lower timeframes This indicator uses MACD, RSI and Stoch. The idea is simple, when MACD crosses above a Signal line and RSI > 50 and Stoch > 50 we consider the trend is going UP on the opposite we consider its DOWN Feel free to us
FREE

This MT5 alert is designed to identify potential buying opportunities based on several technical indicators and price action patterns. Here's how it works: Buy Conditions 1. RSI Condition: The Relative Strength Index (RSI) for the current period is below a specified low threshold (RsiLow). This indicates oversold conditions.
2. Candlestick Pattern: It checks for a specific candlestick pattern across three consecutive candles: - The current candle (1) closes higher than it opens (bulli
FREE

Investment Castle Support and Resistance Indicator has the following features: 1. Dictates the direction of Buy or Sell trades based on Support and Resistance Levels automatically . 2. Candles stick colors will change to Red for Sell and Blue for Buy (Default settings, user can change from the inputs). 3. This indicator is built-in the Support & Resistance based Investment Castle EA which works with Psychological Key Levels "Support & Resistance".
FREE
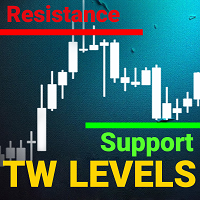
support resistance levels indicator mt5:
Esta ferramenta é um indicador de múltiplos períodos que identifica e traça linhas de suporte e resistência, assim como níveis de Fibonacci, em um gráfico com a mesma precisão que o olho humano. Os níveis de suporte e resistência TW para forex possuem um algoritmo complexo que escaneia o gráfico para identificar níveis anteriores de estabilização de preços e rebounds, registrando o número de toques.
Você está cansado de desenhar manualmente os níveis d

Inicialmente este indicador foi elaborado e pensado para rastrear pontos ou velas onde há força de tendência. Como nas grandes descobertas, cheguei ao indicador que mostra principalmente velas de reversão, pontos de tensão, alta liquidez, resistência. O indicador traz simplificação ao gráfico, indicando todos os pontos onde possivelmente teríamos lta´s, ltb´s, médias móveis, bandas, ifr alto. O indicador não faz o gerenciamento de risco, apenas mostra as velas onde podem ocorrer reversão. Lembre
FREE
BBTrend is a powerful trend analysis tool designed to provide a clear overview of market volatility and trends at a glance.
This indicator calculates the difference between two Bollinger Bands of different periods,
visually indicating the strength of upward or downward trends to traders. Clear Trend Visualization: The upward trend is represented in green, and the downward trend in red,
allowing traders to intuitively grasp the direction and strength of the trend. Standardized Percentage Disp
FREE
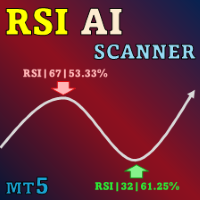
Special offer : ALL TOOLS , just $35 each! New tools will be $30 for the first week or the first 3 purchases ! Trading Tools Channel on MQL5 : Join my MQL5 channel to update the latest news from me Apresentamos o revolucionário RSI Kernel Optimized com Scanner para MT5, uma ferramenta inovadora que redefine a análise tradicional do RSI ao integrar o poderoso algoritmo de Estimativa de Densidade Kernel (KDE). Este indicador avançado não apenas fornece informações em tempo real sobre

Tough Position Panel - Real-Time Position Insights Overview: Enhance your trading experience with the Trade Info Panel , a powerful and lightweight indicator for MetaTrader 5. This tool provides real-time insights into your open positions directly on your chart, keeping you informed at all times. Whether you're a beginner or a seasoned trader, this panel ensures you never lose track of your trades. Key Features: Always-Visible Panel: Displays critical trade information in the upper-right corner
FREE

Non-proprietary study of Joe Dinapoli used for trend analysis. The indicator gives trend signals when the fast line penetrates the slow line. These signals remain intact until another penetration occurs. The signal is confirmed at the close of the period. It is applicable for all timeframes. Inputs lnpPeriod: Period of moving average. lnpSmoothK: %K period. lnpSmoothD: %D period. ********************************************************************************
FREE

Maximum Minimum Candle indicator is a basic indicator (but useful) that shows the highest and lowest candle in a period of time .
The indicator shows the maximum candle and the minimum candle for a defined period of time. You can choose the number of candles that make up the period The indicator will show with color points the maximum and minimum values. A message tells you when the price reaches the maximum or minimum.
Parameters number_of_candles: It is the number of candles that will be c
FREE

VTrende Pro - MTF indicator for trend trading with a display panel for MT5 *** Videos can be translated into any language using subtitles (video language - Russian)
Although the signals of the VTrende Pro indicator can be used as signals of a full-fledged trading system,
it is recommended to use them in conjunction with the Bill Williams TS.
VTrende Pro is an extended version of the VTrende indicator. Difference between Pro version and VTrende:
- Time zones
- Signal V - signal 1-2 waves
- S

The "Price change from zero" indicator is designed to display price changes over a selected period in points.
1. The basic idea The indicator calculates the difference between the closing price on the current bar and the opening price on the bar set back by the Candle Period. The result is displayed as a line in a separate window.
2. Interpretation Positive value: The price has increased over the period.
Negative value: The price decreased during the period.
Zero value: The price has retur
FREE

Este indicador permite que você transforme a aparência do seu gráfico aplicando uma transição suave entre duas cores personalizáveis para o fundo. Esse efeito de gradiente chamativo dá ao seu gráfico uma aparência nova e moderna, tornando-o mais visualmente atraente. O gradiente é aplicado a todas as janelas de indicadores atualmente no seu gráfico quando o indicador é anexado e também afetará quaisquer novas janelas de indicadores adicionadas posteriormente. Experimente e dê um novo visual aos
FREE

Based on the trend-following principle of CCI, it has been improved to become an indicator that can identify the reversal of the trend and its development direction, that is, it can identify the top and bottom attenuation of the oscillating trend in the trend market. feature The red and green columns represent the trend of bullish or bearish development under the current cycle. The blue line shows the position and attenuation of the current price trend in the current cycle. The upper and lower
FREE
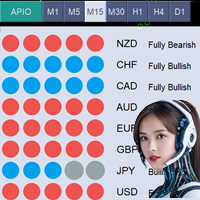
*O preço atual do produto é de $49 como oferta por tempo limitado; o próximo preço do All Power In One será de $99* Indicador Tudo-em-Um (APIO) O Indicador Tudo-em-Um (APIO) é uma ferramenta poderosa projetada para avaliar a força e a fraqueza das principais moedas, incluindo USD, EUR, GBP e outras. Ao analisar os movimentos e direções de diferentes pares de moedas dentro de um intervalo de tempo selecionado, o APIO fornece aos traders informações claras sobre a força das moedas e possíveis opo

The MetaTrader 5 Position Indicator is a custom technical tool designed to enhance traders' ability to monitor and manage their positions effectively. It displays key trade details such as stop-loss (SL), take-profit (TP), groups them where they are the same, average buy price, and average sell price directly on the chart. The indicator will automatically update every 500ms, ensuring real-time position tracking. Key Features:
Displays TP and SL levels
Groups TP and SL levels where they are the
FREE

The indicator draws a normal chart by coloring it in colors based on prices calculated by the Heiken Ashi indicator algorithm.
That is, the shape of the candles does not change.
In fact, this is the same Heiken Ashi that does not distort the price chart.
Then there will be a drawing of a cat, because there is nothing more to write about the indicator. .
FREE

Media Band é um indicador que projeta 8 bandas paralelas a uma media movel de referencia. Podendo auxiliar na visualização da volatilidade do mercado financeiro. Este indicador foi inspirado na necessidade de avaliar melhor uma boa oportunidade de compra e venda dos ativos de acordo com o "seu" operacional. Não pode ser utilizado como recomendação e sim a fins de estudos do Mercado Financeiro.
FREE
The Day Trading Price Pattern indicator is an indicator of entry points that searches for and displays Price Action system patterns on dozens of trading instruments and on all standard time frames: (m1, m5, m15, m30, H1, H4, D1, Wk, Mn). Show all the main Price Patterns are introduced in the Ebook Day Trading With Price Action - Galen Wood You won't never miss any potential trading setup.
Want to send all the signals to your Telegram Channel? Checkout this guide
Advantages
1. Patterns: Tre
FREE
The Multi Strategy Ranges Indicator MT5 is a powerful tool designed to detect and visualize price consolidation zones in the market. This indicator identifies ranges and draws them on the chart, providing clear signals for efficient trading. Key Features Our indicator incorporates three essential strategies for trading within consolidation ranges: Range Breakout Strategy: A classic range breakout strategy . When the price breaks the upper or lower boundary of the range, a buy or sell signal
FREE

Trend Reversal alert: The concept of the EA is to give you a message/alert when something happens in the market, so you will never pass a tradechance for a trendreversaltrade. The EA give you the message when the chance is higher for a trendreversal, but it is important to say that this doesn`t mean that you should trade every signal. The advantage provided by the program is that you don`t need to sit the hole time for the PC and look at the chart because you get a message when a good trendrever
FREE

O WA Order Block FVG bos MT5 é um indicador com base no estudo de SMC (Smart Money Concepts) criado pelo ICT Inner Circle Trader, eleplota no seu gráfico as informações de Order Blocks em 3 tempos gráficos diferentes, fair Value Gaps e Regiões de Liquidez além do BOS ( Break os Structures), tudo em um só indicador. Dessa forma você não precisa colocar essas informações de forma manual. Agora você tem tudo isso de forma automática em seu gráfico.

O Índice de Força Relativa (RSI), desenvolvido por J. Welles Wilder, é um oscilador de momento que mede a velocidade e a mudança dos movimentos de preços. O RSI oscila entre zero e 100. Adicionamos ao conceituado indicator RSI vários tipos de alertas e um filtro de intervalo entre os sinais para ser incorporado em rôbos. *Funciona em todos os timeframes e instrumentos.
Funcionalidades do produto
E-mail alert Alerta Sonoro Push Notificação (Alerta pode ser enviado ao seu celular) Sinais no cha

The Volume Spread Analysis indicator is based on the original Volume Spread Analysis method. It was designed for quick and easy recognition of VSA patterns. Even though this indicator looks very simple, it is the most sophisticated tool we've ever made. It is a really powerful analytical tool that generates very reliable trading signals. Because it is very user-friendly and understandable, it is suitable for every type of trader, regardless of his experience.
What is VSA? VSA - Volume Spread A

FREE

The ICT Silver Bullet indicator is inspired from the lectures of "The Inner Circle Trader" (ICT) and highlights the Silver Bullet (SB) window which is a specific 1-hour interval where a Fair Value Gap (FVG) pattern can be formed. A detail document about ICT Silver Bullet here . There are 3 different Silver Bullet windows (New York local time):
The London Open Silver Bullet (3 AM — 4 AM ~ 03:00 — 04:00)
The AM Session Silver Bullet (10 AM — 11 AM ~ 10:00 — 11:00)
The PM Session Silver Bullet (
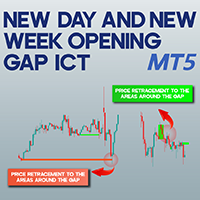
New Day and New Week Opening Gap ICT NWOG NDOG MT5 The New Day and New Week Opening Gap ICT NWOG NDOG MT5 indicator is a powerful and practical tool designed for traders using MetaTrader 5. It helps detect price gaps that emerge at the start of a new trading day or week, making them visible on the chart. When the market closes at the end of a session, the reopening price may differ from the previous close, leading to a price gap. This indicator marks weekly price gaps ( NWOG ) in red and daily p
FREE

The ATR (Average True Range) Indicator is a powerful tool designed to measure market volatility. This indicator provides accurate data on price movement ranges, helping traders manage risk more effectively and make well-informed trading decisions. Based on the widely-used ATR indicator, it’s suitable for both professional and beginner traders to analyze market volatility. The ATR Indicator allows you to track the current price movement range and use this information to set stop-losses, select en
FREE

The fractal indicator shows the latest support and resistance levels. If the price breaks through the level and is fixed, the indicator draws a rhombus of yellow or crimson color signaling a possible continuation of the movement towards the breakdown.
Indicator Settings:
- BarCount: sets the minimum number of bars required to build a fractal.
It is better to use the indicator in conjunction with other indicators.
FREE

Es un indicador que no se repinta y que muestra la tendencia a corto plazo. contiene lo siguiente: Visual Mode MA Period MA Method MA Price
ATR Period Volatility Factor Offset Factor Use Break Use Envelopes Use Alert
cualquier sugerencia hagamelo saber en los comentarios y también colocar estrellas para postear más contenido, indicadores y advisor actualizadas
FREE

Помощник для торговой системы SystZ . Чертит трендовые линии по соседним экстремумам зигзага. Условие для линии сопротивления - правый должен быть ниже левого. Для линии поддержки - правый выше левого. Не допускается, чтобы между экстремумами, по которым проводится трендовая линии были другие. Экстремумы, удовлетворяющие этим условиям, отмечены символом фрактала. Закрытие свечи за линией - сигнал для открытия позиции.
FREE

O indicador colorline mostra a linha do preço da média móvel no gráfico. A linha tem cores diferentes (100 barras têm a mesma cor). As configurações de cores da linha muda a cada 5 ticks, há 3 esquemas de cores. Indicador para demonstrar o estilo DRAW_COLOR_LINE. Desenha uma linha nos preços de fechamento em peças coloridas de 20 barras. A espessura, estilo e cor das seções de linha são alterados aleatoriamente. O código do indicador é publicado na documentação MQL5 na seção Estilos de indicado
FREE

Данный индикатор показывает объем каждого бара (видимый диапазон) в пунктах. Гибкие настройки отображения значений. Возможна настройка параметров показа. Индикатор создавался для личного пользования, анализа графиков. Параметры: Color - цвет текстовых меток; Position - позиция метки: 0 - снизу, 1 - сверху; FontSize - размер шрифта; Angle - угол наклона текста; GapPoints - отступ по вертикальной оси.
FREE

This is a multi-timeframe indicator that detects and displays support and resistance (S&R) lines using the ZigZag indicator.
Features
The support and resistance lines are not redrawing. The indicator is capable of adding new support and resistance levels as they appear. Each S&R line has a tooltip that displays the price level and start time. Save time for multi-timeframe analysis on trades. All types of alerts (sound, pop-up, email, mobile push notification) are available. Working with all p

Market Heartbeat is in your hand! Introduction The Market Heartbeat indicator with a special enhanced algorithm (volume, money flow, cycle of market and a secret value) is a very repetitive trend finder with a high success rate . Interestingly, this Winner indicator indicates that the trend has changed its direction or the end of a trend retracement or even appears at the range market. The Market Heartbeat can use in scalping trading or trend trading. It finds immediately with alarm, n

This indicator is a zero-lag indicator and displays exact trend as is. True Trend Moving Average Pro works best in combination with True Trend Oscillator Pro that displays strength of trend change.
True Trend Oscillator Pro: https://www.mql5.com/en/market/product/103589
If you set PERIOD input parameter to 1 this indicator becomes a sharpshooter for binary options.
Default input parameters: TT_Period = 10; TT_Meth = MODE_SMA; TT_Price = PRICE_MEDIAN;
Before you buy this product, please do t
FREE

If you have difficulty determining the trend as well as entry points, stop loss points, and take profit points, "Ladder Heaven" will help you with that. The "Ladder Heaven" algorithm is operated on price depending on the parameters you input and will provide you with signals, trends, entry points, stop loss points, take profit points, support and resistance in the trend That direction.
Helps you easily identify trends, stop losses and take profits in your strategy! MT4 Version: Click here Fea
FREE

https://www.mql5.com A double moving average indicator This indicator uses the system's own two different time period of moving average indicators to reflect the movement of market prices. It is recommended that you use the default parameter Settings, which you can set according to your own experience to get the best predictive power. I hope it can provide some help for your trading.
FREE

MACD Scanner provides the multi symbols and multi-timeframes of MACD signals. It is useful for trader to find the trading idea quickly and easily. User-friendly, visually clean, colorful, and readable. Dynamic dashboard display that can be adjusted thru the external input settings. Total Timeframes and Total symbols as well as the desired total rows/panel, so it can maximize the efficiency of using the chart space. The Highlight Stars on the certain matrix boxes line based on the selected Scan M

TrendFriendIndi – Your Smart Trading Companion for Precise Signals! Free for the first 50 activations! Are you looking for a reliable & precise indicator to support your trades? The TrendFriendIndi combines trend analysis, confirmation signals & intelligent risk management to show you the best buy and sell opportunities directly on the chart! Features & Benefits:
Timeframes: All - The higher the more precise! Clear buy & sell signals → Green arrows for BUY , Red arrows for SELL
FREE

Chaikin Money Indicator (CMF) – Free Trading Indicator
The Chaikin Flow Indicator (CMF) is a technical analysis tool based on the original Chaikin Money Flow (CMF) indicator, developed by Marc Chaikin in the 1980s. It is designed to track capital flows into an asset and helps identify buying and selling pressure. This indicator is useful for both intraday trading and medium-term analysis .
How CMF Works CMF analyzes price action and volume over a given period by calculating the Money Flow Mult
FREE

Bill Williams' divergent bar with angulation. The angle between the green line and the top/bottom of the bar is used as an angle, which basically corresponds to the updated recommendations from Justin Williams Angulation for the Wiseman Bullish and Bearish Divergent Signal Bar - YouTube . The default settings of the angle of 85 and 21 bar from the moment of crossing the lip line of the Alligator work quite well. If you use this indicator in real trading, I highly recommend not to engage in day
FREE

The Commitments of Traders Ratio Indicator is one of these things you never thought about it before you really see the magic behind it. The indicator shows the Ratio of long/short positions released by the CFTC once a week.
If you have a look on the Sreenshot you can see two (three) zones of interest. Important note: MAs are not available in version 1.0. Zone 1: The Switches (Red -> Green, Green -> Red) Zone 2: MA cross Zone 3: If you combine this with the COX indicator an additional zone will
FREE

Este poderoso indicador analisa o gráfico e mostra zonas de Rejeição de Preços! Isto é, locais onde o preço foi, mas não foi aceito pelo mercado! A visualização desta zona de Rejeição, facilita o entendimento do trader na tomada de decisões de onde operar e como operar!
O indicador é composto por 4 linhas, sendo classificadas em 2 grupos: Linhas Vermelha e Amarela: Denotam os extremos onde o preço conseguiu chegar, mas não foi aceito! Linhas Laranja e Azul: A partir delas, denotam o Início da z
FREE

VWAP FanMaster: Encontre as Melhores Oportunidades com Precisão!
O VWAP FanMaster é o indicador definitivo para traders que buscam entradas precisas e pullbacks eficientes . Ele combina o poder do VWAP (Volume Weighted Average Price) com as linhas de Fibonacci Fan , fornecendo um mapa claro das zonas de interesse no mercado. Principais Recursos Simples e poderoso : Basta mover as linhas verticais para traçar automaticamente o VWAP e as linhas de Fibonacci Fan .
Estratégia eficiente
FREE
Special offer : ALL TOOLS , just $35 each! New tools will be $30 for the first week or the first 3 purchases ! Trading Tools Channel on MQL5 : Join my MQL5 channel to update the latest news from me Desbloqueie o poder do aprendizado de máquina avançado com o Machine Learning Adaptive SuperTrend , um indicador de ponta projetado para se adaptar perfeitamente às condições de mercado em mudança. Ao integrar o agrupamento k-means com a metodologia SuperTrend, este indicador permite uma

Você é surfador de tendência que nem a gente? Usa médias móveis também? Já quis que a área entre elas fosse pintada? Pois é, resolvemos esse problema com o indicador Filled MAs ! Ele é muito simples, apenas coloca duas Médias Móveis no gráfico, totalmente personalizadas, e preenche de cor o espaço entre elas, mudando a cor conforme o cruzamento entre as mesmas. Agradeço ao gmbraz pela ideia da versão 1.1. Qualquer dúvida ou sugestão por favor me contate! Faça bom uso!
Este é um indicador grat
FREE

O Impulse System foi descrito pela primeira vez no livro "Come into my Trading Room". Ele usa a direção do histograma MACD e uma média móvel exponencial (MME) de preço para definir um impulso. A regra é nunca negociar contra o impulso.
Seu código de cores fornece vários sinais: Quando a MME e o histograma MACD estão subindo, as cores do sistema Impulse a cor da barra é verde (curto-circuito não é permitido). Quando a MME e o histograma MACD estão caindo, as cores do sistema Impulse a cor da ba

O indicador mostra divergência de alta e baixa. O próprio indicador (como o estocástico normal) é exibido em uma subjanela. Interface gráfica : Na janela principal, são criados objetos gráficos “linha de tendência” - produzidos a partir do preço “Mínimo” para o preço “Mínimo” (para divergência de alta) e produzidos a partir do preço “Alto” para o preço “Alto” (para divergência de baixa). ). O indicador desenha em sua janela exclusivamente utilizando buffers gráficos: “Principal”, “Sinal”, “Po
O Top Bottom Tracker é um indicador baseado em algoritmos sofisticados que analisa a tendência do mercado e pode detetar os altos e baixos da tendência / Versão MT4 .
O preço aumentará progressivamente até atingir 500$. Próximo preço --> $99
Características Sem repintura
Este indicador não altera os seus valores quando chegam novos dados
Pares de negociação
Todos os pares de forex
Timeframe
Todos os timeframes
Parâmetros ==== Configuração do indicador ====
Parâmetro de confi

BinaWin NoTouch is an indicator that sends an alert signal when the trade is in the right position to wait for the breakdown of a side market.
It is specially designed to trade under the “No Touch” strategy of the Binary.Com platform with synthetic indexes N.10, N.25, N.50, N.75 and N.100
Similarly, trading can be done with the conventional CALL and PUT strategy of any Binary Options platform.
Requirements to use the indicator:
1. Have an account at Binary.Com
2. Configure the Binary.Com d
FREE

The indicator is based on Robert Miner's methodology described in his book "High probability trading strategies" and displays signals along with momentum of 2 timeframes. A Stochastic oscillator is used as a momentum indicator.
The settings speak for themselves period_1 is the current timeframe, 'current' period_2 is indicated - the senior timeframe is 4 or 5 times larger than the current one. For example, if the current one is 5 minutes, then the older one will be 20 minutes The rest of the s
FREE

O ATR é uma medida de volatilidade introduzida pelo famoso autor J. Welles Wilder Jr. em seu livro "New Concepts in Technical Trading Systems".
Em geral, os traders estão acostumados a ver o ATR na forma de um indicador em uma sub-janela do gráfico. O que estou apresentando aqui é uma versão simplificada do ATR - apenas contendo o número atual do ATR - muito útil para monitorar apenas o momento atual do mercado.
Se você quiser monitorar vários tempos gráficos dentro do gráfico corrente, bast
FREE

O Escâner de Painel CCI do MT5 O Escâner de Painel CCI do MT5 é uma ferramenta que ajuda a monitorar os níveis do Índice de Canal de Commodities (CCI) em diferentes períodos e instrumentos, fornecendo alertas em tempo real quando uma nova sinalização é detectada. É fácil de usar e leve em poder computacional, garantindo um desempenho suave em qualquer computador. Principais Recursos Agrupamento Automático de Instrumentos : O escâner coleta todos os instrumentos da sua lista de Monitoramento de M
FREE

O indicador desenha automaticamente os níveis de Fibonacci com base no indicador ZigZag, sessões de negociação, fractais ou velas (incluindo períodos de tempo não padrão: ano, 6 meses, 4 meses, 3 meses, 2 meses) (Retração Fibo Automática). Você pode escolher qualquer período de tempo superior para o cálculo de Fibonachi. Os níveis são redesenhados sempre que a barra atual fecha. É possível ativar alertas ao cruzar os níveis especificados.
Você também pode analisar níveis no histórico. Para faz

Mini One for All Trend Scanner is a trend following multi-symbol indicator that can be used with any input: forex, stocks, commodities,... The panel shows three indicators and six symbols with the trend for every pair (symbol/indicator): up, down or no trend. The indicators are: Average Directional Movement Index (ADX) Moving Average Convergence Divergence (MACD) Relative Strength Index (RSI) You can change quickly the chart by clicking any one of the symbol button in the panel. This feature
FREE

Choose the best trading tool: The impact of news on the exchange rate of a currency pair! As a news source you can use: Terminal calendar or Investing.com website In the second case, you will additionally need the Get News5 utility. The indicator combines well with the Trade maker utility, providing multi-currency trading. Calculates: indices of the impact of current news on currency pairs, taking into account market expectations. actual trend directions for 5 customizable timeframes and levels

Acceleration Points-uma poderosa ferramenta de detecção de pontos críticos de movimento de preços, com base na idéia de calcular a aceleração das flutuações de preços.
_________________________________
Como usar os sinais indicadores:
O indicador forma um sinal após o aparecimento de uma nova barra de preços. Recomenda-se usar o sinal gerado após o preço romper o ponto crítico na direção especificada. O indicador não redesenha seus sinais.
_________________________________
Os parâmetros d
FREE

SHADOW vous donne des signaux d'achat et de vente solides avec un risque minimal. Vous pouvez voir dans quelle direction le prix évolue et la force du mouvement. Shadow filtre le bruit du marché et améliore radicalement les performances des traders.
Points forts: Détection visuelle efficace des tendances. Bruit du marché des filtres Ne repeint ni ne recalcule jamais. Signaux strictement sur "fermeture du bar". Fonctionne dans tous les symboles. Pop-up intégré, e-mail, notification push et
FREE

Modificação multimoeda e multitimeframe do indicador Índice de Força Relativa (RSI). Você pode especificar quaisquer moedas e prazos desejados nos parâmetros. Além disso, o painel pode enviar notificações ao cruzar níveis de sobrecompra e sobrevenda. Ao clicar em uma célula com ponto final, este símbolo e ponto final serão abertos. Este é o scanner MTF.
A chave para ocultar o painel do gráfico é “D” por padrão.
Semelhante ao Medidor de Força da Moeda, o Painel pode selecionar automaticamente

Bem-vindo ao HiperCube VIX Código de desconto de 25% na Darwinex Zero: DWZ2328770MGM
Este indicador fornece uma informação real de mercado de volume de sp500 / us500
Definição O HiperCube VIX, conhecido como Índice de Volatilidade CBOE, é uma medida amplamente reconhecida do medo ou do stress do mercado. Assinala o nível de incerteza e volatilidade no mercado bolsista, utilizando o índice S&P 500 como proxy para o mercado alargado. O Índice VIX é calculado com base nos preços dos contratos d
FREE

O Indicador Supertrend para MT5 é uma ferramenta poderosa de acompanhamento de tendências projetada para ajudar os traders a identificar a direção do mercado com precisão. Baseado no Average True Range (ATR) , ele se ajusta dinamicamente aos movimentos do preço, tornando-se adequado para diversos estilos de trading, como scalping, day trading e swing trading.
Principais características: • Detecção precisa de tendências – Identifica claramente tendências de alta e baixa com uma linha
FREE

A Market Palette é uma poderosa ferramenta de Filtragem de decisões de negociação baseada na inércia e na aceleração das flutuações de preços.
_________________________________
Como usar os sinais indicadores:
O indicador forma sinais de histograma, três cores diferentes. No esquema de cores padrão, quando aparecem colunas azuis, recomenda - se manter apenas posições longas, quando aparecem colunas vermelhas - apenas curtas, quando aparecem colunas cinzentas-abster-se de ações de negociação.
FREE

Indicador multimoeda e multitimeframe do Canal de Desvio Padrão. Exibe a direção atual do mercado. No painel você pode ver rompimentos e toques (por preço) dos níveis do canal de regressão linear. Nos parâmetros, você pode especificar quaisquer moedas e prazos desejados. Além disso, o indicador pode enviar notificações quando os níveis são atingidos. Ao clicar em uma célula, este símbolo e ponto final serão abertos. Este é o scanner MTF.
A chave para ocultar o painel do gráfico é “D” por padrã
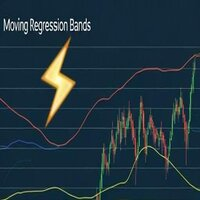
Moving Regression Bands - Indicador de Regressão Polinomial com Bandas Adaptativas
Descrição O MovingRegressionBands é um indicador técnico avançado que combina regressão polinomial com bandas adaptativas para identificar tendências e pontos de reversão no mercado. Utilizando cálculos matemáticos sofisticados, o indicador oferece uma visão mais precisa do movimento dos preços através de um modelo de regressão de ordem superior. Características Principais Regressão polinomial de ordem configuráv
FREE

O indicador Spread Pulse MT5 é uma ferramenta eficaz que fornece aos traders informações sobre o spread atual no gráfico. Spread é a diferença entre o preço de compra e o preço de venda de um instrumento.
O indicador é apresentado na forma de texto exibido no gráfico. Isto permite ao trader rastrear facilmente o spread atual.
Uma das principais vantagens do indicador Spread Pulse é a visualização de cores. Dependendo do tamanho da página espelhada, a cor do texto muda. Por padrão, quando
O Mercado MetaTrader oferece um local conveniente e seguro para comprar aplicativos para a plataforma MetaTrader. Faça download de versões de demonstração gratuitas de Expert Advisors e indicadores a partir do seu terminal para testes no Testador de Estratégia.
Teste os aplicativos em diferentes modos para monitoramento do desempenho e assim fazer um pagamento para o produto que você deseja, usando o sistema de pagamento MQL5.community.
Você está perdendo oportunidades de negociação:
- Aplicativos de negociação gratuitos
- 8 000+ sinais para cópia
- Notícias econômicas para análise dos mercados financeiros
Registro
Login
Se você não tem uma conta, por favor registre-se
Para login e uso do site MQL5.com, você deve ativar o uso de cookies.
Ative esta opção no seu navegador, caso contrário você não poderá fazer login.