Conheça o Mercado MQL5 no YouTube, assista aos vídeos tutoriais
Como comprar um robô de negociação ou indicador?
Execute seu EA na
hospedagem virtual
hospedagem virtual
Teste indicadores/robôs de negociação antes de comprá-los
Quer ganhar dinheiro no Mercado?
Como apresentar um produto para o consumidor final?
Expert Advisors Grátis e Indicadores para MetaTrader 5 - 26

https://www.youtube.com/watch?v=0T8Mge39Xsk&t=9s
Youtube
These EAs trade macd divergence only if there is a parabolic sar change at the same time. Sell bearish macd divergence & parabolic sar crosses above price Macd settings Threshhold is how far above / below zero divergence must occur. Timeframe used Parabolic sar settings
Only one trade in that direction can be opened at once. Trades on open bar Alerts , mt5 and mobile Stop loss and target points Stop loss is set to a % percentage of
FREE

Hi there! Since I am starting commercial and non-commercial product publishing I would highly appreciate: If you like this product, please rate it. That will help to promote not only this product, but indirectly another ones. So, such promotion will help to make some money from commercial products. Thus, I will have opportunity to fund my another directions of trading researches like bot development using mql4 and mql5 programming languages as well as python written products like crypto bots. If
FREE

This is a classic trading strategy based on two Moving Averages crossover. customized for usdjpy with a Good risk management strategy RR 1/2 . ( Long when fast MA crosses slow MA from below and Short when fast MA crosses slow MA from above ) TF : 5MIN MAX Lot size to use : 2% e.g : Balance =100 => lot size = 0.02 Balance =1000 => lot size = 0.20 Balance =10000 => lot size = 2
------
FREE

Q市价做空,W市价做多,E市价全部平仓。 持仓最大数量为1,即:禁止加仓。 ea的输入为手数,止损和最大滑点,不支持设置止盈。 专为短线吃一个小波段设计。 无论下单还是止损都会有提示声。 Q W E sell buy close
The Q key is short, the W key is long, and the E key is closed. The maximum number of positions is 1, i.e., it is forbidden to add positions. The EA's inputs are lots, stop loss and maximum slippage, and take profit is not supported. Designed for short-term swing trader. Play sound whenever position open or stoploss.
FREE

Just a panel for drawing levels. Minimal but very useful thing. This is a reimagining of Color Levels Pro. ---- 4 types of customized levels. support for rectangle and line levels. The indicator parameters are very simple and are divided into blocks. For any update idea please contact me here. ---- Extension version " Levels tool pro " ---- don't suffer don't suffer ---- Enjoy your work!!!!!!!! ----
FREE

Hyper DM, de Distanciamento das Médias Móveis é um indicador que permite você definir a distância em pontos das bandas de cima e de baixo em relação a média móvel do meio. O funcionamento dela é simples, tem parâmetros de configuração da média móvel do meio e baseado nela e nos parâmetros de distância definidos das bandas de cima e de baixo, é plotado no gráfico.
FREE

Donchian通道(唐奇安通道指标)是用于交易突破的最古老、最简单的技术指标之一。 一般来说,唐奇安通道的宽度越宽,市场波动就越大,而唐奇安通道越窄,市场波动性也就越小 。此外,价格走势可以穿过布林带,但你看不到唐奇安通道的这种特征,因为其波段正在测量特定时期的最高价和最低价。 交易实用必备工具指标 波浪自动计算指标,通道趋势交易 完美的趋势-波浪自动计算通道计算 , MT4版本 完美的趋势-波浪自动计算通道计算 , MT5版本 本地跟单复制交易 Easy And Fast Copy , MT4版本 Easy And Fast Copy , MT5版本 本地跟单复制交易 模拟试用 Easy And Fast Copy , MT4 模拟账号运行 Easy And Fast Copy , MT5 模拟账号运行 唐奇安通道指标计算: 唐奇安上阻力线 - 由过去N天的当日最高价的最大值形成。 唐奇安下支撑线 - 由过去N天的当日最低价的最小值形成。 中心线 - (上线 + 下线)/ 2 唐奇安通道信号 唐奇安通道常用作突破指标。它提供了两种主要类型的突破信号,一个是上阻力线或下支
FREE

Volume Cross Over is an indicator that measure positive and negative volume flow in a financial instrument, such as a stock, commodity, or index. It is base on the idea of On-Balance Volume developed by Joseph Granville. However instead of trending lines, this indicator shows volume cross over. When the closing price of an asset is higher than the previous closing price, then the Bull volume is greater than zero and Bear volume is negative. It suggests that buying volume is dominating, and
FREE

The GJ_H1_220100009_S_HD_CF_SQX_SL20 is an algorithmic trading strategy for MetaTrader, tested on GBPJPY using the H1 timeframe from April 1, 2004, to April 24, 2024. There is no need to set up parameters, all settings are already optimized and fine-tuned.
Recommended broker RoboForex because of EET timezone.
You can find the strategy source code for StrategyQuant at the link: http://quantmonitor.net/listing/gbpjpy-macd-trader/
Key details are:
Parameters
MagicNumber: 220100009
M
FREE

FRB Candle Time
Indicador que mostra o tempo que falta para o próximo candle Você pode editar a cor e o tamanho da fonte. Para movimentar o tempo, basta clicar em cima e mover o mouse para onde você quiser deixá-lo. Após posicionar o tempo onde você deseja, clique novamente ou aperte "ESC" e o horário ficará onde você deixou.
Configuração Cor da Fonte Tamanho da Fonte Cor de Fundo
FREE

O ATR é uma medida de volatilidade introduzida pelo famoso autor J. Welles Wilder Jr. em seu livro "New Concepts in Technical Trading Systems".
Em geral, os traders estão acostumados a ver o ATR na forma de um indicador em uma sub-janela do gráfico. O que estou apresentando aqui é uma versão simplificada do ATR - apenas contendo o número atual do ATR - muito útil para monitorar apenas o momento atual do mercado.
Se você quiser monitorar vários tempos gráficos dentro do gráfico corrente,
FREE

O Termômetro de Mercado pode ser utilizado para ajudar os traders a identificarem períodos sonolentos ou turbulentos.
Ele auxilia os principiantes a verificar quando é o momento ideal para entrar nas operações, ou seja, quando o valor do termômetro está abaixo da sua média por vários períodos, identificando um mercado tranquilo. Quando o mercado está aquecido, ou seja, o termômetro está acima do triplo da sua média, é o momento de realizar lucros. O Termômetro mede até que ponto o extremo de u
FREE

Alerta para novo candlestick, o alerta aparece conforme o timeframe que ele for colocado. O indicador funciona em qualquer ativo, o alerta pode ser silenciado a qualquer momento, sem a necessidade de tirar o indicador do gráfico. É ótimo pra quem não pode ficar de olho no gráfico o tempo todo. Você pode utilizar essa ferramenta no trabalho, faculdade ou em qualquer outro lugar. Também é possível receber os sinais diretamente no seu celular a partir da conexão com o metatrader. Aurélio Machado.
FREE
The USDJPY Trader EA is an automated trend following system that is always in the market and trades using sell stop and buy stop orders with trailing stop losses to capture large movements in the market. It also includes a money management feature which calculates lot size based on account size and risk with an option to set a maximum draw down at which the EA will stop trading. This is a long term strategy combined with money management and will work on any pair but works best on USDJPY M15. Vi
FREE

This is a demo version of the Candle Absorption Full indicator. It has limitations on operation. This indicator detects the Engulfing candlestick pattern and draws the corresponding market entry signal.
Features It works only with EURUSD on timeframes M1 and M5. The indicator analyzes a combination of 2 or 3 candlesticks depending on settings. The number of pre-calculated bars (signals) is configurable. The indicator can send an alert to notify of a found signal. Signal can be filtered by sett
FREE

Trend Envelopes indicator is calculated based on a % of price change. That % is then used to determine if there is a new trend or trend remains the same.
This version is using Standard Deviation for the price change calculation instead and is adding prices smoothing prior to be used in calculations. The smoothing can be done using one of the 4 average types:
* Simple Moving Average
* Exponential Moving Average
* Smoothed Moving Average
* Linear Weighted Moving Average
Als
FREE

如果产品有任何问题或者您需要在此产品上添加功能,请联系我 Contact/message me if you encounter any issue using the product or need extra feature to add on the base version.
Floating Highest Lowest MT5 provides you an intuitive and user-friendly method to monitor the floating highest (profit) and lowest (loss) that all your trades together ever arrive. For example, I opened 3 orders, which arrived at $4.71 floating profit when trade following trend. Later when the trend is against me, these 3 orders arrive $30 in loss, and
FREE

Description: Protect your live or evaluation accounts by not letting it hit the maximum daily draw down! This utility is best for prop firms such as FTMO and MFF(MyForexFunds) and etc. Guide: Apply to EURUSD 1m Chart.
Default Settings: Maximum Draw Down Balance: 4% Account Balance. Maximum Draw Down Equity: 4% Account Balance Target Profit Balance: 1% Account Balance. Target Profit Equity: 1% Account Balance. Time To Reset: 16:57 to 16:58 GMT
Behavior: Setting starting_balance to 0 will au
FREE
"AV BuyLow SellHigh EA" is an Expert Advisor for MetaTrader 5, which was created from the simple "AV Preview".
The original idea was to buy lower and sell higher from the last entry price. On request, I have developed it further and tried to remove its trend weakness. This EA is only the Minlot version to try out.
Strategy:
The size of a displayed rectangle is used to decide whether range trading is to be carried out (sell above, buy below) or trend trading (buy on rising, continue se
FREE

At first, I got my teeth into Phoenix Ultra Expert Advisor.
This Expert Advisor will support automatic close order if the direction is correct and perform recovery if the direction is wrong. If you enter an order: 1. The price goes in the right direction and hits the Min Profit Point , trailing stop 20% of the current profit. 2. The price goes in the opposite direction, the Expert Advisor will place the order with the volume is Recovery Volume Percent at the input, the distance t
FREE

The indicator makes calculations based on data obtained from one of seven (7) moving averages and colors the chart.
Simple moving averages are those that have only one important calculation parameter - the period.
The shift in the indicator is not used.
There is a shift trick setting, it is used to smooth the result of calculations. You can see the changes if you reduce this parameter to 1 (minimum value).
shift trick must always be less than the period value.
Available averages:
MA
FREE

Algo Edge EA This EA only SELL download the second EA for BUY and Run it both. -DE40/ Tec100 Self learning EA just set the EA on the Chart and Start no Settings optimization.
AUD/USD, EUR/USD, DE40, US30, Tec100 and much more. Multifunctional Expert Advisor can trade with every Forex Pair or Indize. EA can Trade with every Broker. M1 high, M30 medium, H1 low Risk. Functions: For other Indize example US30: Change the Robot Worktime in Europe to 16:30-21:30.
-inp1_ =Robot Worktime inp_2 and
FREE

This indicator uses the chart information and your inputs to display a calculated lot size and associated stop for long or short positions. It uses an ATR based percent volatility position sizing calculation and splits your account equity into two parts, each having its own risk percentage. The concept behind "Market's Money" is using a lower risk percentage for your base account equity and then using a higher risk percentage for any equity above your base equity. This lets you potentially grow
FREE

Backtesting PRO: Make a review of the market based on the available history of your broker. Practice your strategies and verify them in seconds. Remember to maintain excellent risk management, check your days and hours of operation. R emember to start it in the shortest period to operate. Any questions or suggestions can be sent to this email: autoeducacion0110@gmail.com
FREE

Indicador de Laguerre com Entrada Gamma Visão Geral: O Indicador de Laguerre é uma ferramenta avançada de análise financeira projetada para fornecer aos traders e investidores um método dinâmico e responsivo para acompanhar as tendências do mercado. Sua funcionalidade central baseia-se em um algoritmo único que se adapta à volatilidade do mercado, oferecendo insights mais claros em comparação com indicadores tradicionais. Característica Chave - Entrada Gamma: Gamma: A única entrada do Indicador
FREE

Hello,
This is an easy symbol change panel.
The free version only can change major pairs which are "AUDUSD, EURUSD, GBPUSD, USDCHF, USDCAD, USDJPY, NZDUSD"
The full version can add your symbols.
FULL version here:
https://www.mql5.com/en/market/product/71173?source=Site+Market+MT5+Indicator+New+Rating005#description
Also, can change the TimeFrame as well.
Symbols must be active on your Market Watch list.
Parameters:
ratio - change the size LineNumber - you can set that how
FREE

O indicador colorline mostra a linha do preço da média móvel no gráfico. A linha tem cores diferentes (100 barras têm a mesma cor). As configurações de cores da linha muda a cada 5 ticks, há 3 esquemas de cores. Indicador para demonstrar o estilo DRAW_COLOR_LINE. Desenha uma linha nos preços de fechamento em peças coloridas de 20 barras. A espessura, estilo e cor das seções de linha são alterados aleatoriamente. O código do indicador é publicado na documentação MQL5 na seção Estilos de indicado
FREE

Scalp using the behavior of a short moving average, the indicator gives the slope and identifies the "hyper" moments.
Operational advice:
Use M1 chart. Period 20 : open buy after two rising lows; sell after two max downhill; avoid countertrend openings; when the line goes flat put a stop at the opening price. Avoid actions in low volatility timeslots. When the curve that draws the min / max is very flat, it is better to postpone at least 15'.
Period 50 : matches the trend, when it is
FREE

The Point-Percent Price Channel (PPPC or PP Price Channel) indicator is designed to display on the chart a channel whose width is specified both as a percentage of the current price and in points. Its appearance is presented on slide 1. When the market moves up, the upper border of the channel is built at the price of High candles. In this case, the lower boundary follows the upper one at a strictly specified distance. When the price touches the lower border of the channe
FREE

This indicator displays the spread Simple and easy to use and fully customisable: View as Pips or Pipettes Chart symbol can be hidden Text display can be changed Change color and text styles Add or hide a decimal point Spacing options between inputs Default screen positions Screen position inputs
How to use 1. Simply use the default settings; or 2. Choose to show pips or pipettes; 3. Choose to display symbol, text or decimal; 4. Choose where to place it on the screen; 5. Save settings or save
FREE

La **Media Móvil de Tercera Generación (TGMMA)** es una versión avanzada del indicador estándar de **Media Móvil (MA)**. Fue descrita por primera vez por Manfred G. Dürschner en su artículo "Gleitende Durchschnitte 3.0" (en alemán). Aquí están las características clave de la TGMMA:
1. **Reducción del Retraso**: - A diferencia de las MAs tradicionales, la TGMMA reduce significativamente el retraso. Se adapta más rápidamente a los cambios de precios, lo que la hace ideal para traders que bus
FREE

The Indicator indicator draws 2 clouds based on Donchian Channels indicator values. The upper cloud is formed by the upper lines values and the lower cloud by the lowers lines values. The indicator allows to change the Channels parameters and the clouds colors the period of the base line and the multiplier of each Donchian Channels instance. The indicator holds 5 buffer index as follow: [0] - Outer values of the upper cloud [1] - Inner values of the upper cloud [2] - Base/Center line values [3
FREE

The indicator displays the value of ROC (Rate of change) from the selected price or moving average as a histogram. You can plot the moving average ROC values for smoothing indicator.
Displayed Data ExtROC - rate of change ExtMAROC - smoothing line
Parameters You can change the price, on which the indicator is calculated.
Inputs InpMAPeriod - in case you want to calculate the moving average ROC, enter averaging period. Enter 1 for the calculation of the specified prices. InpMAMethod - smoot
FREE

This indicator measures volatility in a multi-timeframe fashion aiming at identifying flat markets, volatility spikes and price movement cycles in the market. [ Installation Guide | Update Guide | Troubleshooting | FAQ | All Products ]
Trade when volatility is on your side Identify short-term volatility and price spikes Find volatility cycles at a glance The indicator is non-repainting The ingredients of the indicator are the following... The green histogram is the current bar volatility The
FREE
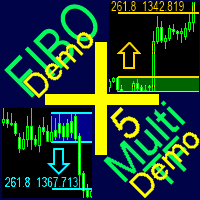
A ready-made multitimeframe trading system based on automatic plotting and tracking of Fibonacci levels for buying and selling any symbol. Demo version - calculation of the last 390 bars is not performed.
Advantages Determines the trend direction based on a complex of 14 indicators ( Cx ), extremums of ZigZag ( Z ), RSI ( R ), Impulse ( I ) Displaying the values of 14 indicators comprising the trend direction ( Cx ) Plotting horizontal levels, support and resistance lines, channels View the pl
FREE
This indicator allows to hide OBV (on all MT5 timeframes) from a date define by the user with a vertical line (Alone) or a panel (with "Hidden Candles"). Indicator Inputs: Apply To Information on "On Balance Volume" indicator is available here: https://www.metatrader4.com/en/trading-platform/help/analytics/tech_indicators/on_balance_volume ************************************************************* Hey traders!! Give me your feeds! We are a community here and we have the same objective....
FREE

This indicator shows the strength of each currency compared to the US dollar by calculating the rate of change in price over a specified time period. When you open the indicator, you'll see a list of different currencies on the price chart. Each currency will have a numerical value indicating its strength level compared to the US dollar, where: If the value is higher than the US dollar, it will be displayed in green, meaning that currency is stronger than the dollar. If the value is lower than t
FREE

We at Minions Labs always like to defy the stablished systems and beliefs trying new things and new ways of seeing and interpreting the Market Data. And all starts with the following question...
WHAT IF...
You give more relevance and focus on the Wicks/Shadows on the candlesticks? And Why? In volatile markets wicks play an important role on determining who is winning the the fight between Bulls and Bears , and more than that, Higher and lower wicks can present you with a good status of the cu
FREE

T-Wallpaper. This is a very useful wallpaper that comes with trade manager panel. You can choose any wallpaper of your choice. Must add the WallPaper file to your MQL5 Data Folder. Follow this easy steps: Download the WallPaper files from our channel https://www.mql5.com/en/channels/transitbk98 Open MT5 Select files Open Data Folder Open MQL5 Open Files and past the Wallpaper folder Now the wallpaper will display. Wallpaper settings are found on the user input. Trade panel settings are found on
FREE
Special Trailing Sl is a automatic trailing stop_loss. first It will try to free risk your trade then save the profits. first step is to move the SL 50 points below current price for long trades , and 50 points above current price for short trades.First step will happen when the trade get to minimum profit per point. second step : SL will follow the current price with a dynamic distance. This trailing stoploss has been used in my products.
FREE

Having a chart window that has multiple pairs (symbols), timeframes, and indicators displayed simultaneously can be quite advantageous. This indicator will allow traders to place multiple chart objects in a sub window of the main chart window. The indicator is capable of adding all available MT5 indicators and custom indicators to the existing chart. The list and parameters of the indicators are for reference at: https://www.mql5.com/en/docs/indicators
Input parameters Name
Example
Indicat
FREE

To get access to MT4 version please click here . This is the exact conversion from TradingView: "Candle body size" by "Syamay". This is a light-load processing indicator. This is a non-repaint indicator. Buffers are available for processing in EAs. All input fields are available. You can message in private chat for further changes you need. Thanks for downloading
FREE

This EA automatically closes all Open Trades and Pending Orders at your specified Net Profit or Net Loss. The TP and SL for a single trade can easily be set in Meta Trader, on individual basis and on hitting that TP or SL, the trade is automatically closed. However, if you have multiple trades and you want to set a Net TP and Net SL (in terms of profit & loss) for all of them, then Meta Trader cannot help you. Here comes this EA “Net TP Net SL Setter” using which you can set a Net TP and Net SL
FREE

Imagine what results you could achieve in your manual trading if you had a tool that notifies you of a possible price reversal for all the symbols you are interested in at the same time (futures, stocks, forex or cryptocurrency)?
VSA screener is just the right tool. It was created for traders who value their time and make their own trading decisions on opening or closing a position. The software monitors the presence of trading patterns on the preselected tickers under several timeframes (up t
FREE

Fibonacci and RSI.
Demo versión only works with GBPUSD. For full version, please, visit visit https://www.mql5.com/en/market/product/52101
The indicator is a combination of the Fibonacci and RSI indicators.
Every time the price touches one of the fibonacci levels and the rsi condition is met, an audible alert and a text alert are generated.
Parameters number_of_candles : It is the number of candles that will be calculated. If you put 100, the indicator will give you the maximum and min
FREE

You can send MetaTrader screenshot easily to your identified telegram channel via press the send button that on the chart. TelegramBotToken: Telegram API credentials. You can create API credentials on my.telegram.org web page ChatId: Your telegram chatId. Secreenshots will be sending this channel - Please do not press the button repeatedly. This may cause your bot or ip address to be blocked. - You have to add telegram api address ( https://api.telegram.org ) in Option > Expert Advisors > Allow
FREE

This multi-timeframe indicator identifies the market's tendency to trade within a narrow price band. [ Installation Guide | Update Guide | Troubleshooting | FAQ | All Products ]
It is easy to understand Finds overbought and oversold situations Draws at bar closing and does not backpaint The calculation timeframe is customizable The red line is the overbought price The green line is the oversold price It has straightforward trading implications. Look for buying opportunities when the market is
FREE
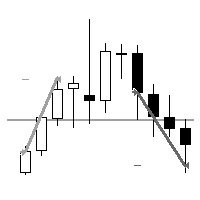
"AV Level EA MT5" is an Expert Advisor for the MetaTrader 5, which is intended exclusively for the german DAX (DE40, GE40, etc.) and is also available as a free version with MinLot to try out.
NEW: More ways to close, third entry.
Strategy:
- Level Trading, DAX M15 (also M5 or M30)
- Entry: Buy level 75, sell level 25
- Exits: TP = 25 (i.e. approx. 00 level) or TP = 50 (buy 75 level, sell 25 level)
- Second entry in the event of a reset, distance e.g. 25 or 50 (it does not ta
FREE
Ea is developed to work with EURCHF - M15 chart. Ea uses directional indicators, stochastics and momentum to open positions. It is neither a martingale nor a grid, each trade has its own SL and TP. Caution before using the programme it is always best to test it in a test environment.
Past results are no guarantee of future results, you could lose all your capital. Trade with caution.
Enjoy the robot.
FREE

Este poderoso indicador analisa o gráfico e mostra zonas de Rejeição de Preços! Isto é, locais onde o preço foi, mas não foi aceito pelo mercado! A visualização desta zona de Rejeição, facilita o entendimento do trader na tomada de decisões de onde operar e como operar!
O indicador é composto por 4 linhas, sendo classificadas em 2 grupos: Linhas Vermelha e Amarela: Denotam os extremos onde o preço conseguiu chegar, mas não foi aceito! Linhas Laranja e Azul: A partir delas, denotam o Início da
FREE

Описание стратегии:
Набор торгуемых валютных пар: GBPUSD, GBPAUD, GBPCAD, GBPJPY, EURUSD, EURGBP, EURAUD, EURCAD, EURJPY, AUDUSD, AUDNZD, AUDCAD, AUDJPY, NZDUSD, NZDCAD, USDCAD, USDJPY
В момент открытия рынка после выходных, определяется на каких парах из списка цена прошла от открытия до закрытия недельной свечи более 2000 пунктов и открываем позицию в противоход недельному движению с целью забрать откат в 500 пунктов. Стоп не ставится.
Если цена пошла против позиции, то через кажды
FREE

WindFlow HTF is a useful tool suited to use in conjunction together with my WindFlow indicator. This indicator will give you a background vision about the price action trend on a higher timeframe, so when it runs with the WindFlow indicator you have an almost complete trading solution. At this point, you only need some support/resistance analysis and a bit of focus to become a consistent trader.
The metaphorical "wind's ballet" Professional traders know that every timeframe is governed by its
FREE

Doji Engulfing Paths enables to get signals and data about the doji and the engulfing patterns on charts. It makes it possible to get opportunities from trends, and to follow the directional moves to get some profits on the forex and stocks markets. It is a good advantage to take all the appearing opportunities with reversal signals and direct signals in order to obtain some profits on the forex market. With the demo version, only the signals starting with the 20th candle or bar are available.
FREE

Highly configurable Momentum indicator.
Features: Highly customizable alert functions (at levels, crosses, direction changes via email, push, sound, popup) Multi timeframe ability Color customization (at levels, crosses, direction changes) Linear interpolation and histogram mode options Works on strategy tester in multi timeframe mode (at weekend without ticks also) Adjustable Levels Parameters:
Momentum Timeframe: You can set the lower/higher timeframes for Momentum. Momentum Bar Shift:
FREE

Что такое RSI? Индикатор RSI (Relative Strength Index, индекс относительной силы) — это индикатор, который измеряет соотношение восходящих и нисходящих движений. Расчет ведётся таким образом, что индекс выражается в диапазоне от 0 до 100. Как понять RSI?
Если значение RSI находится равно 70 и больше, считается, что инструмент находится в состоянии перекупленности (ситуация, когда цены выросли выше, нежели того ожидал рынок). Значение RSI на уровне 30 и ниже считается сигналом о том, что инст
FREE
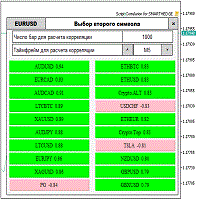
Script for quickly selecting a tool with high correlation. The script is placed on the tool to which you need to select the second correlating one. Then you can change the number of bars to calculate and the timeframe. The script iterates through all available symbols in the market overview and returns the 20 most correlated ones. You can use the selected pairs to trade with THE new SH expert Advisor
FREE

This bot uses two CCI indicators one slow and the other fast. Then there is a moving average to determine the trend (if price is above moving average then its an up trend ). If a signal is to be produced in the opposite direction of the current open trade then it closes and reverses the type of trade. An ATR indicator is used for better stop loss and take profit placement. There is a trailing stop function. This robot can be used in the H1 timeframe , other time frames should work though you wil
FREE

El indicador técnico Non Lag MA (Non-Lagged Moving Average) es una variante de la media móvil que busca reducir el retraso inherente a las medias móviles tradicionales.
Pros: - Menos retraso: Al estar diseñado para reducir el retraso, el Non Lag MA puede proporcionar señales más rápidas que las medias móviles tradicionales. - Tendencias claras: Las líneas del Non Lag MA muestran claramente las tendencias alcistas y bajistas, lo que facilita la interpretación de la dirección del mercado. - Per
FREE
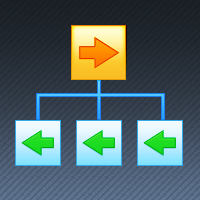
Reverse TradeCopier for Followers can copy trades from an account that is running Reverse TradeCopier for Source . Features: Copies trades from one source (master) account to multiple following (slave) accounts. Allow investor (read only) password for source (master) account. There are no complicated settings and input parameters, everything is easy. Works with different brokers. Works with different quotes symbols (EURUSD_FX, eurusd_m, etc.). Can copy orders from 4-digit quotes platform to 5-
FREE
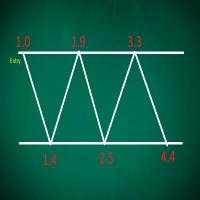
This EA performs with a Hedging strategy by which Buy and Sell signals are from the MACD indicator.... The lot sizes in the input are Custome for you to adjust as you pleased, so you are able to improve your hedging style. Inputs. Close Money- this option is basically the take profit in ($), for example if you set the close money at $20 the EA will automatically close all trades when your overall profit is $20. Nearby Hedge Pips- this basically determine the distance of pips between yo
FREE
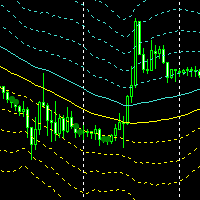
Данный эксперт является помощник для торговли по индикатору MADayLevel ( https://www.mql5.com/ru/market/product/41130) Использовать можно как сеточник и для торговли внутри дня. Так как эксперт больше рассчитан на торговлю вручную, в автоматической торговле задействованы только 4 уровня: когда предыдущий бар полностью закрывается между 6 и 5, -6 и -5, выше 6 и ниже -6. Еще раз повторюсь, основной упор идет на работу в ручном режиме вместе с индикатором. Рекомендуемый период H1, символ EURUSD, т
FREE

The " Pure View " indicator is designed to quickly display and hide indicators on the chart. Description
1. Currently Pure View works with Stochastic, MACD, RSI indicators 2. Displaying and hiding indicators occurs using hot keys 3. The key combination Shift + C will display or hide the "Stochastic" indicator on the chart 4. The key combination Shift + V will display or hide the "RSI" indicator on the chart 5. The key combination Shift + B will display or hide the "MACD" indicator on the chart
FREE

Indicador usado para sabermos os pontos de suporte de resistência no gráfico.
Funciona em todos ativos e timeframes.
Acerte exatamente os pontos de entradas e saídas das suas operações. SEE OUR RESULTS ON INSTAGRAM: https://www.instagram.com/diogo.cansi/ TELEGRAM GROUP = https://t.me/robosdsc More information by email dscinvestimentos@gmail.com or by Whatsapp 55-991372299
FREE

This is an unusual representation of the Average Directional Movement Index. The indicator has been developed at the request of a trader and for the purposes of learning the development of indicators in MQL5. The line shows the same as the standard Average Directional Movement Index (ADX); The upward histogram shows the difference between +DI and -DI, when +DI is above -DI; The downward histogram shows the difference between +DI and -DI, when +DI is below -DI.
FREE

Trade in the opposite directions with HedgeTerminal HedgeTerminal is a full-featured trading terminal inside MetaTrader 5. This is a graphic panel resembling MetaTrader 4 terminal. It allows you to track oppositely directed positions in the manner it is possible in MetaTrader 4. In other words, we can open unlimited number of positions on a single symbol even if positions are in complete or partial hedge (lock). Thus, you can maintain long and short positions simultaneously, which is impossible
FREE

SDivergence Indicator calculates and shows regular divergences and hidden divergences for MACD and Stochastic(for now). The benefit of this indicator is multiple input variables. Using these inputs you can modify to get more adaptive RD and HD's to your strategy. Guide : 1- First put your desired oscillator (MACD or Stochastic or Both) on the chart. 2- Run SDivergence indicator and set corresponding sub-window index of previously put oscillator in SDivergence input window. -Note: the chart sub-w
FREE

Shows min and max of last M5 Candle. Can be used to trade breakouts of last M5 candle. The M5 Candle Breakout Strategy avoids to stay too long in a sindways phase. See documentation on @swisstrader3713, where you can follow my live trading. The only parameters are the color of the lines defining the M5 stretch. Best use the indicator in M1 timeframe. The M5 Breakout Strategy has helped me to reduce overtrading.
FREE

FractalEfficiencyIndicator A ratio between 0 and 1 with the higher values representing a more efficient or trending market, It is used in the calculation of Perry J. Kaufman Adaptive Moving Average (KAMA), dividing the price change over a period by the absolute sum of the price movements that occurred to achieve that change. The Fractal Efficiency or also known as Efficiency Ratio was first published by Perry J. Kaufman in his book ‘Smarter Trading‘. This is mostly considered a filter for v
FREE

Классический индикатор фракталов является запаздывающим, т.к. для подтверждения образования фрактала необходимо ждать 2 бара. Если этого избежать, то индикатор будет перерисовывающим, т.е. при обновлении максимума/минимума в течении 2-х баров фрактал будет менять своё положение на более позднее. В данном продукте максимально нивелированы оба этих недостатка, при этом совмещены достоинства обоих подходов! Индикатор показывает фрактал сразу в момент его образования, а в случае его обновления показ
FREE

The euro index (Euro Currency Index, EURX) is an average indicator of changes in the exchange rates of five currencies (US dollar, British pound, Japanese yen, Swiss franc and Swedish krona) against the euro. Displays a Eur X chart in a seperate window below the main chart. YOUR BROKER MUST HAVE THESE SYMBOLS FOR THE INDICATOR TO WORK Based on EUR/USD, EUR/JPY, EUR/GBP, EUR/CHF and EUR/SEK All these pairs must be added to Market Watch for the indicator to work correctly As this is calculated usi
FREE
O Mercado MetaTrader oferece um local conveniente e seguro para comprar aplicativos para a plataforma MetaTrader. Faça download de versões de demonstração gratuitas de Expert Advisors e indicadores a partir do seu terminal para testes no Testador de Estratégia.
Teste os aplicativos em diferentes modos para monitoramento do desempenho e assim fazer um pagamento para o produto que você deseja, usando o sistema de pagamento MQL5.community.
Você está perdendo oportunidades de negociação:
- Aplicativos de negociação gratuitos
- 8 000+ sinais para cópia
- Notícias econômicas para análise dos mercados financeiros
Registro
Login
Se você não tem uma conta, por favor registre-se
Para login e uso do site MQL5.com, você deve ativar o uso de cookies.
Ative esta opção no seu navegador, caso contrário você não poderá fazer login.