Conheça o Mercado MQL5 no YouTube, assista aos vídeos tutoriais
Como comprar um robô de negociação ou indicador?
Execute seu EA na
hospedagem virtual
hospedagem virtual
Teste indicadores/robôs de negociação antes de comprá-los
Quer ganhar dinheiro no Mercado?
Como apresentar um produto para o consumidor final?
Expert Advisors Grátis e Indicadores para MetaTrader 5 - 19

The UJ_H1_170100007_S_OD_CF_SQX is an algorithmic trading strategy for MetaTrader, tested on USDJPY using the H1 timeframe from April 1, 2004, to April 24, 2024. There is no need to set up parameters, all settings are already optimized and fine-tuned.
Recommended broker RoboForex because of EET timezone.
You can find the strategy source code for StrategyQuant at the link: http://quantmonitor.net/listing/usdjpy-osma-impulse/
Key details are:
Parameters
MagicNumber: 170100007
Main
FREE
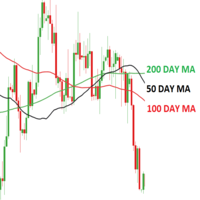
Working with pending orders Buy Stop and Sell Stop. A channel of two indicators iMA (Moving Average, MA).
Input parameters Take Profit - Take Profit; Trailing Stop - trailing; Trailing Step - trailing step; Lots - lot size is set manually (a NECESSARY CONDITION: Risk must be equal to zero!); Risk - lot size is calculated automatically, in risk percents per trade (a NECESSARY CONDITION: "Lots" must be equal to zero!); Difference - offsets from the channel borders; Expert Every T
FREE

E aí Trader! Brigando com o gráfico do Meta? Queria movê-lo assim como faz no Profit? Seus problemas acabaram! Chegou o Chart Panoramic ou ChartPan para os mais chegados, um utilitário permite mover o gráfico para melhor visualização dos pontos mais relevantes para o seu trade. Recomenda-se adicionar um tecla de atalho para facilitar o uso (Ctrl + Q - por exemplo), pois, ao trocar de ativo você vai precisar rodar o ChartPan para "soltar" o gráfico novamente. Para adicionar uma tecla de at
FREE

The UJ_H1_170147110_S_HH_CF_SQX is an algorithmic trading strategy for MetaTrader, tested on USDJPY using the H1 timeframe from April 1, 2004, to April 24, 2024. There is no need to set up parameters, all settings are already optimized and fine-tuned.
Recommended broker RoboForex because of EET timezone.
You can find the strategy source code for StrategyQuant at the link: http://quantmonitor.net/listing/usdjpy-awesome-oscillator-revolution/
Key details are:
Parameters
MagicNumber:
FREE

Что такое Awesome Oscillator? Создателем данного индикатора является Билл Вильямс. Этот трейдер разработал собственную торговую систему. Её основой служит постулат: «Рынок движется хаотично. Какие-либо закономерности этого движения вывести довольно сложно, так как многое зависит от психологических факторов.» Поэтому Вильямс разработал собственные инструменты для анализа рынка.
Одним из таких инструментов и является индикатор АО. Это осциллятор, который дает возможность выявить силу текущего
FREE

Что такое CCI индикатор? Стандартный Индикатор CCI (Commodity Channel Index) – это осциллятор, который измеряет силу, стоящую за тем или иным движением цены. Он помогает определить, кто находятся у руля: быки или медведи. Как и многие осцилляторы импульса, CCI работает, сравнивая текущую цену с предыдущими показателями, и на основе этого сравнения он решает, насколько сильное движение цены вверх/вниз.
Как рассчитать CCI? Метод расчета стандартного индикатора представляет собой оригинальн
FREE

Análise de trading precisa na ponta dos dedos: software de análise de trading de última geração O software de análise de trading convencional disponível no mercado geralmente fornece apenas estatísticas de índice de lucro e perda por hora ou semana, o que não atende à necessidade de uma análise de trading mais precisa. No entanto, no mercado de trading real, cada dia apresenta circunstâncias únicas. As segundas-feiras são tranquilas, as quartas-feiras são ativas com juros noturnos triplos e as
FREE

Introducing StochEAstic: an advanced Expert Advisor utilizing the stochastic indicator to provide precise market entry and exit signals. Engineered with sophisticated algorithms, this EA empowers traders to effectively control risk and maximize profit potential. With StochEAstic, traders can customize their trading strategies according to their individual preferences. From adjusting stochastic indicator parameters to setting specific risk levels, this EA offers flexibility and complete control o
FREE

This variant of the ZigZag indicator is recalculated at each tick only at the bars that were not calculated yet and, therefore, it does not overload CPU at all which is different from the standard indicator. Besides, in this indicator drawing of a line is executed exactly in ZIGZAG style and, therefore, the indicator correctly and simultaneously displays two of its extreme points (High and Low) at the same bar!
Depth is a minimum number of bars without the second ma
FREE
Forex Trade Manager Grid MT5 helps you to managing orders and achieve the goal. You only need to place first order with Take Profit, run EA and set in params profit (pips) you want to get. EA will be managing your positions, as will gather appointed amount of pips. It’s a strategy for management of manual trades opened on current pair. The strategy adds positions to currently opened trades in a grid management (with chosen distance in pips between trades) - up to 15 trades (or less). First up to
FREE

Acceleration Points-uma poderosa ferramenta de detecção de pontos críticos de movimento de preços, com base na idéia de calcular a aceleração das flutuações de preços.
_________________________________
Como usar os sinais indicadores:
O indicador forma um sinal após o aparecimento de uma nova barra de preços. Recomenda-se usar o sinal gerado após o preço romper o ponto crítico na direção especificada. O indicador não redesenha seus sinais.
_________________________________
Os parâmet
FREE

O indicador 2indtompson é um indicador de comparação de dois instrumentos para determinar volumes, para equilibrar em transações de negociação em pares ou para negociação de arbitragem, Preparado a partir de uma versão análoga para o terminal MT4. Assim, se você precisar comparar quanto pesará os dois instrumentos e não souber como fazê-lo, coloque o indicador no gráfico e ele calculará automaticamente os volumes necessários para o equilíbrio. Além disso, o indicador mostra o status dos instrume
FREE

The indicator is based on Robert Miner's methodology described in his book "High probability trading strategies" and displays signals along with momentum of 2 timeframes. A Stochastic oscillator is used as a momentum indicator.
The settings speak for themselves period_1 is the current timeframe, 'current' period_2 is indicated - the senior timeframe is 4 or 5 times larger than the current one. For example, if the current one is 5 minutes, then the older one will be 20 minutes The rest of the
FREE

For those who feel that regular RSI is too fast and too noisy to be used on regular trades or in EAs and want to have an alternative to meter the Momentum of the Price, here is a solution presented on the great article of the Technical Analysis of Stocks & Commodities magazine (April, 2015), by Vitali Apirine, called: Slow Relative Strenght Index . Its reading is almost the same as the regular RSI, but its levels of Overbought and Oversold are 80 and 20 instead. SRSI is very powerful to show div
FREE

This is the demo version of "All Harmonics 26" indicator . "All Harmonics 26" searches for 26 types of harmonic patterns and outputs them in a convenient way. You can check out the documentation here . This demo version has the following limitations: The indicator searches only for one type of harmonic patterns out of 26:- Gartley. The indicator outputs new patterns with a lag of 10 bars.
FREE

This EA is named Dinosaur Hunter(DH) because it can capture very large trend, such as 5000-10000 pips. DH trades infrequently as it patiently waits for the right market conditions. DH can load multiple currency pairs on a single chart to increase the number of trades. Live Signal
This is a demo version that only for fixed lot size of 0.01. To obtain the full version, please purchase Dinosaur Hunter Pro . This EA has been tested from 2015 to the present. The test used data from Dukascopy. If
FREE

Indicator introduction: The indicator draws wave lines and histograms, It has small price lag, and the signal will not drift. The indicator can send emails, alerts and notifications to you when previous k line has an up arrow and it is under the histogram sections or it has a down arrow. you can choose whether or not to send the two kind of alerts, the alerts repetition times can also be changed. If the indicator appears red and green histograms, this is a buy zone. It can be used to analyze mar
FREE

Double Smoothed Stochastic is similar to Stochastic except for this Indicator we use what is called double exponentially smoothing.
This will give the trader a more speedy response to price changes which tends to smooth out the erratic movements of a regular Stochastic.
Double Smoothed Stochastic Calculation is : DSS = EMA(r) (X - Lxn / Hxn - Lxn) x 100 MIT = EMA(r) (close - Ln / Hn - Ln) x 100
Ln = lowest low of n periods Hn = highest high of n periodsLxn = lowest low of the price se
FREE

This indicator accurately identifies and informs market reversals and continuation patterns by analyzing and signaling the Three White Soldiers / Three Black Crows pattern. User-friendly interface and multi-asset compatibility Fully customizable parameters and colors Does not repaint Can be easily convert its signals into an Expert Advisor. Full support granted.
FOR MT5 FULL VERSION: CLICK HERE
What is the Three White Soldiers / Three Black Crows price action pattern The Three White Soldi
FREE

Multi Diver EA trades symbols from Marketwatch . The strategy is based on the daily ranges and also on the RSI indicator. Risk management as well as breakeven and trailing stop accompany your positions and protect you from larger losses! You can use an indicator filter to weed out unwanted symbols. EA has been tested in EURUSD, USDCAD, USDJPY, XAUUSD and US30 H1 in the strategy tester and defaulted to these symbols. Please suggest your ideas in discussion. I will implement this as quickly as pos
FREE

Este indicador é baseado no indicador Bollinger Bands. Ele ajuda o trader a identificar uma entrada para comprar ou vender. Vem com um alerta sonoro sempre que um novo sinal aparece. Ele também possui mensagens via e-mail. O seu endereço de e-mail e configurações do servidor SMTP devem ser inseridos na janela "Opções" da guia "Ferramentas" no seu MetaTrader 5. Seta azul pra cima = Compra. Seta vermelha para baixo = Venda Linha = Trailing Stop. Você também pode usar um dos meus produtos, o Traili
FREE

This utility is designed to receive volumes from order books from larger crypto exchanges and transfer information to the indicator RealCryptoLevels . The RealCryptoLevels indicator by downloading the order book of crypt exchanges with maximum depth shows horizontal volumes of popular crypto currencies on the chart, so you can see not only the volumes, but also the levels and them strength (see screenshots), which is very important for successful trading in all strategies from scalping to m
FREE

A média móvel Tillson's T3 foi apresentada ao mundo da análise técnica no artigo ''A Better Moving Average'', publicado na revista americana Technical Analysis of Stock Commodities . Desenvolvida por Tim Tillson, logo os analistas e operadores de mercados futuros ficaram fascinados com esta técnica que suaviza a série de preços ao mesmo tempo em que diminui o lag (atraso) típicos dos sistemas seguidores de tendências.
FREE

This indicator will show a vertical representation of the volume distribution within a selected user range.
This is a free version of the full product. It is limited to use on a week old data or older. Find the full product at https://www.mql5.com/en/market/product/42234 .
Main features: This Indicator will create an image that will allow viewing the tick volume per price level in a graphical form. The indicator will work on any range size in any time-frame, limited only by your computer m
FREE

The indicator shows when there are overpricing and divergences over a normalized MACD Plus, it displays signals with configurable alerts, self-regulating dynamic overprice levels, and a simple setup and interface. This indicator automatically calculates markup ranges. MACDmaxmin is an indicator based on the MACD oscillator that effectively identifies trend changes in price, as it is a momentum indicator that captures the trend and shows the relationship between two moving averages of the price.
FREE

This EA uses the MACD Crossover Strategy. Entries opened when the signal and MACD line cross each other. The Buy position entered only when the cross is below the zero line while the Sell position entered above the zero line. The Moving Average Convergence/Divergence (MACD) is an oscillator that combines two exponential moving averages (EMA)—the 26-period and the 12-period—to indicate the momentum of a bullish or bearish trend. MACD can be used to signal opportunities to enter and exit positions
FREE
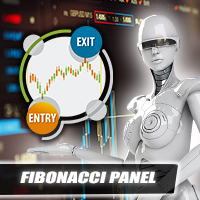
A Fibonacci Panel tool to facilitate your trading with Fibonacci indicator. Simple and easy to use! Magnificent Design (Adjustable) Sound Effects (This will make trading much more fun) Five Fibonacci Levels (freehand movable) Acoustic and graphic signals (adjustable for each level) Integrated narrow trading panel also with risk and money management If you need silence while trading, you can deactivate the sounds in the settings.
Parameter
Language English Magic number Commentary (for all po
FREE

Based on Brazilian trader André Moraes' Difusor de Fluxo theory, the indicator is a more reliable version of the original MACD. It is a great confirmation indicator for Swing Trading and also can be used as a Day Trading tool. If you are not familiar with the concept or André's trading strategies, I strongly recommend his excelent book named "Se Afastando da Manada" in which he explains in detail how this indicator is used. Even if you don't know the Portuguese language it is not difficult to un
FREE

Indicator measures strength of each currency in your list.
Main idea: It simply iterates through all combinations of pairs and adds difference between open and close in percent. Parameters: List of currencies - what currencies will be calculated (maximum is 8) Calculation type - from which data will be strength calculated Calculation data input - used as input related to calculation type Symbol suffix - used in case of suffix on symbols, e.g: when your symbols look like EURUSDm, EURUSDmicro et
FREE

Overview: The "ATRBBOpener" is a trading robot designed to operate on the GBP/USD currency pair. Tailored for an H1 (one-hour) trading timeframe, this robot is ideal for traders seeking a balanced approach between short-term and medium-term trading strategies.
Technical Indicators Used: Average True Range (ATR): The robot incorporates ATR to measure market volatility and determine stop loss and take profit levels. This indicator helps identify periods of high and low volatility. Bollinger Band
FREE

Necessary for traders: tools and indicators Waves automatically calculate indicators, channel trend trading Perfect trend-wave automatic calculation channel calculation , MT4 Perfect trend-wave automatic calculation channel calculation , MT5 Local Trading copying Easy And Fast Copy , MT4 Easy And Fast Copy , MT5 Local Trading copying For DEMO Easy And Fast Copy , MT4 DEMO Easy And Fast Copy , MT5 DEMO Fibo: from KTrade 1. Automatically calculate and analyze the band. -> Get the desired band 2.
FREE

An easy indicator that simply shows the moment we connect to the market. We can easily see what has happened while we were gone because the line has two different colors that show the start time. It is only that, a visualization aid that allow us to mark the market behavior while it was night time in our country, or if we have stopped several hours. Input: Server start working date: Day of month Month Year Hour Minutes
FREE

Kindly rate and comment about the product for upgradation & Support
The 5 EMA is plotted in green color ( Lime ). The 14 EMA is plotted in red color ( Red ). The 20 EMA is plotted in blue color ( Blue ). The 200 EMA is plotted in black color ( Black ). The 200 EMA is plotted in yellow color ( Yellow ).
The Quarter EMA that provided calculates and plots four Exponential Moving Averages (EMAs) on the chart using different periods: 5, 14, 20, and 200. Each EMA
FREE

Introduction to Order Risk Management EA ORM EA is specially designed for fast and accurate market order execution to be used with our Price Action and Econometric Trading strategies listed below. ORM EA is fully automatic and ORM EA is also very easy to use. ORM EA is totally free of charge. You can also use this robust order execution feature of this ORM EA for any other your own trading strategy.
Trading Strategy Guide Order Risk Management EA provides the guide for the risk management for
FREE

Ever wanted to use MACD like you see in TradingView??? Now you can use this indicator to use same MACD in your MetaTrader5 and enjoy more time in Trading.. You can change MACD settings if you want to change and it will be ready to use for you... Now you will not spend time in TradingView to use only indicator there... Open charts , load Indicator and you are ready to do analysis in MetaTrader5 and Put Trades when you feel okay with your analysis.
FREE

The currency strength momentum has a lot of similarities with currency strength meter presented in the previous page, but the difference are much more pronounced. You can try putting both in the same chart and see the difference in results. Currency strength momentum measures strength of a currency based on (you guess it) it's momentum relative to other currencies, while currency strength meter measures the strength of a currency based on pips it has moved in a certain direction.
FREE

In which direction should I trade today? For “TREND followers”, we need to determine the TREND . This indicator determines the Trend based on the price High, Low and Close of every bar, for a given period and timeframe. Calculating and plotting the Trend UP and Trend DOWN lines. If the: “Trend UP” line (Green) is above the “Trend DOWN” line (Red), then it is a BULLISH Trend (see "Screenshots" tab). “Trend DOWN” line (Red) is above the “Trend UP” line (Green), then it is a BEARISH Trend (see "
FREE

Genaral: Not martingale, not a grid; Use on EURUSD Use on M5
Signals: There is a good rational algorithm. Work of two indicators: CCI and OsMA (from 2 timeframes) (you can set a separate Timeframe for each indicator)
Stop Loss/Take Profit: There is a good money management system (there are several type for trailing stop loss); There is virtual levels of Stop Loss / Take Profit; There is smart lot (percent by risk) or fix lot
Important: EA can work on closed candles, and on current can
FREE

Moving Average 4 TimeFrames
Exiba 4 médias móveis de 4 timeframes diferentes no mesmo gráfico. Para não poluir o gráfico, o indicador vai plotar a média completa somente no tempo gráfico corrente de uma das 4 médias cadastradas, para os outros tempos gráficos de médias cadastradas o indicador exibe apenas uma parte da média para que você saiba onde ela está naquele tempo gráfico. Exemplo:
Exiba no gráfico de 5 minutos onde está passando a média móvel aritimética de 200 períodos dos 5 min
FREE

Sentimento de Mercado é um indicador que usa os dados do nosso principal indicador: Market Strength Radar.: https://www.mql5.com/pt/market/product/114568?source=Site +Profile+Seller Ele imprime um gráfico de linhas que deve ser comparado com o gráfico de preço para entendermos o sentimento do mercado. As divergencias são pontos importantes de inflexão. As convergências mostram força da tendência atual.
FREE
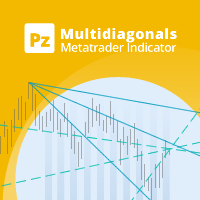
This indicator connects past price points drawing diagonals and trend lines, which converge in the future creating hidden reversal points. [ Installation Guide | Update Guide | Troubleshooting | FAQ | All Products ] Find hidden reversal points Spot convergence zones easily Dense criss-cross zones are reversal points Configurable amount of lines and price points Configurable colors
How to use the indicator The indicator draws several lines on the chart, and where many of these lines converge a
FREE

FREE

Introduction to the Candle Time Indicator The Candle Time Indicator for MetaTrader 5, helps users know how much time on a candlestick is remaining.
Overview of Candle Time Indicator settings. TextColor: set the color of the countdown clock; FontSize: set the size of the font; Installation Guide Copy and paste the CandleTime.ex5 indicator files into the MQL5 folder of the Metatrader 5 trading platform. You can gain access to this folder by clicking the top menu options, that goes as follows: Fi
FREE

The YK-SMART-EMA is an indicator that displays multiple Exponential Moving Average (EMA) lines on a price chart to help analyze price trends. This indicator features five EMA lines: EMA14 (red line): Calculated based on the closing prices of the last 14 candles. EMA30 (blue line): Calculated based on the closing prices of the last 30 candles. EMA50 (green line): Calculated based on the closing prices of the last 50 candles. EMA100 (orange line): Calculated based on the closing prices of the last
FREE

Hi All ! I want to share with you my favorite indicator to identify strong trend bias. It helps me a lot with my entries and exits. You can use it on any market and any instrument. It works best on daily tiimeframe 1D but you can also use it on 1H and be carefull with lower timeframes This indicator uses MACD, RSI and Stoch. The idea is simple, when MACD crosses above a Signal line and RSI > 50 and Stoch > 50 we consider the trend is going UP on the opposite we consider its DOWN Feel free to us
FREE
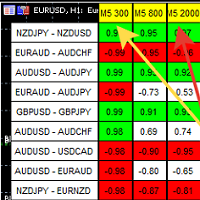
A script showing the correlation for three selected zones at once (TF-bar) In the parameters, select 3 options The data is displayed sorted by the first zone The script also creates a file in which it writes all the data without sorting. In this way, you can expand the number of zones to any number and perform the analysis in exsel
Parameters:
TF_Trade1 =PERIOD_M5; BarsCor1 = 300; TF_Trade2 =PERIOD_M5; BarsCor2 = 800; TF_Trade3 =PERIOD_M5; BarsCor3 = 2000; K = 0.8; WindSize
FREE

Este indicador pode ser usado para ajudar a aprender o 'sistema de contagem de barras' de Al Brooks. Ele encontra e marca as barras 'H', 'L', Micro Gap '=', Externa 'E' e Interna '+'. Você pode escolher plotar "H" e "L" na barra de sinal ou na barra de entrada. (não conta barras/pernas... você terá que fazer sua própria contagem para L1, L2... H1, H2, etc.) A barra interna só é marcada quando for selecionado plotar os rótulos na barra de entrada.
FREE

Indicador padrão Bill Williams Fractals com a capacidade de especificar o número de velas a serem formadas. O indicador funciona em todos os gráficos e períodos de tempo.
Configuração: candles - número de velas à esquerda e à direita, com base no qual o fractal é construído (num indicador clássico este valor é sempre 2)
Contacto: Se tiver alguma dúvida ou precisar de ajuda, contacte-me através de mensagem privada. Autor: Fertikov Serhii, Mais dos meus indicadores, conselheiros, scripts e
FREE

Se você é (ou foi) um fã do indicador RSI, vai adorar o indicador Dynamic Momentum Index de Tushar Chande, que, em termos simples, é um RSI de comprimento variável dinâmico, tornando-o mais poderoso. O indicador DMI usa internamente um número variável de barras em seus cálculos, levando em consideração os níveis de volatilidade do mercado atual que você está analisando. Dessa forma, o indicador DMI usará mais barras conforme a volatilidade diminui e menos barras quando a volatilidade aumenta, pr
FREE

Highly configurable Adx indicator.
Features: Highly customizable alert functions (at levels, crosses, direction changes via email, push, sound, popup) Multi timeframe ability Color customization (at levels, crosses, direction changes) Linear interpolation and histogram mode options Works on strategy tester in multi timeframe mode (at weekend without ticks also) Adjustable Levels Parameters:
ADX Timeframe: You can set the lower/higher timeframes for Adx. ADX Bar Shift: you can set the
FREE

The Expert Advisor is based on the signals of the Stochastic indicator in the overbought zone-we sell, in the oversold zone-we buy. Version for MT4 https://www.mql5.com/ru/market/product/62952 Monitoring the work of the adviser MT4 https://www.mql5.com/ru/signals/1178019 MT5 https://www.mql5.com/ru/signals/1178043 If the Expert Advisor is used in 5/24 mode on a VPS, I recommend using this Expert Advisor in a conservative mode, limiting the number of orders in the grid using the " Count_Order
FREE

The DJ_M5_810504785_L_OD_CF_1522_SQX is an algorithmic trading strategy for MetaTrader, tested on DJ using the M5 timeframe from December 7, 2017, to June 2, 2023. There is no need to set up parameters, all settings are already optimized and fine-tuned.
Recommended broker RoboForex because of EET timezone.
You can find the strategy source code for StrategyQuant at the link: http://quantmonitor.net/listing/dow-jones-bollinger-master/
Key details are:
MagicNumber: 810504785 Main Chart
FREE
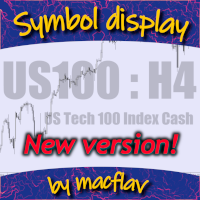
Adicione uma marca d'água aos seus gráficos, contendo o símbolo do ativo seguido do período atual, e a descrição do ativo logo abaixo.
Você já viu imagens de outras plataformas gráficas, ostentando aquelas belas marcas d'água, e se perguntou por que o seu MetaTrader5 não tem uma igual? Esse era o meu caso... então experimentei algumas das opções disponíveis no Mercado à época, mas eu ainda queria deixar tudo exatamente do meu jeito. Então desenvolvi a minha própria solução, e tenho orgulho de
FREE

This Expert Advisor (EA) is crafted using AI technology and stands out due to its specialized training dataset derived from neural network methodologies, as opposed to conventional trading indicators. It is finely tuned for optimal performance on three specific Forex pairs. Using this EA on pairs other than those specified is not advised due to the extensive memory requirements post-training. The training dataset encompasses historical data spanning from January 1, 2019, to October 1, 2023. Whil
FREE

DiversiStrat Harmony Pro: Revolutionizing Trading with over 25 Strategies in one EA! Welcome to the future of trading with DiversiStrat Harmony Pro – your ultimate solution for navigating the complexities of the market with ease and precision. Harnessing the combined power a package of meticulously curated strategies, this Expert Advisor (EA) is engineered to excel in the dynamic landscape of Forex trading. At the heart of DiversiStrat Harmony Pro lies a commitment to innovation and reliability.
FREE

This Ea works on the USD CAD currency pair with M15 chart. It is not a martingale or even a grid. It works with TP and SL. It uses RSI and Bollinger Band to open Long and Short positions.
It must be tested and the correct parameter settings found before using it.
Beware that past gains do not guarantee future gains. This is not inducement to invest, beware that with forex tradign you can also lose all your capital. Money management is very important.
FREE

Having trouble marking where the various forex sessions start and end? Or perhaps your strategy requires you trade only in a specific session, then this is for you.
The session indicator shades the session you require in a certain color so that you can identify it easily. The sessions shown include: London session, New York session, Asian Session, Asian - London overlap and London - New York Overlap.
Difference source give varying time ranges for the various session, mostly differing by not
FREE

Trend Fibonacci is a unique indicator that combines a power of Fibonacci sequences and ranges. Channel Group: Click Here
How to read:
- There are three zones --> red, gold and green
- Red candlestick = downtrend
- Green candlestick = uptrend
- Gold candlestick = no established trend
Inputs: Per = number of bars used for calculations FirstRatio = first Fibonacci ratio (Or use any ratio you want) SecondRatio = second Fibonacci ratio (Or use any ratio you want)
!! IF YOU PURCHASE TH
FREE

O oscilador Estocástico é um dos principais indicadores usados na análise de ativos financeiros. É um dos destaques no estudo das movimentações de preço e pode ser um importante sinalizador de mudança de tendências no mercado de capitais . O estocástico é um oscilador utilizado para identificar quando um ativo está sobrecomprado ou sobrevendido. Ele é composto por duas linhas: %K, que é calculado a partir das máximas e mínimas de um período e %D, que é uma média móvel de %K. A nossa versão conté
FREE

Este indicador foi desenvolvido para ajudá-lo, como comerciante, a identificar a direção do mercado. Na negociação, temos três tipos de movimentos e UPTREND, DOWNTREND e SIDEWAYS. consolidando, isso significa simplesmente que não há direção. Para os scalpers, isso pode ser uma vantagem para eles APENAS se eles souberem identificar quando as classes de ativos estão neste período.
Uma tentativa de desenvolver enxada para identificar tendências é o objetivo deste indicador, atenha-se quando o pr
FREE
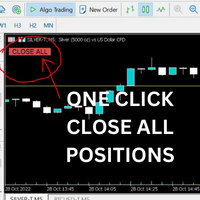
Just Attach to the Chart to be able to Click Button to Close all Open Positions in your Trading Account. Change Horizontal And Vertical Pixel based positioning for Button placement on chart. Appreciate your feedback and reviews. Note: All open positions on your trading account will be closed when button pressed.
If you need help with any simple utility happy to help.
FREE

Candle size oscillator is an easy to use tool to figure out candle size from highest to lowest price of each candle. It's a powerful tool for price action analysts specifically for those who works intraday charts and also a perfect tool for short term swing traders. Kindly note that you can also edit the Bullish and Bearish candles with different colors.
#Tags: Candle size, oscillator, price action, price range, high to low, candle ticks _________________________________________________________
FREE

This is just a ADX with multi symbols, multi timeframes, and colors. features. different symbols and timeframes from the main chart. draw ADX and ADX moving average. easy to identify if ADX is above 25 or not. e asy to identify if ADX is above moving average or not. easy to identify the direction of the trend by color, not by DI line. unnecessary DI lines can be erased
FREE

High of the Day and Low of the day Time and Price Fractal Studies is an indicator that will help you identify certain patterns that tend to repeat themseleves at certail times of the day or at certain prices.
It is used to study Daily Highs ad Lows in relation to time and price.
You will get to answer certail questions like:
At what time of day does this market usually turn around. At what price does the market turn. Is it at round numbers etc
FREE

ESTA É A VERSÃO GRATUITA DOS NÍVEIS AVANÇADOS DE AÇÃO DE PREÇO
grátis por um mês, mas na conta demo.
produto completo: https://www.mql5.com/en/market/product/94338 Suporte horizontal preciso e níveis de resistência Preciso para análise de ação de preço. Todos os mercados: forex, ações, índices, metais, commodities e criptomoedas Disponível para meta trader 5 Parâmetros ajustáveis Eu acho que é isso
Fale comigo via telegrama: @ https://t.me/Userrrrrrrrrname
Direst vendas estão em 19 dóla
FREE

Por favor, deixe uma avaliação de 5 estrelas se você gosta desta ferramenta gratuita! Muito obrigado :) A coleção de Expert Advisors "Risk Management Assistant" é um conjunto abrangente de ferramentas projetadas para aprimorar estratégias de negociação, gerenciando eficazmente o risco em diversas condições de mercado. Esta coleção compreende três componentes principais: consultores especializados em cálculo de média, comutação e cobertura, cada um oferecendo vantagens distintas adaptadas a dife
FREE

This tool provides an intelligent method of trading Fibonacci retracement. It has been tested for a period of nine years on EUR/USD and shows consistent profit making capability. The amount of profit you intend to make per year depends on the input values of lot size. Interested clients will be provided with further information on how to set up and use this tool. This product has been well tested on OxctaFX for 9yrs and is currently being tested on other platforms to ensure it provides consisten
FREE

This EA offers features:
Stoploss (Risk Management), Take Profit (Money Management), Tralingstop and Tralling-Step (after candles), breakeven (strategy), partial sale (strategy), closing the order (strategy), Customizable settings:
1: magic number 2: Commentary 3: Risk, Riskmin and Riskmax 4: total orders 5: SL-(Strategy) 6: TP (true/false points) 7: Initial sale end Breakeven 8: Day positive end trading 9: day range 10: Trailing stop Normal end Intelligent (Candles strategy) 11: Trading St
FREE

About the indicator: DALA Forecast is a universal tool for predicting the dynamics of time series of any nature. For prediction, modified methods of nonlinear dynamics analysis are used, on the basis of which a predictive model is built using machine learning methods. To get the trial version of the indicator, you can contact me in private messages.
How to use the indicator: Apply the indicator to your chosen financial instrument or indicator with the settings you need. The prediction will b
FREE

It so happened that it is no longer necessary to write about the principles of operation of indicators of this type. The presented indicator redraws the trend direction until it changes to the opposite. whether this is right or not is up to you to judge. It works well together with SM trend Cloud, which is implemented in the SMak ZigZag EA and Pyramid EA Expert Advisor code. When these two indicators work together, it is possible to determine the further trend movement with a high degree of pr
FREE
O Mercado MetaTrader contém robôs de negociação e indicadores técnicos para traders, disponíveis diretamente no terminal.
O sistema de pagamento MQL5.community está disponível para todos os usuários registrados do site do MQL5.com para transações em todos os Serviços MetaTrader. Você pode depositar e sacar dinheiro usando WebMoney, PayPal ou um cartão de banco.
Você está perdendo oportunidades de negociação:
- Aplicativos de negociação gratuitos
- 8 000+ sinais para cópia
- Notícias econômicas para análise dos mercados financeiros
Registro
Login
Se você não tem uma conta, por favor registre-se
Para login e uso do site MQL5.com, você deve ativar o uso de cookies.
Ative esta opção no seu navegador, caso contrário você não poderá fazer login.