MT5 Indicator to plot the high/lows of the previous hour on the hourly candle

MQL5 Indicadores

Trabalho concluído

Tempo de execução 2 dias
Comentário do cliente
Great dev, very attentive and helpful. I will come back for more work shortly.
Comentário do desenvolvedor
Nice and easy to work with

Termos de Referência

Generic Stuff

·   CODE WILL BE MY PROPERTY ONCE FINISHED SO I CAN MARKET IT 

·   CODE MUST PASS MQL5 MARKET PLACE CHECKS 

·   It must also work exactly as what is showing in the video clip plotting the high lows. The video helps greatly to show exactly what is required.


SUMMARY

Video: https://drive.google.com/drive/folders/1JgeMfEYXF0i-UB8ogt0p4kUdlS_Efval?usp=sharing

Little over 4mins showing exactly how the high - low lines should move

I am looking for an indicator to plot the high/lows of the previous hour on the hourly candle.

It will need to draw a horizontal line on the hourly candle of the high or low. 


How does it work? 

Basically, we are looking for if a high or low breaks the previous high/low to confirm a trend direction.


If we have a blank chart to start, we would need to look back in time for the latest high or latest low.

This will help me to identify a trend. There would need to be calculations done every hour on the hourly candle close. Only once the recent high or low is broken by another candle, would you calculate back where the other high/low would be. 


How to identify a recent low? The price has to break the most recent high.

Confirmation will only be once the recent high gets broken. The low will continue to move up as the highs get broken during each pull back in counter trend. If the candles are bouncing in between the high/low lines there is nothing to move each hour. 


If the price is moving up each H1 candle close, then you do not need to move the Low horizontal line.

You would only move the Low line, when the next H1 candle does not break the most recent high horizontal line. Then if in a few hours it breaks the high line again, only then would you recalculate the low line. And visa versa for High lines.


Most recent low will only be confirmed once a new candle breaks the high line again.

Once it breaks the most recent high, you will look back on the chart at the previous candles and mark out the most recent low.


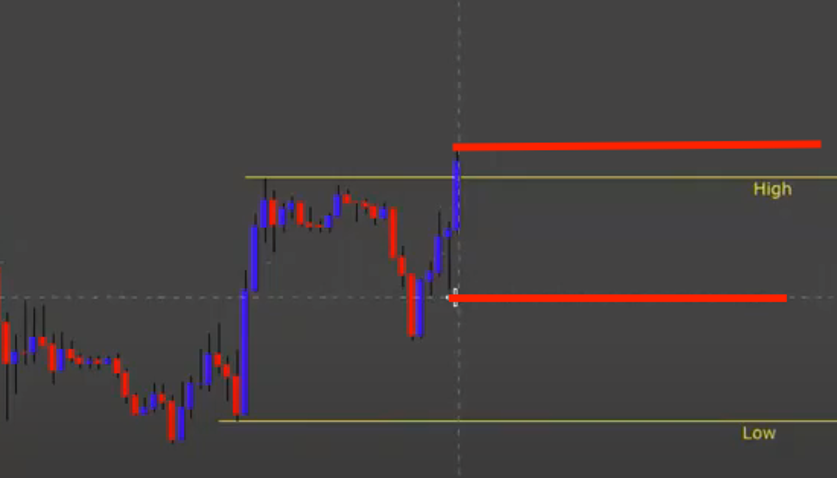
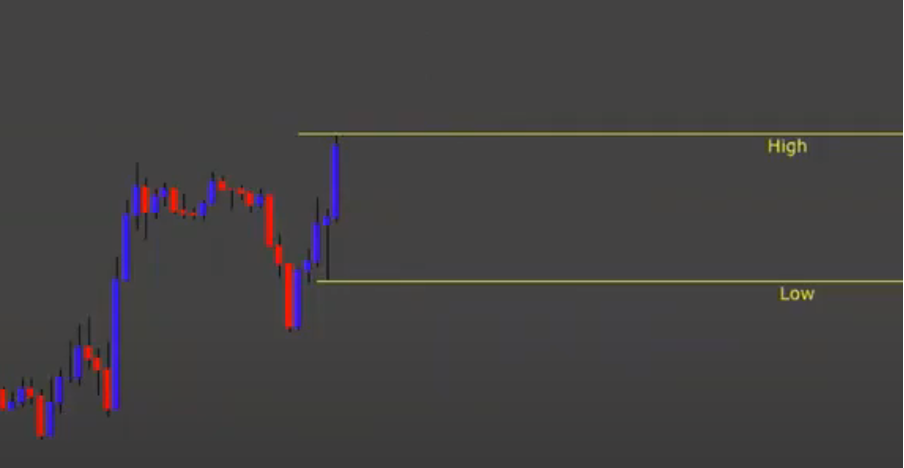
In the example above, the previous high/low is marked in yellow and written High/Low.

As you can see the blue candle breaks the previous high, as such the high line is now moved to the red line. Also, now the most recent low is confirmed as the high was broken, it is now also marked in red.


Final result will be: 


Each candle after this high if it continues up will be a continuation of marking the highs.

UNTIL we get a counter trend move that does not take out the previous candles high.


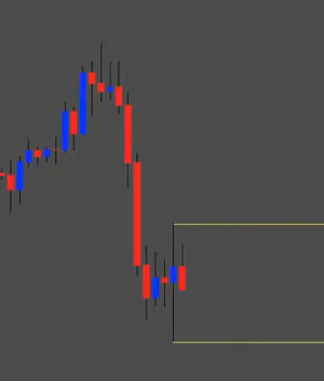
A candle with the wick on each side can also mark the high and low as seen here.


So I open EURUSD chart on H1 time frame. Then you click the horizontal line drawing tool and click on the high candle and the low candle

That’s how I would do it manually

And then grab that line and move it manually


Additions


·       Users should be able to adjust the thickness of the horizontal lines

·       Users should be able to adjust the colour of the horizontal lines


Respondido

1
Desenvolvedor 1
Classificação
(39)
Projetos
54
33%
Arbitragem
2
0% / 50%
Expirado
0
Livre
2
Desenvolvedor 2
Classificação
(243)
Projetos
430
34%
Arbitragem
54
37% / 39%
Expirado
157
37%
Carregado
3
Desenvolvedor 3
Classificação
(185)
Projetos
327
32%
Arbitragem
33
42% / 27%
Expirado
98
30%
Trabalhando
4
Desenvolvedor 4
Classificação
(298)
Projetos
443
64%
Arbitragem
5
40% / 0%
Expirado
4
1%
Trabalhando
5
Desenvolvedor 5
Classificação
(256)
Projetos
415
38%
Arbitragem
86
44% / 19%
Expirado
70
17%
Ocupado
6
Desenvolvedor 6
Classificação
(40)
Projetos
76
39%
Arbitragem
0
Expirado
0
Livre
7
Desenvolvedor 7
Classificação
(586)
Projetos
1048
49%
Arbitragem
39
28% / 41%
Expirado
49
5%
Livre
8
Desenvolvedor 8
Classificação
(42)
Projetos
88
14%
Arbitragem
30
30% / 53%
Expirado
36
41%
Trabalhando
9
Desenvolvedor 9
Classificação
(251)
Projetos
400
54%
Arbitragem
9
67% / 22%
Expirado
36
9%
Livre
10
Desenvolvedor 10
Classificação
(66)
Projetos
143
34%
Arbitragem
10
10% / 60%
Expirado
26
18%
Livre
11
Desenvolvedor 11
Classificação
(343)
Projetos
362
70%
Arbitragem
4
100% / 0%
Expirado
0
Carregado
Pedidos semelhantes
EA DEJA FABRIQUE ? MODIFIER QUELQUE LIGNE POUR LE RENDRE RENTABLE /////////////////////++++++++++++++++++++++++++++++++++ EA AVEC UN SYTEME SIMPLE ; SEULEMENT A MODIFIER %%%%%%%%%%%%%%%%%% SI PERSONNE SACHANT CODER CORRECTEMENT , CE TRAVAIL EST POUR TOI
Buy an sell symbols and guide showing entry to buy or sell setups and I need it gives and tell me to enter buy or to enter sell by automation nnnnnnnnnn fgggghhuuuiijh hhrddfhuuufffff yygggg hhgt hiidcb hygdfbby gyytdv uttrdd. Httdd hyyydv. Yhygf. Uu juhgff uyttt uuuytdbhy uuuyyy hhhff jjueeiivhgffdgu hyuu7trg yyyyffj yyytd u6tttf uuyrrrhi uytrrfh utterly jyrfgkkttv uhyybhhyy hytfgivuyt utfbh utghjio7t. Uuytg uytru
Utilizing the MQL5 MetaEditor Wizard, I created an Expert Advisor, having the following Signal indicators: I was able to optimize the EA and reached a backtest with the following specifications: I was able to reach a profit level of 30K, as indicated below. However, the Bot is not without faults and following the backtest, I started a forward test with real live data and the results were not so great. The EA took a
Connect from Mt5 via binary deriv account api I have mt5 indicator, need to connect with binary deriv account through api. If anyone can setup via API then contact me. everything control mt5
Hello I am looking for a developer to create an 50% retracement Indicator of the previous candle . So once a candle close the Indicator is supposed to take the full candle size from high to low and make a 61% and 50% level on that candle and I would like the candle to show until the next previous candle is done creating. After this I would look to create an ea with it possibly
Hi, I have 2 indicators which are based on the super trend , the alerts on indicator (1) does not work at all , and on the other indicator the alerts do not come on time on time, which is kind of delayed. see attached file below
Looking for an experienced developer to modify my existing TDI strategy , want to add filter for Buy and Sell Signals, Arrows are displayed on chart and what only to leave high accurate arrows Source code to be provided
I have the mq5 file, I need a buffer adding to the indicator, so it appears in the data window so I can reference it later in an EA. As the below screenshot shows, there is a median ray line from yesterday (the dashed horizontal line) - I want this value in the data window called Median Ray. I want this to be a single value per day, so todays Median Ray would be 17868, and so on each day. So I want all the Developing
I would like to develop my own indicator on metatrader 4 and tradingview. We would start with a basic version that we would improve later. It is an indicator based on several analyses and which would provide several indications. I am looking for someone who can develop on MT4 and Mt5, initially I would like to do it on mt4 and then on mt5. If you have expertise in pinescript it is a plus because I would like to
I urgently require swift assistance to convert a complex indicator into a fully functional scanner, capable of automatically sending real-time data, alerts, and notifications via email, ensuring seamless integration and prompt delivery of critical information to facilitate informed decision-making and timely action

Informações sobre o projeto

Orçamento
50 - 150 USD
Desenvolvedor
45 - 135 USD
Prazo
de 3 para 30 dias