—
Generic Stuff
—
· CODE WILL BE MY PROPERTY ONCE FINISHED SO I CAN MARKET IT
· CODE MUST PASS MQL5 MARKET PLACE CHECKS
· It must also work exactly as what is showing in the video clip plotting the high lows. The video helps greatly to show exactly what is required.
—
SUMMARY
—
Video: https://drive.google.com/drive/folders/1JgeMfEYXF0i-UB8ogt0p4kUdlS_Efval?usp=sharing
Little over 4mins showing exactly how the high - low lines should move
I am looking for an indicator to plot the high/lows of the previous hour on the hourly candle.
It will need to draw a horizontal line on the hourly candle of the high or low.
How does it work?
Basically, we are looking for if a high or low breaks the previous high/low to confirm a trend direction.
If we have a blank chart to start, we would need to look back in time for the latest high or latest low.
This will help me to identify a trend. There would need to be calculations done every hour on the hourly candle close. Only once the recent high or low is broken by another candle, would you calculate back where the other high/low would be.
How to identify a recent low? The price has to break the most recent high.
Confirmation will only be once the recent high gets broken. The low will continue to move up as the highs get broken during each pull back in counter trend. If the candles are bouncing in between the high/low lines there is nothing to move each hour.
If the price is moving up each H1 candle close, then you do not need to move the Low horizontal line.
You would only move the Low line, when the next H1 candle does not break the most recent high horizontal line. Then if in a few hours it breaks the high line again, only then would you recalculate the low line. And visa versa for High lines.
Most recent low will only be confirmed once a new candle breaks the high line again.
Once it breaks the most recent high, you will look back on the chart at the previous candles and mark out the most recent low.
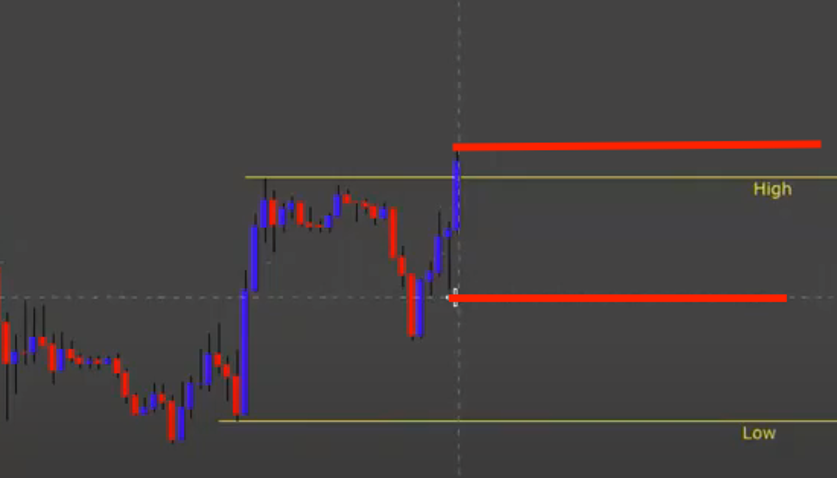
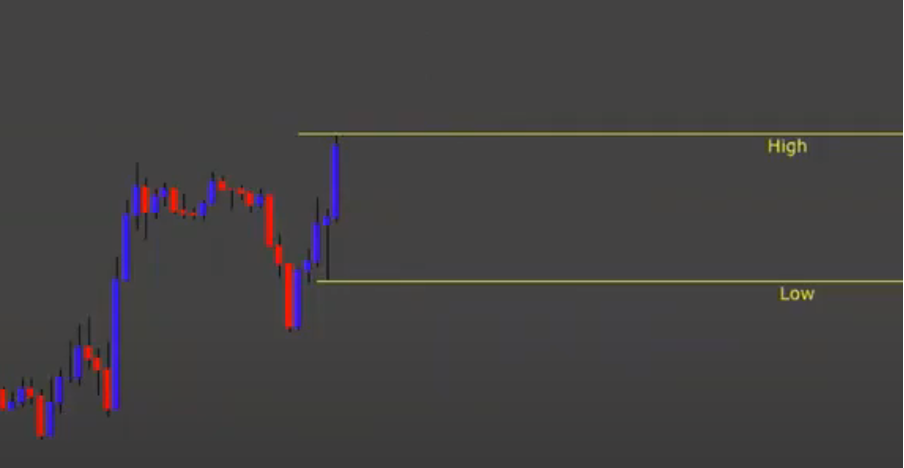
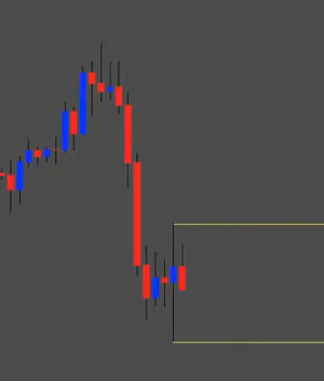
In the example above, the previous high/low is marked in yellow and written High/Low.
As you can see the blue candle breaks the previous high, as such the high line is now moved to the red line. Also, now the most recent low is confirmed as the high was broken, it is now also marked in red.
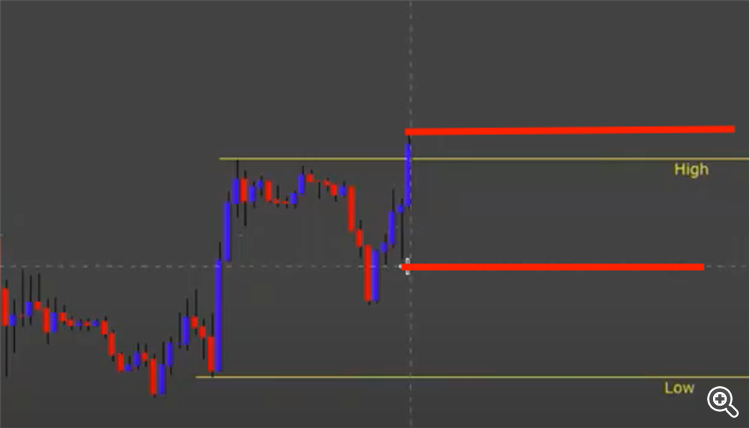
Final result will be:
Each candle after this high if it continues up will be a continuation of marking the highs.
UNTIL we get a counter trend move that does not take out the previous candles high.
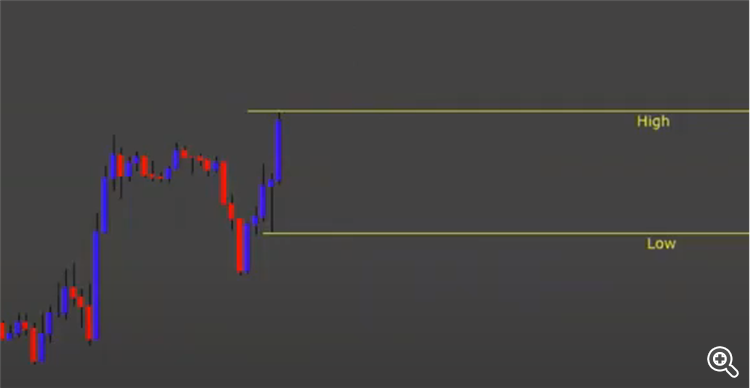
A candle with the wick on each side can also mark the high and low as seen here.
So I open EURUSD chart on H1 time frame. Then you click the horizontal line drawing tool and click on the high candle and the low candle
That’s how I would do it manually
And then grab that line and move it manually
—
Additions
—
· Users should be able to adjust the thickness of the horizontal lines
· Users should be able to adjust the colour of the horizontal lines
類似した注文
I need an EA edited to make TWO main changes to conditions for how it enters trades. The EA code is written with clean code and is well commented. Will provide more info on changes in a doc in the chat
Create an Expert Advisor that collaborates between these indicators ETR, MEv2 and STLv3 with these features 1. SL and TP 2. TIME FILTER 3. ETR, MEv2 and STLv3 PARAMETERS BUY ENTRY STEP 1. FIRST candle OPEN above Symphonie Trend Line STEP 2. Check Symphonie Extreme must indicate color BLUE STEP 3. Check Symphonie Emotion must indicate color BLUE STEP 4. Open trade with money management STEP 5. Trade open MUST BE 1
Hello, I have a protected Ninja trader Order Flow indicator and I was wondering if you can reverse engineer it to replicate the functionality. H ere are the specifications and indicator: https://docs.google.com/document/d/1KyYwQ7iTL2KWGhnZzxS1gObccu9LPMrGuMc9Mdk_3KY/edit?usp=sharing
I have an EA that need some changes including integrating the indicator code directly into the Expert Advisor. I will give the detailed doc once we settle on the candidate for the job . Please bid if you can work with the stated amount. Thanks
Hello, Need to convert Tradingview Indicator to MQL4 indicator. or if you have this one converted already, let me buy a copy please. If we're good, then will definitely buy it and ask to convert into EA on new order. Supertrend by KivancOzbilgic
Fix bug or modify an existing Trading view indicator to display correct. The indicator is working but not displaying/plotting all the information i want. So i want it adjusted to plot all the info
Here's a brief requirement you can use: **Description:** I am seeking an experienced MQL5 developer to create a (EA). The EA should include features for placing pending orders (Buy Stop and Sell Stop) based on market spread, managing trades effectively at the opening of new candlesticks, and implementing take profit and stop loss strategies. Additionally, I would like the option to adjust parameters based on market
I have an EA which i need to do below modifications. Variable Inputs to be added Order Type : Market , Pending Trade Type : Buy, Sell , Buy & Sell Pending Pips Step : ( Pips Value can be negative or positive to decide on what type of Pending Order ) // If trade type Buy is selected Close Type : Close All ( Bulk Close Option in MT5 ) , Close Individually Close Option : %of Equity , %of Balance , Amount $ , %of No
Add multiplier to grid recovery system. For example: Grid Trade 2-3 Spacing; 1.0 Multiplier Grid Trade 4-6 Spacing; 2.0 Multiplier Grid Trade 7+ Spacing; 1.6 Multiplier Need quick turn around. Need it done ASAP
Hi I have an indicator that create objects in the chart and using those following some rules the new indicator will create external global variables with value = 0 ( NONE ), = 1 ( BUY ) or = 2 ( SELL ). The global variable will use PIN external integer number . PINS are by now global variables (GV) whose name indicates the pair name and the PIN belonging and their value indicates it direction/action. PINS GV names