Mohamed yehia Osman / 프로필
- 정보
|
11+ 년도
경험
|
63
제품
|
59
데몬 버전
|
|
0
작업
|
0
거래 신호
|
0
구독자
|
Simple and effective indicator based on some candle patterns recognition Arrows appear on candles when bear signal / bull signal based on candle pattern recognition -----> TWO strategies available you can enable / disable one of them Indicator can work on any chart and time frame I prefer to work on high time frames especially the Daily charts D1 and H4 Red arrows appears above candle showing a bear signal after candle completed - arrow will be blue during candle formation Green arrows
Auto redrawn Pivot support resistance horizontal lines with signal of Buy/Sell possibilities with SL level and with trend support resistance lines too used for all symbols and time frames you can adjust inputs parameters (only 2) and test it on various symbols and time frames input number of bars for calculation and moving average for signal accuracy example : use it on M30 time frame with input 200 for bars count and 100 for MA
Auto redrawn Pivot support resistance horizontal lines with signal of Buy/Sell possibilities with SL level and with trend support resistance lines too used for all symbols and time frames you can adjust inputs parameters (only 2) and test it on various symbols and time frames input number of bars for calculation and moving average for signal accuracy example : use it on M30 time frame with input 200 for bars count and 100 for MA
This is a new strategy for SUPPLY DEMAND areas It is based on a calculation using the tick volume to detect the big price action in market for both bear /bull actions this smart volume action candles are used to determine the supply and demand areas prices in between main supply and demand lines indicate sideway market up arrows will be shown when prices moves above the main supply and the secondary supply lines Down arrows will be shown when prices moves below the main demand and the
SUPER Correlation Lines for Symbols Multi timeframes Multi Currencies Indicator Each line indicates 2 symbols correlation based on Multi timeframes symbols strength calculations 5 symbols -> 10 correlation indicator lines Strategy:1 is based on selecting the NEW weaker/stronger correlation line : *****New Weaker Line Crossing DOWN the old weaker line : SELL SYMBOL1 && BUY SYMBOL2 *****New Stronger Line Crossing UP the old weaker line : BUT SYMBOL1
one of the diamond indicator for correlation trading but still not well reached
Crazy Dancing moving RES/SUP Levels Automatic redrawing of moving Supports and resistances levels to indicate price breaking supports (signal SELL) or breaking resistance levels (signal BUY) Very simple appearing indicator but very clever and smart too !!!! Main Inputs: # of bars for the support and resistances levels + the initial shift from start + moving average for filter signaling Smaller values for bars /shift inputs when using Higher Time frames (D1-H4) and the reverse higher
Trend Lines contiuous Signal (FREE one WEEK) This indicator draws current trend line and provides Buy/Sell Signal based on calculations on Higher frame (Trend) and Lower frame(Entry signals) * You should select the higher and lower frame for indicator calculations * You select the Trend line colors as you prefer * Enable or disable Alerts! Trend lines UP/Down are drawn when a trend is detected Wait for small arrows for entry : *Normally an UP arrow in an UP Trend is a BUY signal
Auto redrawn Pivot support resistance horizontal lines with signal of Buy/Sell possibilities with SL level and with trend support resistance lines too used for all symbols and time frames you can adjust inputs parameters (only 2) and test it on various symbols and time frames input number of bars for calculation and moving average for signal accuracy example : use it on M30 time frame with input 200 for bars count and 100 for MA
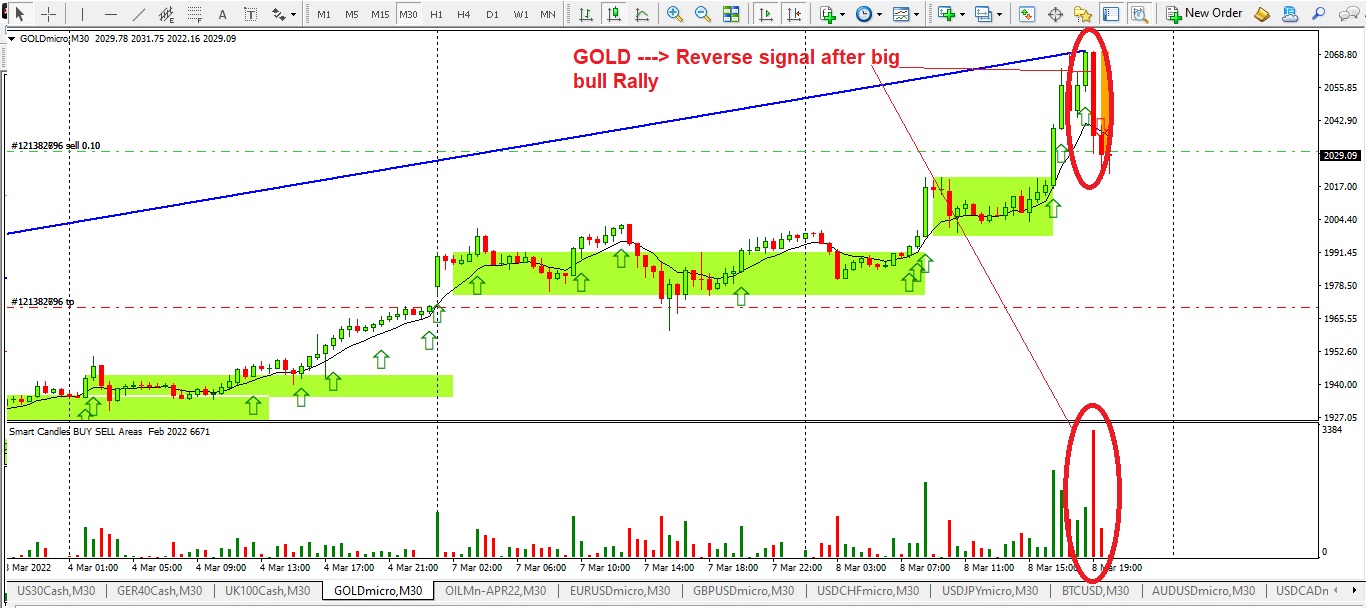
Big possible trend reversal signal IF successive closing Below 2030 $
using Supply Demand Zones indicator ::::: https://www.mql5.com/en/market/product/78416
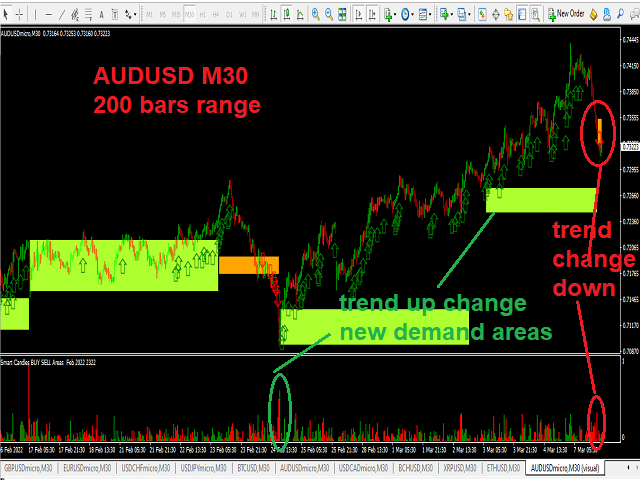
possible trend to BULL shift IF closing above 1.0920
using Supply Demand Zones indicator ::::: https://www.mql5.com/en/market/product/78416

https://www.mql5.com/en/market/product/78416
https://www.mql5.com/en/market/product/78345
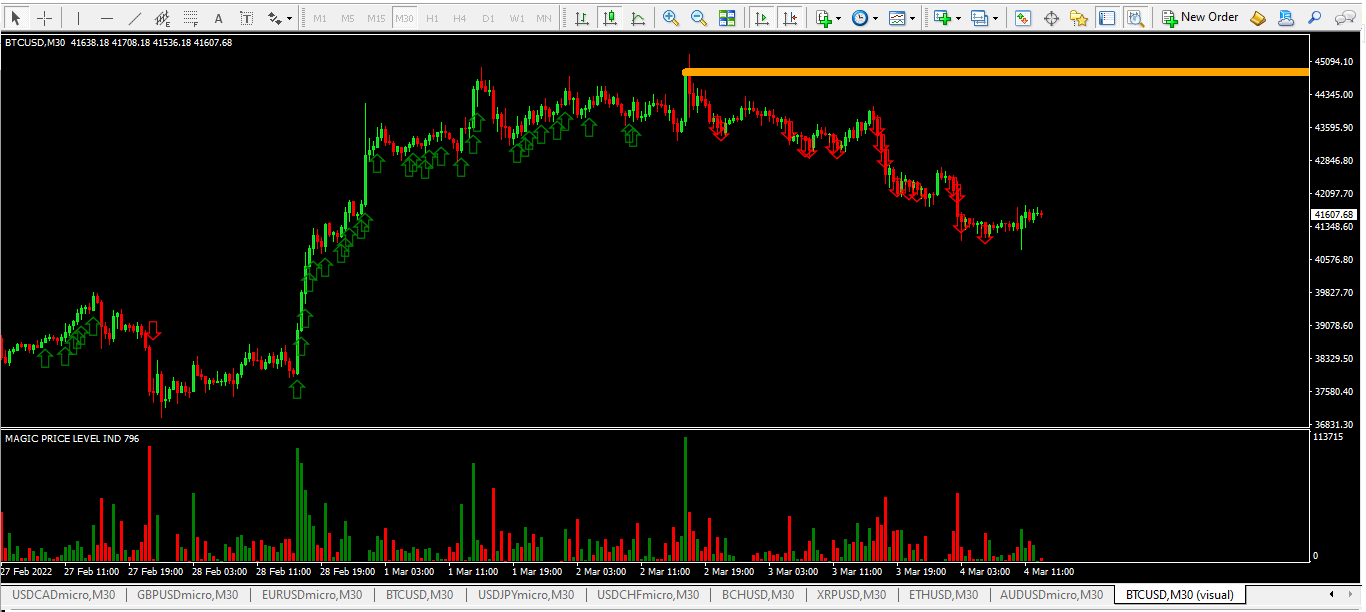
MT4 ::: https://www.mql5.com/en/market/product/78416
https://www.mql5.com/en/market/product/78416

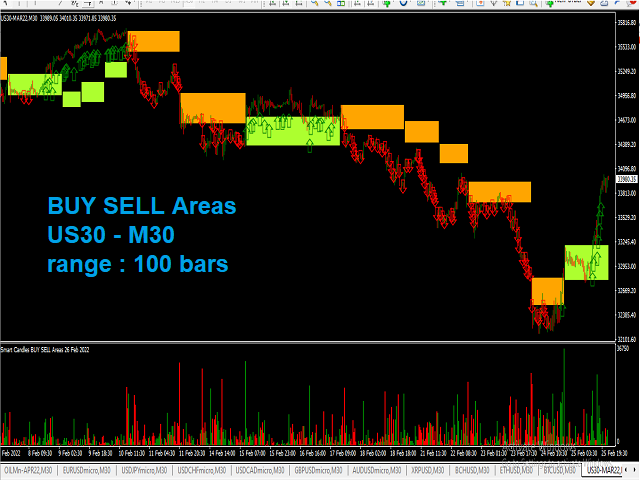
Supply Demand Zones indicator for possible BUY / Sell Zones based on smart volumes indicator two levels of buy/Sell Zones : Main BUY/SELL area SUPPLY area in Red DEMAND area in Green your strategy is to follow generated Arrows : 1- you can Buy when price is Closed above a green BUY area and above high of previous candle 2- you can Sell when price is Closed below a red SELL area and below low of previous candle Also, a separate indicator window for SMART
Supply Demand Zones indicator for possible BUY / Sell Zones based on smart volumes indicator two levels of buy/Sell Zones : Main BUY/SELL area SUPPLY area in Red DEMAND area in Green your strategy is to follow generated Arrows : 1- you can Buy when price is Closed above a green BUY area and above high of previous candle 2- you can Sell when price is Closed below a red SELL area and below low of previous candle Also, a separate indicator window for SMART
https://www.mql5.com/en/market/product/78345
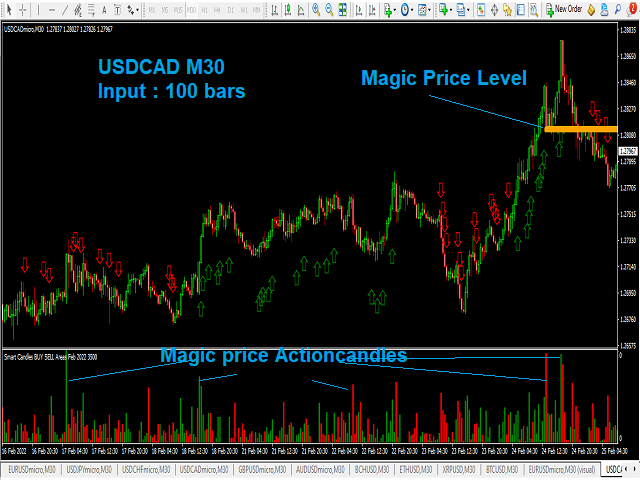
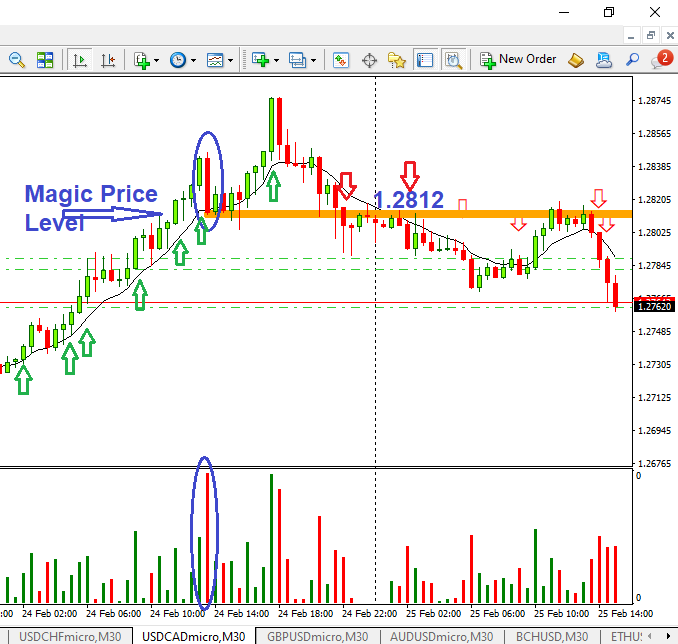
Detection of Market Reversal on 24 - feb 2022 with a big Smart Bear candle with Level 1.2812 as a Pivot level crossed down
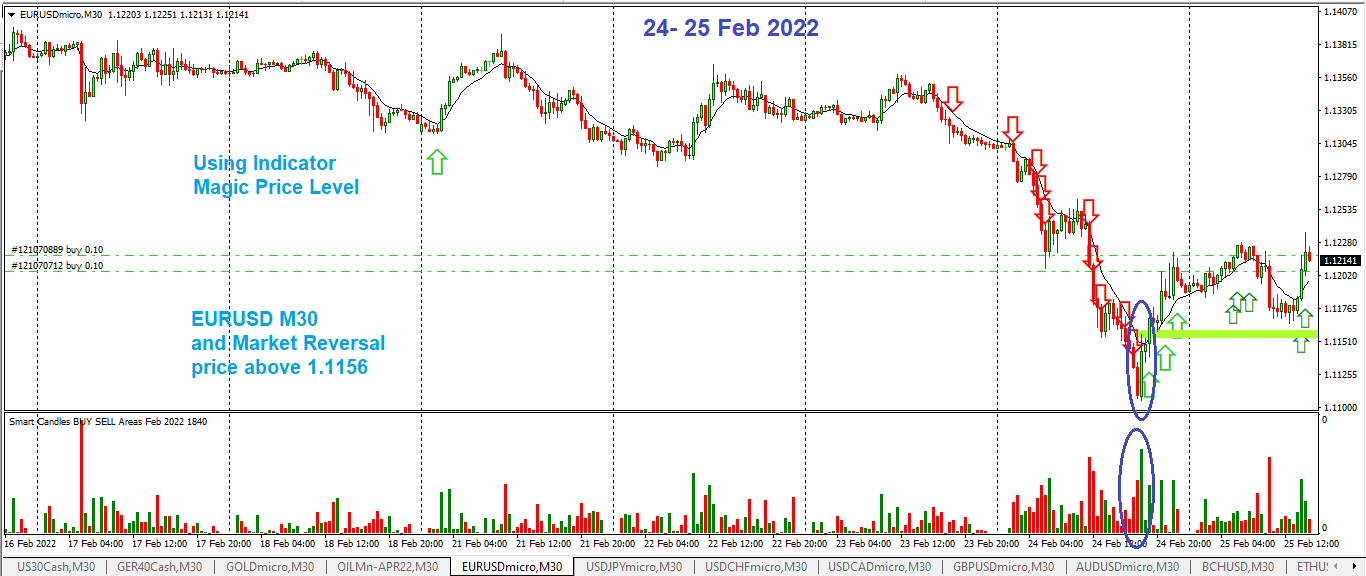
Detection of Market Reversal on 24 - feb 2022 with a big Smart Magic candle with Level 1.1156 as a Pivot level
https://www.mql5.com/en/market/product/78345
