Mohamed yehia Osman / 프로필
- 정보
|
11+ 년도
경험
|
61
제품
|
60
데몬 버전
|
|
0
작업
|
0
거래 신호
|
0
구독자
|
SMOOTH STRENGTH METER INDICATOR (SMOOTH LINE) it draws Currencies TREND Volatility Power / Strength lines : - Detects the 2 highly TRENDED Volatile pairs ( will be the Bold Lines ) - A very Helpful Indicator - It draws smooth lines for up to 20 currencies pairs representing Volatility strength and power - First it indicates the most powerful trended direction pairs : Strongest / Weaker - MAIN FUNCTION
SMOOTH STRENGTH METER INDICATOR (SMOOTH LINE) it draws Currencies TREND Volatility Power / Strength lines : - Detects the 2 highly TRENDED Volatile pairs ( will be the Bold Lines ) - A very Helpful Indicator - It draws smooth lines for up to 20 currencies pairs representing Volatility strength and power - First it indicates the most powerful trended direction pairs : Strongest / Weaker - MAIN FUNCTION
SMOOTH STRENGTH METER INDICATOR (SMOOTH LINE) it draws Currencies TREND Volatility Power / Strength lines : - Detects the 2 highly TRENDED Volatile pairs ( will be the Bold Lines ) - A very Helpful Indicator - It draws smooth lines for up to 20 currencies pairs representing Volatility strength and power - First it indicates the most powerful trended direction pairs : Strongest / Weaker - MAIN FUNCTION
A simple Approach to Elliot waves patterns Signal generated on trend continuation when breaking the "5" level or on corrective direction after 1-5 waves detected 1-5 labeled points arrows used for signal UP/DOWN direction Chaotic patterns in Blue are drawn all times until a 1-5 Elliot wave pattern detected 1-5 Red pattern in Bull Market : UP arrow in BULL trend continuation OR DOWN arrow as a reversal DOWN direction as pattern correction 1-5 Green pattern in Bear Market :DOWN
A simple Approach to Elliot waves patterns Signal generated on trend continuation when breaking the "5" level or on corrective direction after 1-5 waves detected 1-5 labeled points arrows used for signal UP/DOWN direction Chaotic patterns in Blue are drawn all times until a 1-5 Elliot wave pattern detected 1-5 Red pattern in Bull Market : UP arrow in BULL trend continuation OR DOWN arrow as a reversal DOWN direction as pattern correction 1-5 Green pattern in Bear Market :DOWN
Trend Bar Balance Indicator Simple indicator based on trend detection and support resistance breakage It detects the major trend and the minor support and resistance levels *** a signal for UP /BUY is detected and alerted in a BULL trend and a resistance level break *** a signal for DOWN /SELL is detected and alerted in a Bear trend and a support level break THE POWER OF THIS INDICATOR I USE IT WHEN YOU COMBINE ITS DAILY SIGNALS FROM DIFFERENT CHART SYMBOLS AT SAME TIME AND CLOSE ALL
https://www.mql5.com/en/market/product/94775

https://www.mql5.com/en/market/product/95708

PRICE Direction Predictor Indicator (LOW BUY PRICE 4 Limited time) This Indicator provides Buy/Sell Signal based on calculations on Higher frame (main Trend) and Lower frame(Entry signals) * You should select the higher and lower frame for indicator calculations * You select the Trend line colors as you prefer * Enable or disable Alerts! Trend lines UP/Down are drawn when a trend is detected Wait for small arrows for entry : *Normally an UP arrow in an UP Trend is a BUY signal
SYMBOL POWER based on inputted 5 time frames and Compared to 20 Other Symbols !! Great Indicator YOU DON'T HAVE TO SHIFT ON ALL TIME FRAMES FOR EACH CURRENCY PAIR TO CONCLUDE ITS TREND AND ITS POWER YOU HAVE IT ALL IN ONE TABLE , 20 CURRENCY PAIR WITH 5 TIME FRAMES ALSO , COMPARE BETWEEN CURRENCIES STRENGTH AND ALERTS THE STRONGER /WEAKER PAIR BASED ON 5 TIMEFRAMES CALCULATIONS ALEERTS enable /disable using 5 time frames M5 M30 H1 H4 and D1 ( latest version You SELECT you own 5 timeframes
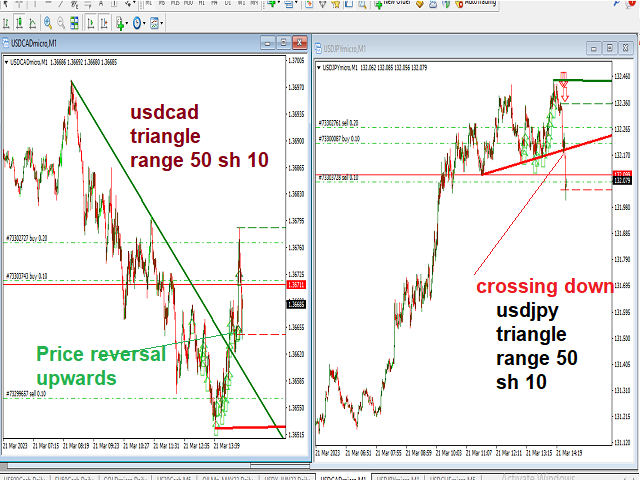
Strategy set to trade Triangle wedge break This is a simple very effective strategy based on detecting and showing triangle wedges formation Strategy set to trade Triangle wedge break Red Arrows appears on crossing triangle down Green Arrows appears on crossing triangle Up You can also trade lower and upper triangle limit :(new version may be released to allow arrows for side ways trading) ---Sell on price declines from High triangle Level - Buy on increasing from Lower triangle
Strategy set to trade Triangle wedge break This is a simple very effective strategy based on detecting and showing triangle wedges formation Strategy set to trade Triangle wedge break Red Arrows appears on crossing triangle down Green Arrows appears on crossing triangle Up You can also trade lower and upper triangle limit :(new version may be released to allow arrows for side ways trading) ---Sell on price declines from High triangle Level - Buy on increasing from Lower triangle
TRY DEMO BEFORE ANY RENT/PURSHASE !!!!!!!! Best Results obtained on USDJPY M30 - on microaccount(LotEquity = 5000) on Standardaccount(LotEquity = 500000) - this simple great expert advisor works with major weekly trend - It uses pattern weekly candle recognition for continuation or reversal in trend - It also scans the market history for 200 weeks ago to determine the percentage of trades success using its strategy - take care!! a no-trigger trade signal on Weekly basis
https://www.mql5.com/en/market/product/94903

TRY DEMO BEFORE ANY RENT/PURSHASE !!!!!!!! Best Results obtained on USDJPY M30 - on microaccount(LotEquity = 5000) on Standardaccount(LotEquity = 500000) - this simple great expert advisor works with major weekly trend - It uses pattern weekly candle recognition for continuation or reversal in trend - It also scans the market history for 200 weeks ago to determine the percentage of trades success using its strategy - take care!! a no-trigger trade signal on Weekly basis
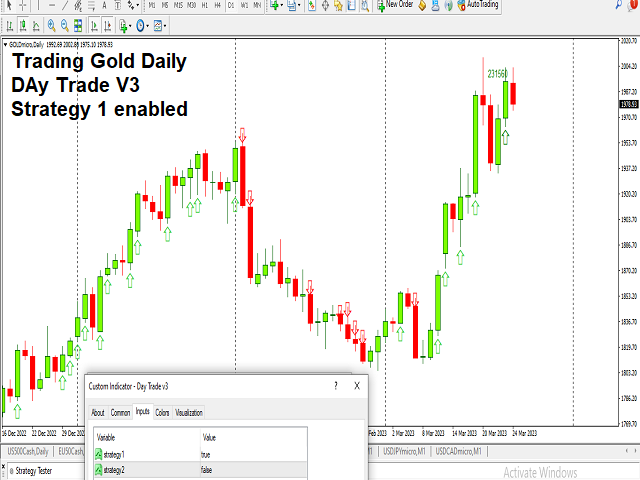
Simple and effective indicator based on some candle patterns recognition Arrows appear on candles when bear signal / bull signal based on candle pattern recognition -----> TWO strategies available you can enable / disable one of them Indicator can work on any chart and time frame I prefer to work on high time frames especially the Daily charts D1 and H4 Red arrows appears above candle showing a bear signal after candle completed - arrow will be blue during candle formation Green arrows
Simple and effective indicator based on some candle patterns recognition Arrows appear on candles when bear signal / bull signal based on candle pattern recognition -----> TWO strategies available you can enable / disable one of them Indicator can work on any chart and time frame I prefer to work on high time frames especially the Daily charts D1 and H4 Red arrows appears above candle showing a bear signal after candle completed - arrow will be blue during candle formation Green arrows
Auto redrawn Pivot support resistance horizontal lines with signal of Buy/Sell possibilities with SL level and with trend support resistance lines too used for all symbols and time frames you can adjust inputs parameters (only 2) and test it on various symbols and time frames input number of bars for calculation and moving average for signal accuracy example : use it on M30 time frame with input 200 for bars count and 100 for MA


