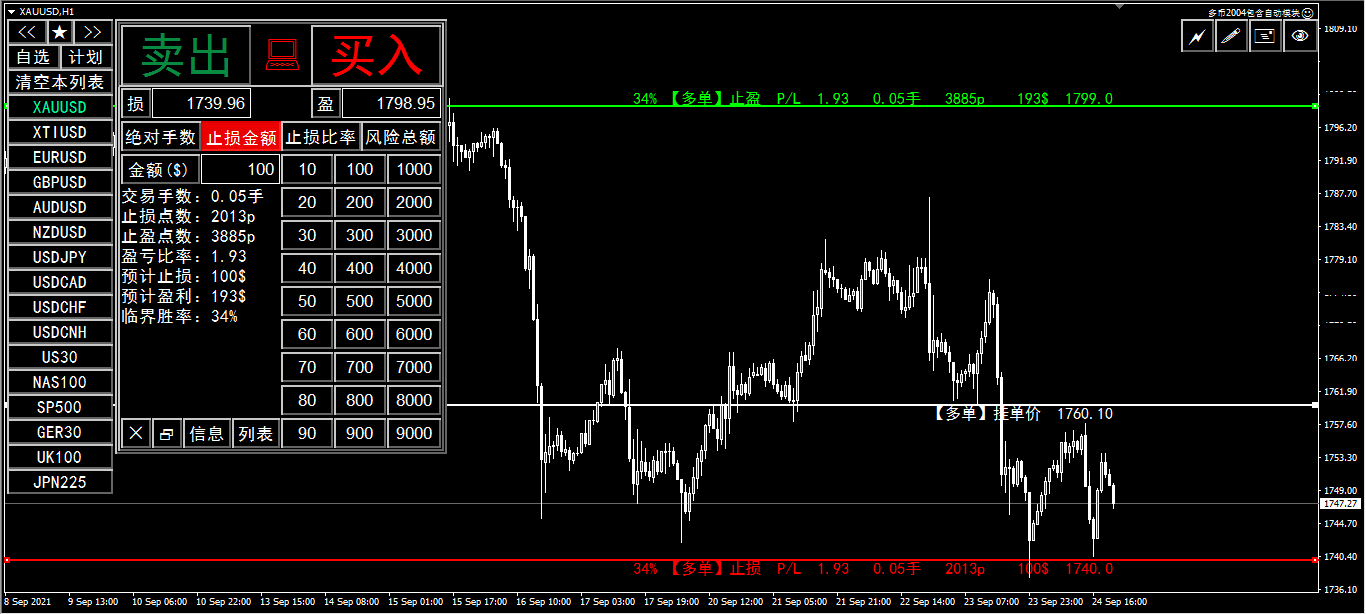
기능 목록: 인터페이스 유형:일반 모드와 솔로 모드; 거래량은 세 가지 모식을 확정한다:절대 숫자, 위험 금액과 위험 비율; 숫자 판넬 빠른 입력 숫자 또는 위험 금액; 고정손익비률-손익분기점, 선택 주문 일괄 풀 또는 선택 주문 일괄 수정 스톱하고 흑자; 단일 위험 검증 및 총 위험 통제; 포지션 손실의 변동, 이윤 확보, 포지션 감소 등 출장관리; 경보가격목록; 가격관측지역; 조합 간편한 긋는 선 지표 3.65 및 그 이상의 버전에서 조합 매칭 긋는 선 개평을 실현한다. 중국어와 영문 인터페이스 언어를 지원한다. 다른 차트를 쉽게 사용할 수 있습니다. 출장관리모듈의 주의사항: 이익 포인트 (effection point)-세 단계 중 하나 또는 두 개만 사용할 수 있지만, 그 순서는 엄격하게 점진적으로 증가해야 합니다. 보상 (보상)과 보상 (보상)-둘다 보상 (보상)을 설정할 경우 둘 중 하나만 설정할 수 있다. 예를 들어-105는 m1의 5배 atr-205는 m5의 5배
Part One : Characteristics Integrated line drawing and wave marking function Automatic adsorption( namely Auto Search High/Low )during Drawing Draw zigzag Lines and Fibo/Expansion at the same time Calculate the scale rate of Interval Spans which is called Qjt for short Continuously delete objects by click Deleting drawings in batch Show/Hide Drawings and Wave-Marks Quickly save current chart as picture to certain folder Show/Hide main panel by click
1. Compound Drawings (1) Line segment with arrow (2) Continuous line segment (broken line) (3) Parallelogram (4) Polygon (5) Profit and loss ratio measurement tools 2. Backtracking By the Z key in the process of drawing the line Line types that support Z-key backtracking: continuous line segments (broken line) ,channels,parallelograms,polygons, and fibo extensions. 3.Automatic Adsorption (1) Click the "Lock-Button" to switch the automatic adsorption switch before drawing
About testing Mode: You should download the version for MT4 to test instead. https://www.mql5.com/en/market/product/109093?source=Site+Market+My+Products+Page#description 1. Compound Drawings (1) Line segment with arrow (2) Continuous line segment (broken line) (3) Parallelogram (4) Polygon (5) Profit and loss ratio measurement tools 2. Backtracking By the Z key in the process of drawing the line Line types that support Z-key backtracking: continuous
About testing Mode: 1.To get the best usage experience please use the tick data to test and adjust the test speed to proper speed (tick price jump quickly but K bars scroll slowly)!!! 2.Click "Indicator Properties"-> Click "Reset" before testing the indicator to restore the default parameters of the indicator. 1. Compound Drawings (1) Line segment with arrow (2) Continuous line segment (broken line) (3) Parallelogram (4) Polygon (5) Profit and loss ratio measurement tools
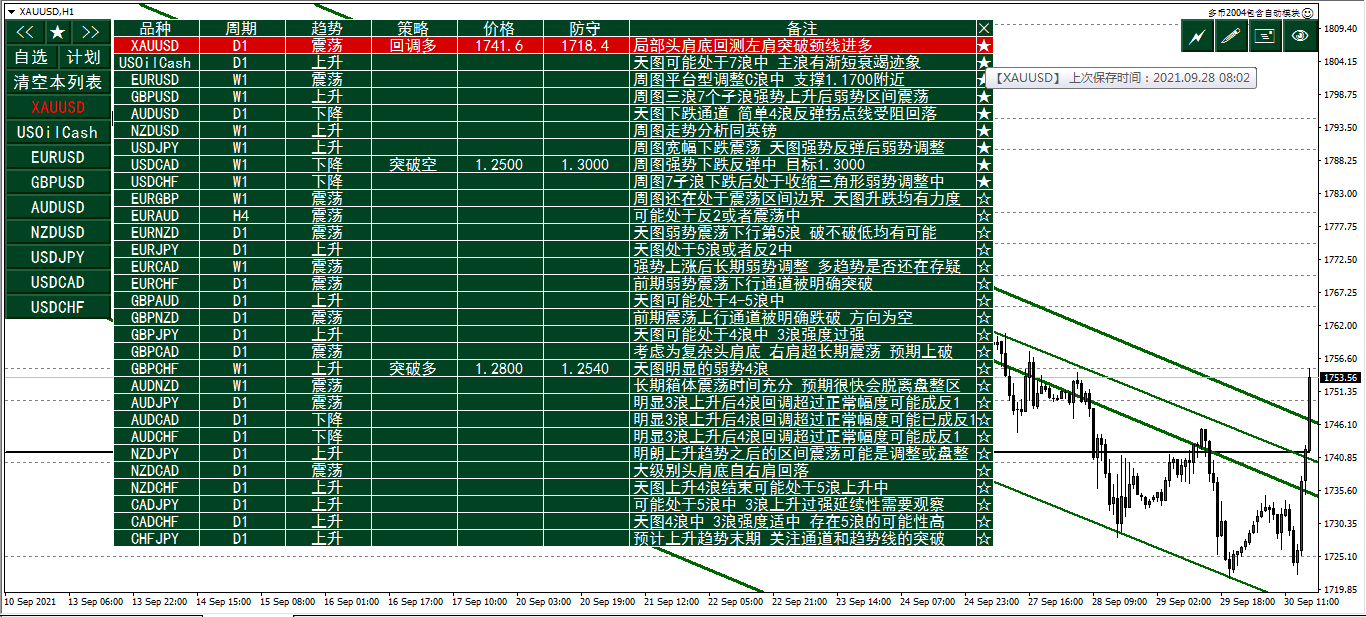
LuXiwu Trend Trading special wave marking tool 0.Main table show hide Click the bottom 10% area of price axis to show or hide main table,or by default key Q. 1. QJT search Click the high or low point of the main wave to automatically find the QJT . If there is overlap between the inner and outer intervals, click the button << or >> to adjust the left and right, or manually drag the adjustment after completion.If there is a failure wave, you can use the system's own