Visual Bollinger Bands Divergence
- 지표
- Luiz Felipe De Oliveira Caldas
- 버전: 1.0
- 활성화: 20
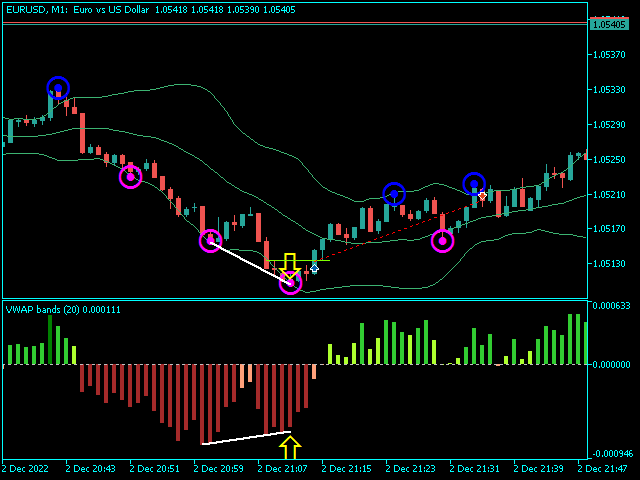
VWAP 밴드 비주얼 스타일 1.0
금융 시장 지표는 트레이더와 투자자가 금융 시장을 분석하고 의사 결정을 내리는 데 사용하는 필수 도구입니다. VWAP 및 Bollinger Bands는 트레이더가 시장 추세 및 가격 변동성을 측정하는 데 사용하는 두 가지 인기 있는 기술 분석 도구입니다. 이 제품에서는 두 지표를 결합하여 시장 동향과 변동성에 대한 종합적인 분석을 제공하는 고유한 제품을 만들 것을 제안합니다. 이 제품은 데이터 기반 분석을 기반으로 정보에 입각한 결정을 내리려는 거래자와 투자자에게 이상적입니다.
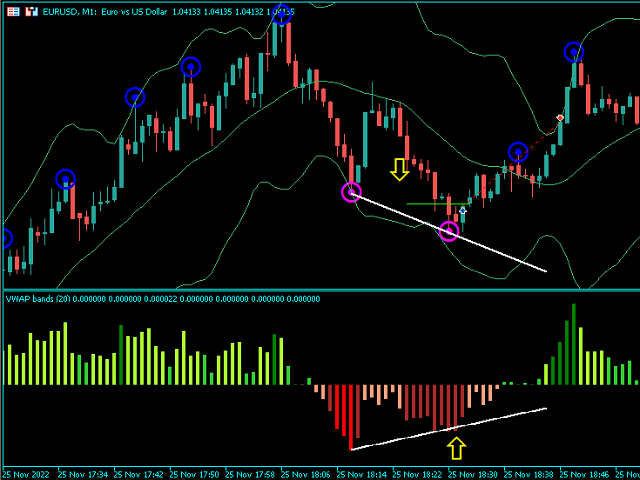
다이버전스 전략은 트레이더가 시장에서 잠재적인 추세 반전을 식별하는 데 사용하는 인기 있는 기술 분석 기법입니다. 이 전략은 가격 변동과 기술 지표 간의 차이를 식별하는 데 의존합니다. 이 섹션에서는 비주얼 스타일과 볼린저 밴드를 사용한 다이버전스 전략에 대해 설명합니다.
예를 들어 비주얼 스타일과 볼린저 밴드를 사용하는 다이버전스 전략은 트레이더가 시장에서 잠재적인 추세 반전을 식별하기 위해 사용하는 인기 있는 기술 분석 기법입니다. 이 전략은 RSI와 증권의 가격 행동 사이의 차이를 식별하는 데 의존합니다. 이 전략을 사용함으로써 트레이더는 데이터 기반 분석을 기반으로 정보에 입각한 결정을 내릴 수 있으므로 보다 수익성 있는 거래 및 투자로 이어집니다.


사용자가 평가에 대한 코멘트를 남기지 않았습니다