Keklik MA
- 지표
- Ai He Mai Ti • Ai Mai Ti
- 버전: 3.0
- 업데이트됨: 8 9월 2022
- 활성화: 5
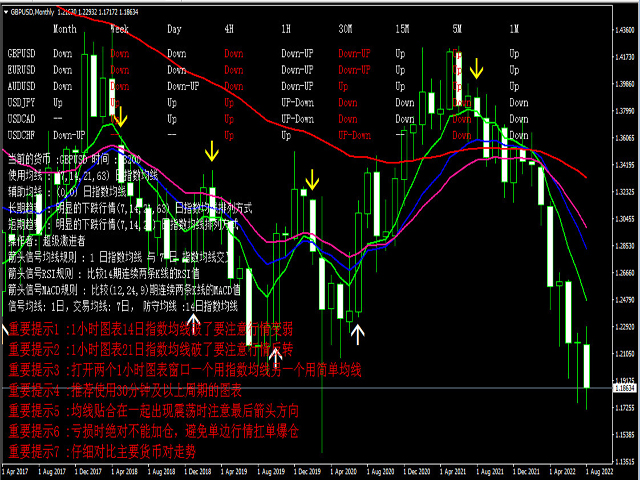
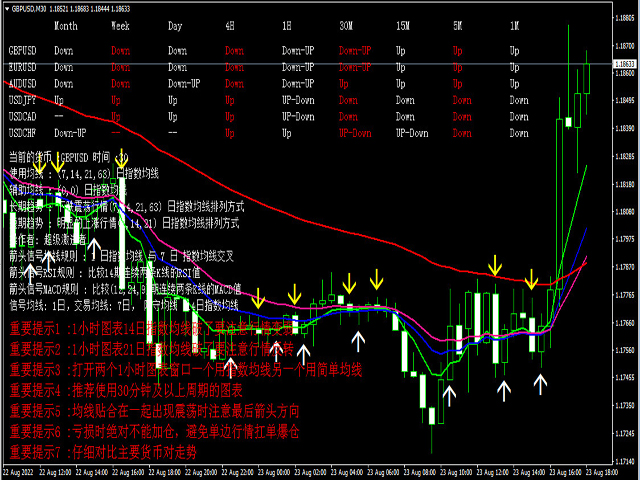
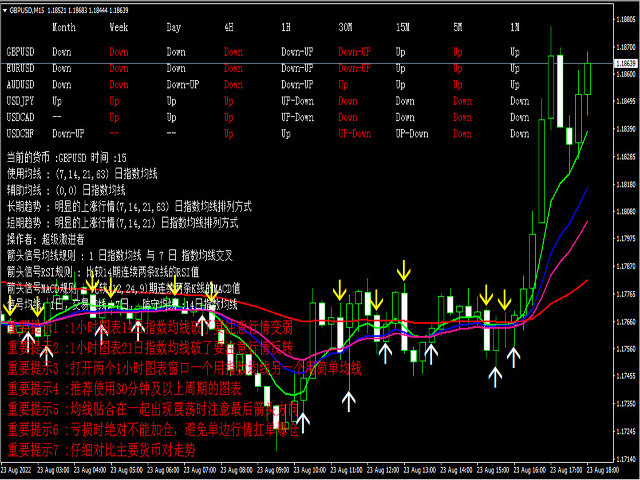
지표 이름: Keklik MA.
사용: MA, MACD, RSI 등의 기술 지표.
추천 주기: 1시간 도표.
장기적인 추세: EMA1, EMA2, EMA3, EMA4 균일선 배열 방식.평균선 기본값: 7, 14, 21, 63.
단기 추세: EMA1, EMA2, EMA3 균일선 배열 방식.
조작자 유형: 슈퍼 급진자, 급진자, 온건자.기본값 2. (0 안정자: 신호 균일선과 EMA3 교차, 1 급진자: 신호 균일선과 EMA2 교차, 3 슈퍼 급진자: 신호 균일선과 EMA1 교차)
화살표 신호: 균일선 규칙, RSI 규칙, MACD 규칙을 모두 충족합니다.
화살표 신호 균일선 규칙: 신호 균일선과 거래 균일선이 교차한다.
화살표 신호 RSI 규칙: 연속된 두 K선의 RSI 값을 비교합니다.
화살표 신호 MACD 규칙: 연속된 두 K선의 MACD 값을 비교합니다.
신호 균일선: Signal EMA, 거래 균일선: EMA1, 수비 균일선: EMA2.기본값: 1, 7, 14.
거래 알림:
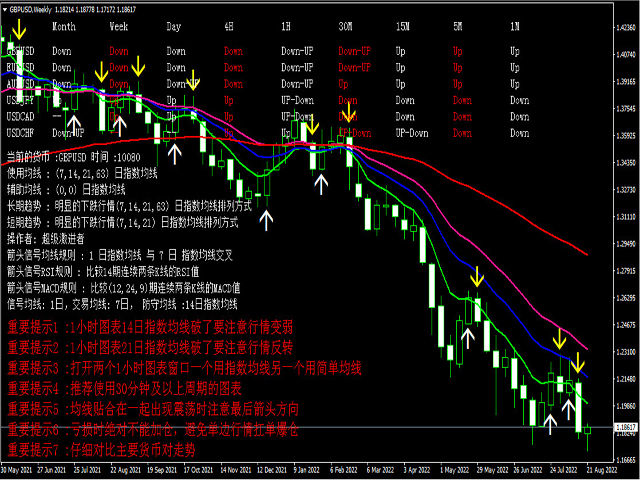
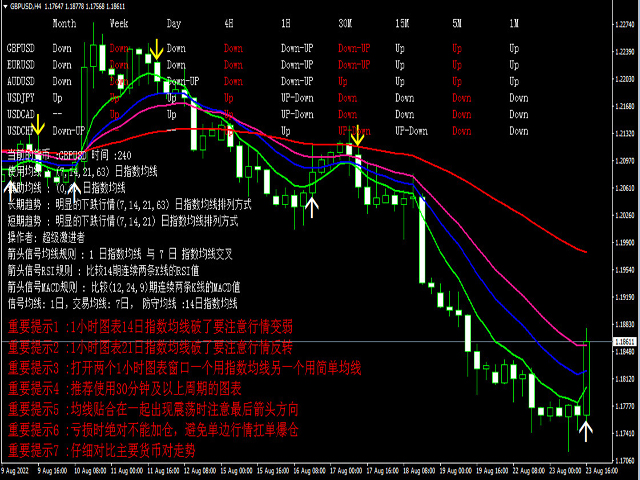
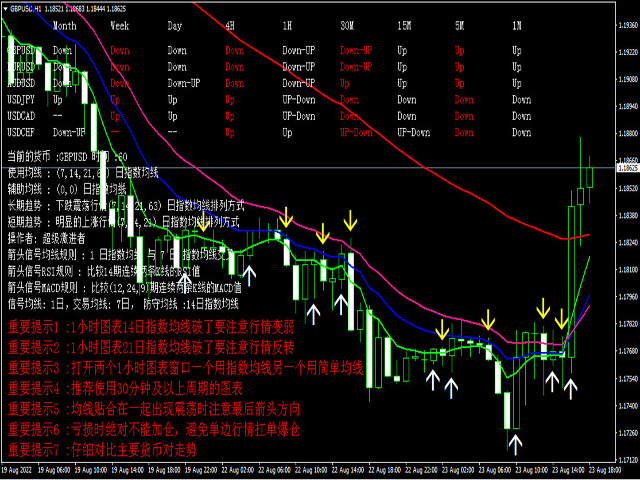
중요한 힌트 1: 1시간 도표 K선이 EMA2를 깨뜨렸으니 시세가 약해지는 것을 주의해야 한다.
중요 힌트 2: 1시간 도표 K선이 EMA3를 깨뜨렸으니 시세 반전에 주의해야 한다.
중요 알림 3: 2시간 1시간 도표 창을 열면 하나는 지수 균일선으로 하고 다른 하나는 단순 균일선으로 한다.
중요 팁 4: 30분 이상 주기의 도표를 사용하는 것을 추천합니다.
중요 팁 5: EMA1, EMA2, EMA3, EMA4가 함께 붙어 흔들릴 때 마지막 화살표 방향을 주의하십시오.
중요 제시 6: 손실 시 절대 창고를 늘릴 수 없으며, 일방적인 시세로 창고가 폭발하는 것을 피한다
중요 힌트 7: 주요 화폐의 동향을 자세하게 비교한다.
주요 화폐는 각 주기의 추세에 대해 참고해야 하며 달러 지수의 추세를 수시로 파악할 수 있다.