Keklik MA
- インディケータ
- Ai He Mai Ti • Ai Mai Ti
- バージョン: 3.0
- アップデート済み: 8 9月 2022
- アクティベーション: 5
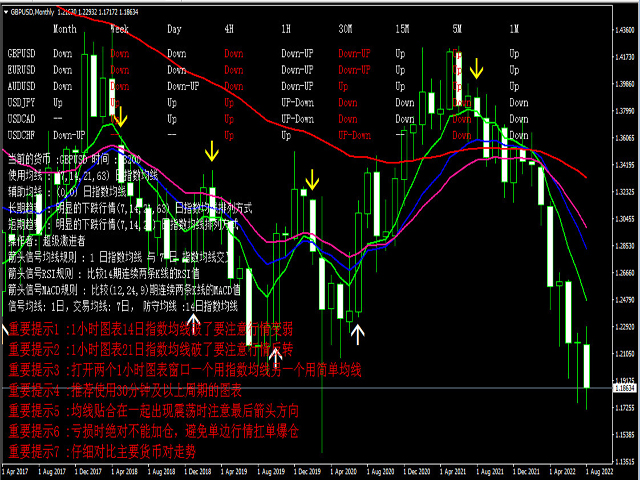
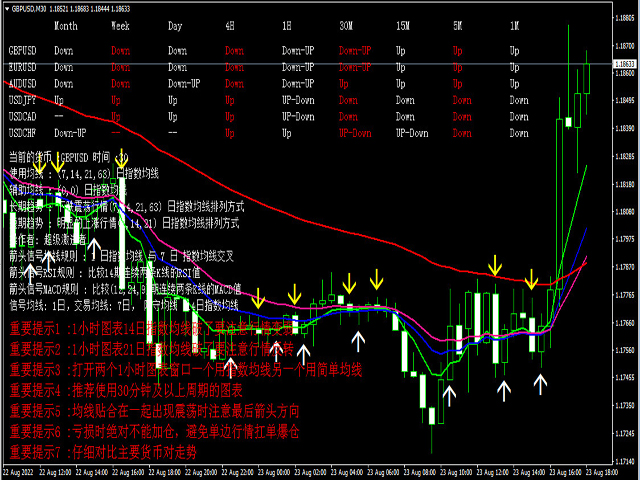
指標名称:Keklik MA.
使用:MA、MACD、RSIなどの技術指標。
推奨サイクル:1時間チャート。
長期トレンド:EMA 1、EMA 2、EMA 3、EMA 4の平均線配列方式。平均線の既定値:7、14、21、63。
短期トレンド:EMA 1、EMA 2、EMA 3均等線配列方式。
操作者タイプ:超急進者、急進者、穏健者。デフォルト値2.(0ロバスト者:信号平均線とEMA 3が交差し、1急進者:信号平均線とEMA 2が交差し、3超急進者:信号平均線とEMA 1が交差する。)
矢印信号:平均線規則、RSI規則、MACD規則を同時に満たす。
矢印信号平均線規則:信号平均線と取引平均線が交差する。
矢印信号RSI規則:連続する2つのK線のRSI値を比較する。
矢印信号MACD規則:連続する2つのK線のMACD値を比較する。
信号平均線:SiginalEMA、取引平均線:EMA 1、守備平均線:EMA 2。既定値:1、7、14。
取引注意:
重要なヒント1:1時間チャートK線が破れたEMA 2相場が弱くなることに注意してください。
重要なヒント2:1時間チャートK線が破れたEMA 3相場反転に注意。
重要なヒント3:2つの1時間グラフウィンドウを開き、1つは指数平均線で、もう1つは単純平均線で。
重要なヒント4:30分以上の周期のグラフを使用することを推奨します。
重要なヒント5:EMA 1、EMA 2、EMA 3、EMA 4がくっついて揺れているときは最後の矢印の方向に注意してください。
重要なヒント6:損失時には絶対に倉庫を追加してはならず、一方的な相場で単独の倉庫を担ぐのを避ける
重要なヒント7:主要通貨ペアの動きを注意深く比較する。
主要通貨の各サイクルの動きは、参考にして、いつでもドル指数の動きを把握することができます。