Support and Resistance Levels Finder MT5
- 지표
- Issam Kassas
- 버전: 1.40
- 업데이트됨: 28 10월 2022
지원 및 저항 수준 찾기 도구:
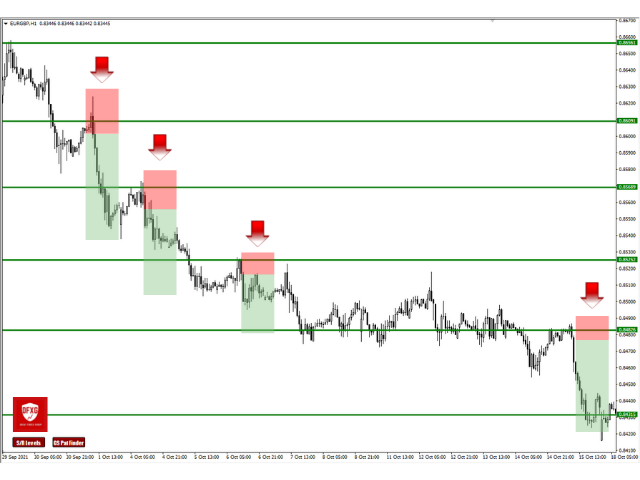
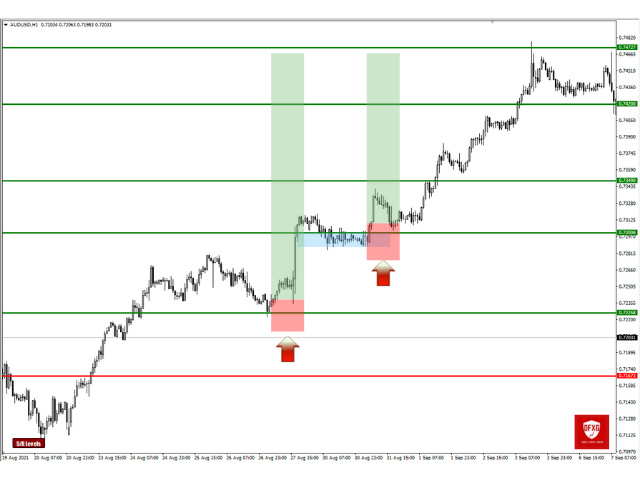
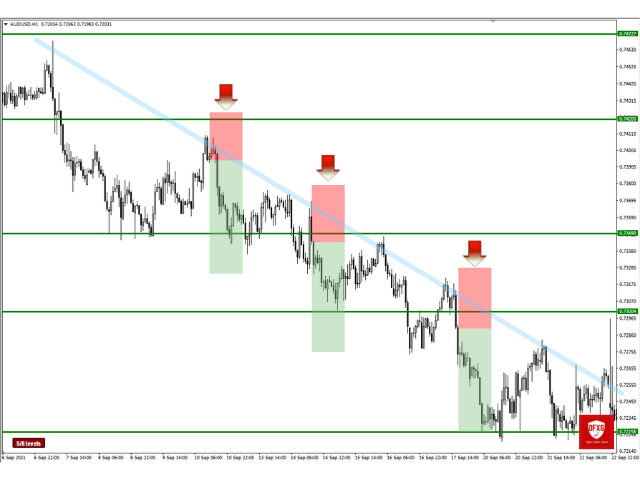
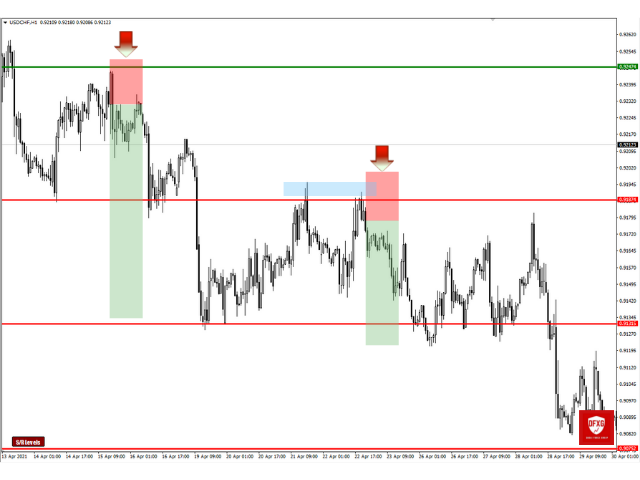
지원 및 저항 수준 찾기는 거래에서 기술적 분석을 향상시키기 위해 설계된 고급 도구입니다. 동적 지원 및 저항 수준을 갖추고 있어 차트에서 새로운 키포인트가 펼쳐짐에 따라 실시간으로 적응하여 동적이고 반응이 빠른 분석을 제공합니다. 독특한 다중 시간대 기능을 통해 사용자는 원하는 시간대에서 다양한 시간대의 지원 및 저항 수준을 표시할 수 있으며, 5분 차트에 일일 수준을 표시하는 등 세밀한 시각을 제공합니다. 역사적 데이터 세트를 포함한 스마트 알고리즘을 사용하여 다른 S&R 지표와 차별화되는 포괄적인 분석을 보장합니다. 수준을 감지할 때 다중 매개변수 계산을 사용하여 정확성을 높입니다. 사용자는 지원 및 저항 수준의 색상을 개별적으로 사용자 정의하여 개인화된 시각적 경험을 만들 수 있습니다. 도구에는 가격이 중요한 수준에 접근할 때 거래자에게 알림 기능이 포함되어 시기적절한 결정을 돕습니다. 숨기기 및 표시 버튼과 수준의 가시성을 빠르게 전환하기 위한 단축키와 같은 편리한 기능을 제공하여 지원 및 저항 수준 찾기는 기술적 분석에서 정확성과 유연성을 추구하는 트레이더들에게 다재다능하고 사용하기 쉬운 솔루션을 제공합니다.
특징:
- 동적 지원 및 저항 수준: 차트에서 새로운 중요한 키포인트가 펼쳐짐에 따라 조정됩니다.
- 다중 시간대 지원 및 저항 수준: 다른 시간대의 모든 시간대의 수준을 표시할 수 있는 기능. 예를 들어, M5의 일일 수준.
- 다른 S&R 지표와는 달리 역사적 데이터를 포함한 스마트 알고리즘 사용.
- 수준을 감지할 때 다중 매개변수 계산 사용.
- 정확한 지원 및 저항 수준.
- 개별적으로 지원 및 저항 수준의 색상 사용자 정의 가능.
- 가격이 중요한 수준에 접근할 때 경고.
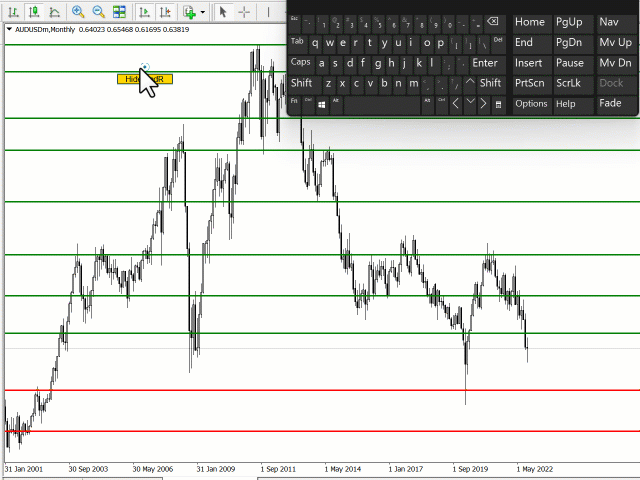
- 숨기기 및 표시 버튼이 함께 제공됩니다.
- 수준의 가시성을 전환하기 위한 단축키가 함께 제공됩니다.


I always use this indicator now.