Support and Resistance Levels Finder MT5
- インディケータ
- Issam Kassas
- バージョン: 1.40
- アップデート済み: 28 10月 2022
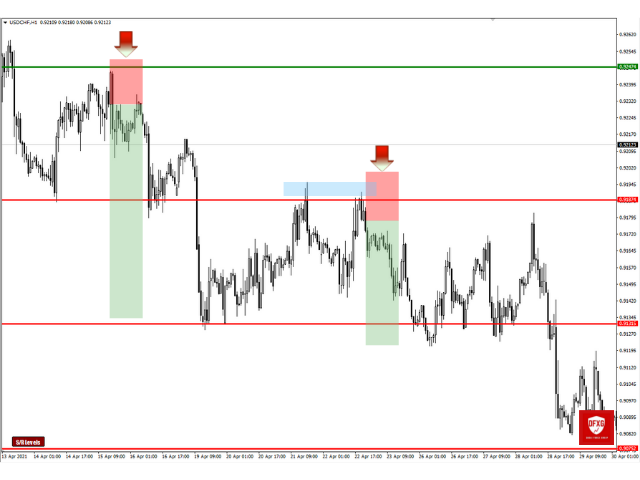
サポート&レジスタンスレベルファインダー:
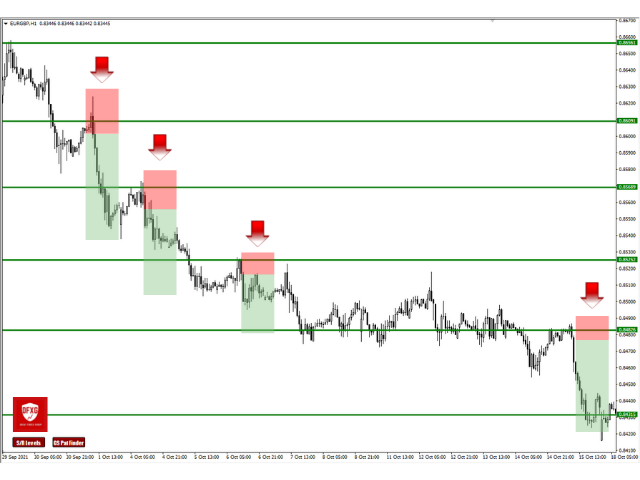
サポート&レジスタンスレベルファインダーは、取引におけるテクニカル分析を向上させるために設計された高度なツールです。ダイナミックなサポートとレジスタンスレベルを備えており、チャート上で新しいキーポイントが展開されるにつれてリアルタイムに適応し、ダイナミックかつレスポンシブな分析を提供します。そのユニークなマルチタイムフレーム機能により、ユーザーは任意の所望のタイムフレームで異なるタイムフレームからのサポートとレジスタンスレベルを表示でき、日足レベルを5分足のチャートに表示するなど、微妙な視点を提供します。歴史的データセットを組み込んだスマートアルゴリズムを利用しており、他のS&Rインジケーターとは異なる包括的な分析を確保しています。レベルの検出時には複数パラメータ計算を使用し、精度を向上させています。ユーザーは、サポートとレジスタンスレベルの色を個別にカスタマイズでき、パーソナライズされたビジュアルエクスペリエンスを作成できます。ツールには価格が重要なレベルに近づくとトレーダーに通知するアラート機能も含まれており、タイムリーな意思決定を促進します。隠す/表示ボタンやレベルの可視性を迅速に切り替えるためのホットキーなどの便利な機能を備えており、サポート&レジスタンスレベルファインダーは、テクニカル分析で精度と柔軟性を求めるトレーダーに対する多機能で使いやすいソリューションを提供します。
特徴:
- ダイナミックなサポートとレジスタンスレベル:チャート上で新しい重要なキーポイントが展開されるにつれて調整されます。
- マルチタイムフレームサポートとレジスタンスレベル:任意の他の時間枠で任意の時間枠のレベルを表示する機能。例えば、M5の日足レベル。
- 他のS&Rインジケーターとは異なり、歴史的データを含むスマートアルゴリズムを使用しています。
- レベルの検出時には複数のパラメータ計算を使用します。
- 正確なサポートとレジスタンスレベル。
- サポートとレジスタンスレベルを個別にカスタマイズ可能な色。
- 価格が重要なレベルに近づくとアラート。
- 隠すと表示のボタンが付属しています。
- レベルの可視性を切り替えるためのホットキーが付属しています。


good