• 미리보기
  • 리뷰 (26)
  • 코멘트 (73)
  • 새 소식

Support and Resistance Screener Pro MT5

4.78

Support And Resistance Screener는 하나의 지표 안에 여러 도구를 제공하는 MetaTrader에 대한 하나의 레벨 지표입니다. 사용 가능한 도구는 다음과 같습니다.

1. 시장 구조 스크리너.

2. 완고한 후퇴 영역.

3. 약세 후퇴 영역.

4. 일일 피벗 포인트

5. 주간 피벗 포인트

6. 월간 피벗 포인트

7. 고조파 패턴과 볼륨에 기반한 강력한 지지와 저항.

8. 은행 수준 구역.

LIMITED TIME OFFER : HV 지원 및 저항 표시기는 50 $ 및 평생 동안만 사용할 수 있습니다. ( 원래 가격 125$ )
MQL5 블로그에 액세스하면 분석 예제와 함께 모든 프리미엄 지표를 찾을 수 있습니다. 여기를 클릭하십시오.


주요 특징들

  • 고조파 및 볼륨 알고리즘을 기반으로 하는 강력한 지원 및 저항 영역.
  • Harmonic 및 Volume 알고리즘을 기반으로 한 강세 및 약세 풀백 영역.
  • 시장 구조 스크리너
  • 일간, 주간 및 월간 피벗 포인트.

실제 거래의 예

여기에서 지원 및 저항 지표의 실제 거래 예를 볼 수 있습니다. 여기를 클릭하십시오.


연락하다

질문이 있거나 도움이 필요하면 비공개 메시지를 통해 저에게 연락하십시오.


작가

SAYADI ACHREF, 핀테크 소프트웨어 엔지니어이자 Finansya의 설립자
리뷰 26
Medaka
166
Medaka 2025.03.14 00:46 
 

This is the best tool. In addition to my default pairs, I monitor the same pairs as the Trend Screener Pro. It allows me to see trend situations at a glance from M1 to MN multi-timeframes. This indicator's unique bank level accurately shows support and resistance. By combining it with the trend screener, it captures the early stages of trends and enables low-risk trading. Sayadi is friendly to users, gives accurate advice, and responds quickly to questions. Thank you so much!

R Bencheikh
57
R Bencheikh 2025.03.07 22:05 
 

The Support and Resistance Screener Pro for MT5 is a good tool for users seeking to enhance their market analysis. Its ability to accurately identify key support and resistance levels across multiple timeframes is impressive, providing a clear and actionable view of potential trading opportunities. The user-friendly interface and customizable alerts make it easy to stay on top of market movements without being overwhelmed. I appreciate the detailed insights and the efficiency it brings to the trading strategy. Thanks My Achraf.

USD Down
59
USD Down 2024.12.04 13:19 
 

this tool is very important to calculate the risk and using the lot calculator, you can get a good combination of support and resistance level in addition to calculating the risk, the cost is nothing compared to the advantage of having such as a tool in hands, the costumer service is very comprehensive and answerring the questions in clear and precise manner, i recommand this tool for all traders with the lot and size calculator you will never be in hasardous situation due to non calculated open positions .

추천 제품
Statistical Arbitrage Spread Generator for Cointegration [MT5] What is Pair Trading? Pair trading is a market-neutral strategy that looks to exploit the relative price movement between two correlated assets — instead of betting on the direction of the market. The idea? When two assets that usually move together diverge beyond a statistically significant threshold, one is likely mispriced. You sell the expensive one, buy the cheap one , and profit when they converge again. It’s a statistica
FREE
Laguerre SuperTrend Clouds   adds an Adaptive Laguerre averaging algorithm and alerts to the widely popular SuperTrend indicator. As the name suggests,   Laguerre SuperTrend Clouds (LSC)   is a trending indicator which works best in trendy (not choppy) markets. The SuperTrend is an extremely popular indicator for intraday and daily trading, and can be used on any timeframe. Incorporating Laguerre's equation to this can facilitate more robust trend detection and smoother filters. The LSC uses the
Noize Absorption Index
Ekaterina Saltykova
Noize Absorption Index - is the manual trading system that measures the difference of pressure between bears forces and bulls forces. Green line - is a noize free index that showing curent situation. Zero value of index shows totally choppy/flat market.Values above zero level shows how powerfull bullish wave is and values below zero measures bearish forces.Up arrow appears on bearish market when it's ready to reverse, dn arrow appears on weak bullish market, as a result of reverse expectation.
An indicator of pattern #31 ("Long Island") from Encyclopedia of Chart Patterns by Thomas N. Bulkowski. The second gap is in the opposite direction. Parameters: Alerts - show alert when an arrow appears   Push - send a push notification when an arrow appears (requires configuration in the terminal) GapSize - minimum gap size in points ArrowType - a symbol from 1 to 17 ArrowVShift - vertical shift of arrows in points   ShowLevels - show levels ColUp - color of an upward line ColDn - color of a d
Better RSI MT5
KO PARTNERS LTD
This Indicator enhances the default Relative Strength Index (RSI) by introducing several improvements. First, it visually highlights overbought and oversold regions by changing the RSI color from white to red. Second, it includes additional reference lines at 20, 40, 50, 60, and 80, providing a clearer framework for assessing RSI values. The most notable feature is the use of the middle 50-line to indicate the current market cycle. The color of the 50-line dynamically reflects the cycle: green f
Candlestick Pattern Scanner is a multi-timeframe and multi-symbol dashboard and alert system that checks all timeframes and currency pairs for different candlestick patterns that are formed in them. Scanner is integrated   with support and resistance zones so you can check the candlestick patterns in most important areas of the chart to find breakout and reversal patterns in the price chart. Download demo version   (works on M4,M6,M12,H3,H8 timeframes and 20 symbols of Market Watch window) Read
Trading Utility for Forex Currency Pairs Only not for Gold  Functions Auto Lot Calculation based on Risk Auto stoploss  Auto TakeProfit Breakeven Auto Close Half % Close in percentage with respect to the PIPs Pending Orders BuyLimit Sell Limit with distances BuyStop Sell Stop    with distances Trading Informations Risk in percentage For Multiple trades Combine Takeprofit and Combine Stoplosses
[ MT4 Version ] Supply and Demand Multitimeframe Supply and Demand Multitimeframe is the first indicator in the market that combines multiple aspects like trading volume, price structure and momentum to identify Supply and Demand zones for every asset. The Supply and Demand indicator analyzes simultaneously up to 4 different TFs and represents their information in the current graph. Its interactive UI highlights everytime the price enters a Supply or Demand zone even if the zones are not visible
US30NinjaMT5
Satyaseelan Shankarananda Moodley
US30 Ninja is a 5 minute scalping indicator that will let know you when there is a trade set up (buy or sell). Once the indicator gives the trade direction, you can open a trade and use a 30 pip stop loss and a 30 pip to 50 pip take profit. Please trade at own own risk. This indicator has been created solely for the US30 market and may not yield positive results on any other pair. 
Volality Index Scalper
Lesedi Oliver Seilane
5 (1)
Volality Index scalper indicator  Meant for Volality pairs such as Volality 10, 25, 50, 75 and 100 The indicator works on all timeframes from the 1 minute to the monthly timeframe the indicator is non repaint the indicator has 3 entry settings 1 color change on zero cross 2 color change on slope change 3 color change on signal line cross Orange line is your sell signal Blue line is your buy signal.
Welcome to the Ultimate Harmonic Patterns recognition indicator that is focused to detect advanced patterns. The Gartley pattern, Bat pattern, and Cypher pattern  are popular technical analysis tools used by traders to identify potential reversal points in the market. Our Ultimate Harmonic Patterns recognition Indicator is a powerful tool that uses advanced algorithms to scan the markets and identify these patterns in real-time. With our Ultimate Harmonic Patterns recognition Indicator, you ca
Owl Smart Levels MT5
Sergey Ermolov
4 (29)
MT4 버전  |  FAQ Owl Smart Levels Indicator 는 Bill Williams 의 고급 프랙탈, 시장의 올바른 파동 구조를 구축하는 Valable ZigZag, 정확한 진입 수준을 표시하는 피보나치 수준과 같은 인기 있는 시장 분석 도구를 포함하는 하나의 지표 내에서 완전한 거래 시스템입니다. 시장과 이익을 취하는 장소로. 전략에 대한 자세한 설명 표시기 작업에 대한 지침 고문-거래 올빼미 도우미의 조수 개인 사용자 채팅 ->구입 후 나에게 쓰기,나는 개인 채팅에 당신을 추가하고 거기에 모든 보너스를 다운로드 할 수 있습니다 힘은 단순함에 있습니다! Owl Smart Levels 거래 시스템은 사용하기 매우 쉽기 때문에 전문가와 이제 막 시장을 연구하고 스스로 거래 전략을 선택하기 시작한 사람들 모두에게 적합합니다. 전략 및 지표에는 눈에 보이지 않는 비밀 공식 및 계산 방법이 없으며 모든 전략 지표는 공개되어 있습니다. Owl Smart Levels를 사
ChangePeriod MT5
Kazuya Yamaoka
You can change the time period of the chart at the touch of a button. You can also change multiple charts at the touch of a button. You can also change multiple charts at the touch of a button,   saving you the trouble of changing time periods. We are live-streaming the actual operation of the system. Please check for yourself if it is usable. Please check it out for yourself. https://www.youtube.com/@ganesha_forex We do not guarantee your investment results. Investments should be made at you
Advanced Trading Chaos
Sergei Gurov
5 (1)
Advanced Trading Chaos  The main purpose of the indicator is to help the trader detect the signals described by Bill Williams in his books to make a quick and correct trading decision. 1)Bullish/Bearish Reversal Bar(BDB) 2) Divergent Bar(DB) 3) Second Sage Signal — the third consecutive Awesome Oscillator bar  4) Working fractals (Fractals that worked above/below the red forehead  5) Three bar coloring modes 5.1) Coloring of bars according to the AO indicator (Including the squatting bar) 5.2
Average True Daily Range is an indicator that displays support and resistance zones based on the average daily price range. It is used to determine the intraday trading space and risk-return ratio. It needs to be traded in conjunction with other indicators to determine the direction. This indicator is used for intraday trading, so the indicator is only displayed on D1 below periods. If you are interested in day trading based on trend trading, you can test my other indicator " magic finger "
PZ Chart Overlay MT5
PZ TRADING SLU
4 (1)
Master the market: harness the power of statistical arbitrage This indicator showcases the price action of multiple instruments on a single chart, enabling you to compare the fluctuations of different assets and seamlessly implement statistical arbitrage strategies. Its main usage is to find correlated symbols which are temporarily out of whack. [ Installation Guide | Update Guide | Troubleshooting | FAQ | All Products ] Find overbought or oversold currency pairs easily Plot up to six currency
Arrow Micro Scalper 는 스캘핑 및 단기 거래용으로 설계된 지표로 모든 차트 및 금융 상품(통화, 암호화폐, 주식, 금속)에 통합되어 있습니다. 그녀는 작업에서 파동 분석과 추세 방향 필터를 사용합니다. M1부터 H4까지의 시간대에 사용하는 것이 좋습니다. 표시기로 작업하는 방법. 표시기에는 설정 변경을 위한 2개의 외부 매개변수가 포함되어 있으며 나머지는 기본적으로 이미 구성되어 있습니다. 큰 화살표는 추세 방향의 변화를 나타내고 파란색 화살표는 하락 추세의 시작을 나타내며 분홍색 화살표는 상승 추세의 시작을 나타냅니다. " Only trending direction " 매개변수는 내부 트렌드를 사용하는 모드를 켜고 끄며 자신만의 트렌드를 사용하거나 트렌드 방향 없이 작업할 수 있는 기회를 제공합니다. 또한 트렌드에서만 트렌드 화살표 및 신호 화살표 표시를 켜거나 끕니다. . 지표의 가장 중요한 개체인 작은 신호 화살표는 "매수" 거래의 경우 분홍색, "매도" 거
Premium level Pro
Dmitriy Kashevich
Premium level is a unique indicator with more than 80% accuracy of correct predictions! This indicator has been tested for more than two months by the best Trading Specialists! The author's indicator you will not find anywhere else! From the screenshots you can see for yourself the accuracy of this tool! 1 is great for trading binary options with an expiration time of 1 candle. 2 works on all currency pairs, stocks, commodities, cryptocurrencies Instructions: As soon as the red arrow app
HMA Trend Professional MT5
Pavel Zamoshnikov
4.25 (4)
Improved version of the free HMA Trend indicator (for MetaTrader 4) with statistical analysis. HMA Trend is a trend indicator based on the Hull Moving Average (HMA) with two periods. HMA with a slow period identifies the trend, while HMA with a fast period determines the short-term movements and signals in the trend direction. The main differences from the free version: Ability to predict the probability of a trend reversal using analysis of history data. Plotting statistical charts for analyzi
우리의   Basic Support and Resistance   표시기는 기술 분석을 향상시키는 데 필요한 솔루션입니다.이 표시기는 차트/ MT4 버전 특징 피보나치 수준의 통합 : 지원 및 저항 수준과 함께 피보나치 수준을 표시하는 옵션과 함께, 우리의 지표는 시장 행동과 가능한 역전 영역에 대한 더 깊은 통찰력을 제공합니다. 성능 최적화 : 각 막대의 개구부에서만 확장 라인을 업데이트하는 옵션을 사용하여, 우리의 지표는 지원 및 저항 수준의 정확도를 희생하지 않고 최적의 성능을 보장합니다. 입력 주요 설정 Timeframe:  이 입력을 통해 차트에 더 높은 기간의 지지선과 저항선을 표시하도록 선택할 수 있습니다. Support/Resistance Strength [Number of Bars]:   이 입력을 사용하면 지지대와 저항의 강도를 결정할 수 있습니다.숫자가 높을수록지지/저항이 더 강해집니다. Price mode:  이 매개 변수를 사용하면 지원 및 저항 수준을
DYJ BoS
Daying Cao
DYJ BoS 지표는 다음을 포함하여 시장 구조 변화의 필수 요소를 자동으로 식별하고 표시합니다. 구조 돌파(BoS): 가격이 크게 움직여 이전 구조 지점을 돌파할 때 감지됩니다. 상승 추세선과 하락 추세선(UP & DN, 즉 연속적인 신고가와 신저가)을 표시하고, 가격이 이러한 선을 돌파하면 빨간색(BEAR)과 초록색(BULL) 화살표를 표시합니다. BoS는 일반적으로 가격이 이전 가격 움직임에 의해 확립된 스윙 저점이나 스윙 고점을 확실히 통과할 때 발생합니다. 가격이 스윙 하이보다 높거나 스윙 로우보다 낮게 움직일 경우, 이는 단순히 이전에 형성된 시장 구조를 깨는 것이므로 "브레이크아웃" 구조라고 합니다. 이는 종종 시장 심리와 추세 방향의 변화를 나타내며, 기존 추세가 지속되거나 새로운 추세가 시작됨을 알립니다. 일반적으로 마감 정확도를 높이기 위해 손절매와 이익실현을 설정하지 않는 것이 좋습니다. 최종 포지션은 일반적으로 같은 방향의 다음 돌파점에서 마감되거나 반
Gap island MT5
Dmitry Fedoseev
An indicator of pattern #30 ("Island Reversal") from Encyclopedia of Chart Patterns by Thomas N. Bulkowski (two gaps, the second gap is in the direction of the first one). Parameters: Alerts - show alert when an arrow appears   Push - send a push notification when an arrow appears (requires configuration in the terminal) GapSize - minimum gap size in points ArrowType - a symbol from 1 to 17 ArrowVShift - vertical shift of arrows in pixels ShowLevels - show levels ColUp - color of an upward line
The   Supply and Demand Zones indicator   is one of the best tools we have ever made. This great tool automatically draws supply and demand zones, the best places for opening and closing positions. It has many advanced features such as multi timeframe zones support, displaying the width of zones, alert notifications for retouched zones, and much more. Because of market fractality, this indicator can be used for any kind of trading. Whether you are a positional, swing, or intraday trader does no
This indicator studies price action as an aggregation of price and time vectors, and uses the average vector to determine the direction and strength of the market. This indicator highlights the short-term directionality and strength of the market, and can be used to capitalize from short-term price movements by trading breakouts or binary options   [ Installation Guide | Update Guide | Troubleshooting | FAQ | All Products ] Find market direction easily Confirm with breakouts or other indicators
Fibo Channels
Jeffrey Quiatchon
Fibo Daily Channel Indicator The  Indicator is a powerful tool for traders, providing precise daily support and resistance levels based on Fibonacci retracement and extension calculations. This indicator automatically draws key pivot points (PP, R1, R2, S1, S2) as well as additional extension levels (R3, R4, S3, S4), helping traders identify potential reversal and breakout zones with ease. It includes customizable alerts and push notifications, allowing traders to receive updates whenever the pr
PZ Support Resistance MT5
PZ TRADING SLU
4.17 (6)
Unlock key market insights with automated support and resistance lines Tired of plotting support and resistance lines? This is a multi-timeframe indicator that detects and plots supports and resistance lines in the chart with the same precision as a human eye would. As price levels are tested over time and its importance increases, the lines become thicker and darker, making price leves easy to glance and evaluate. [ Installation Guide | Update Guide | Troubleshooting | FAQ | All Products ] Boos
PipFinite Energy Beam MT5
Karlo Wilson Vendiola
Pipfinite creates unique, high quality and affordable trading tools. Our tools may or may not work for you, so we strongly suggest to try the Demo Version for MT4 first. Please test the indicator prior to purchasing to determine if it works for you. We want your good reviews, so hurry up and test it for free...we hope you will find it useful. Combo Energy Beam with Swing Control Strategy: Confirm swing pullback signals Watch Video: (Click Here) Energy Beam with Trend Laser Strategy: Confirm Tre
Swing Points
Usiola Oluwadamilol Olagundoye
Swing Points Indicator for MetaTrader 5 The **Swing Points Indicator** is a custom-built technical tool designed for MetaTrader 5 (MT5), primarily used for identifying crucial reversal points in price action. By plotting swing highs and swing lows, it highlights potential trend reversals, making it a valuable tool for traders relying on price action analysis. This indicator helps traders anticipate changes in market direction by visually marking significant turning points on the chart. Main F
Magic sl NASDAQ 100
Benyamin Naser Mokhtari Karchegani
The indicator now at your disposal is undoubtedly one of the best tools for trading in the NASDAQ 100 market, especially in the 1-minute and 5-minute timeframes. This indicator is meticulously designed for high precision and can be adjusted for other timeframes as well. Simply run it and receive good exit signals. Key Features: Specialized performance in the 1-minute and 5-minute timeframes: While this indicator works in other timeframes as well, its primary focus is on these two timeframes. Co
Ultimate Supply Demand MT5
Ramon Sobrevals Arce
5 (4)
After working during many months, with the help of Neural Networks, we have perfected the ultimate tool you are going to need for identifying key price levels (Supports and Resistances) and Supply and Demand zones. Perfectly suitable to trigger your trades, set up your future actions, decide your Take Profit and Stop Loss levels, and confirm the market direction. Price will always move between those levels, bouncing or breaking; from one zone to another, all the remaining movements are just mark
이 제품의 구매자들이 또한 구매함
Algo Pumping
Ihor Otkydach
5 (8)
PUMPING STATION – 당신만을 위한 올인원(All-in-One) 전략 PUMPING STATION은 당신의 외환 거래를 더욱 흥미롭고 효과적으로 바꿔줄 혁신적인 인디케이터입니다. 단순한 보조 도구가 아니라, 강력한 알고리즘을 갖춘 완전한 거래 시스템으로서 보다 안정적인 트레이딩을 시작할 수 있도록 도와줍니다. 이 제품을 구매하시면 다음의 혜택을 무료로 받으실 수 있습니다: 전용 설정 파일: 자동 설정으로 최대의 퍼포먼스를 제공합니다. 단계별 동영상 가이드: PUMPING STATION 전략으로 거래하는 법을 배워보세요. Pumping Utility: PUMPING STATION과 함께 사용하도록 설계된 반자동 거래 봇으로, 거래를 더욱 쉽고 편리하게 만들어줍니다. ※ 구매 후 바로 저에게 메시지를 보내주세요. 추가 자료에 대한 접근 권한을 제공해드립니다. PUMPING STATION은 어떻게 작동하나요? 트렌드 컨트롤: 시장의 추세 방향을 즉시 파악합니다. 추세는 최고의
Golden Trend Indicator MT5
Noha Mohamed Fathy Younes Badr
4.89 (18)
Golden Trend indicator  is The best indicator for predicting trend movement this indicator never lags and never repaints and never back paints    and give  arrow buy and sell    before the candle appear  and it will help you and  will make your trading decisions clearer its work on all currencies and  gold and crypto and all time frame This unique  indicator uses very secret algorithms to catch the  trends, so you can trade using this indicator and see the trend clear on charts  manual guide and
Quantum TrendPulse
Bogdan Ion Puscasu
5 (13)
SuperTrend   ,   RSI   ,   Stochastic   의 힘을 하나의 포괄적인 지표로 결합하여 트레이딩 잠재력을 극대화하는 궁극의 트레이딩 도구   인 Quantum TrendPulse를   소개합니다. 정밀성과 효율성을 추구하는 트레이더를 위해 설계된 이 지표는 시장 추세, 모멘텀 변화, 최적의 진입 및 종료 지점을 자신 있게 식별하는 데 도움이 됩니다. 주요 특징: SuperTrend 통합:   주요 시장 추세를 쉽게 따라가고 수익성의 물결을 타세요. RSI 정밀도:   매수 과다 및 매도 과다 수준을 감지하여 시장 반전 시점을 파악하는 데 적합하며 SuperTrend 필터로 사용 가능 확률적 정확도:   변동성이 큰 시장에서 숨겨진 기회를 찾기 위해 확률적 진동   을 활용하고 SuperTrend의 필터로 사용 다중 시간대 분석:   M5부터 H1 또는 H4까지 다양한 시간대에 걸쳐 시장을 최신 상태로 유지하세요. 맞춤형 알림:   맞춤형 거래 조건이 충족되면
TPSproTREND PrO MT5
Roman Podpora
4.72 (18)
VERSION MT4        —        ИНСТРУКЦИЯ RUS           —        INSTRUCTIONS  ENG 주요 기능: 렌더링 없이 정확한 입력 신호! 신호가 나타나면 관련성은 유지됩니다! 이는 신호를 제공한 후 변경하여 예금 자금 손실을 초래할 수 있는 다시 그리기 지표와의 중요한 차이점입니다. 이제 더 큰 확률과 정확도로 시장에 진입할 수 있습니다. 화살표가 나타난 후 목표에 도달(이익실현)하거나 반전 신호가 나타날 때까지 캔들을 색칠하는 기능도 있습니다. STOP LOSS / TAKE PROFIT 구역 표시 진입점 검색 시 시각적 명확성을 높이기 위해 시장 진입을 위한 최적 지점이 검색되는 BUY/SELL 영역을 초기에 표시하는 모듈을 만들었습니다. 정지 손실 수준 작업을 위한 추가 지능형 논리는 시간이 지남에 따라 크기를 줄이는 데 도움이 되므로 거래에 들어갈 때 초기 위험을 줄이는 데 도움이 됩니다(move sl). 더 높은 기간의 MIN
Grabber System MT5
Ihor Otkydach
5 (5)
탁월한 기술적 지표인 Grabber를 소개합니다. 이 도구는 즉시 사용 가능한 “올인원(All-Inclusive)” 트레이딩 전략으로 작동합니다. 하나의 코드 안에 강력한 시장 기술 분석 도구, 매매 신호(화살표), 알림 기능, 푸시 알림이 통합되어 있습니다. 이 인디케이터를 구매하신 모든 분들께는 다음의 항목이 무료로 제공됩니다: Grabber 유틸리티: 오픈 포지션을 자동으로 관리하는 도구 단계별 영상 매뉴얼: 설치, 설정, 그리고 실제 거래 방법을 안내 맞춤형 세트 파일: 인디케이터를 빠르게 자동 설정하여 최고의 성과를 낼 수 있도록 도와줍니다 다른 전략은 이제 잊어버리세요! Grabber만이 여러분을 새로운 트레이딩의 정점으로 이끌어 줄 수 있습니다. Grabber 전략의 주요 특징: 거래 시간 프레임: M5부터 H4까지 거래 가능한 자산: 어떤 자산이든 사용 가능하지만, 제가 직접 테스트한 종목들을 추천드립니다 (GBPUSD, GBPCAD, GBPCHF, AUDCAD, AU
MTF Supply Demand Zones MT5
Georgios Kalomoiropoulos
5 (1)
자동화된 수요 및 공급 구역의 차세대. 모든 차트에서 작동하는 새롭고 혁신적인 알고리즘. 모든 구역은 시장의 가격 움직임에 따라 동적으로 생성됩니다. 두 가지 유형의 경고 --> 1)가격이 영역에 도달할 때 2)새로운 영역이 형성될 때 당신은 더 이상 쓸모없는 지표를 얻을 수 없습니다. 입증된 결과로 완벽한 거래 전략을 얻을 수 있습니다.     새로운 기능:     가격이 공급/수요 영역에 도달하면 경고     새로운 공급/수요 구역이 생성되면 알림     푸시 알림 알림     핍의 영역 너비 레이블     기동특무부대에 한 번 더 시간이 주어집니다. 따라서 현재보다 위의 2개의 시간 프레임 대신 현재보다 높은 3개의 시간 프레임을 볼 수 있습니다.     Alerts/Zones/MTF 기능을 활성화/비활성화하는 버튼 당신이 얻는 이점:     거래에서 감정을 제거하십시오.     거래 항목을 객관화하십시오.     높은 확률 설정을 사용하여 수익
FX Power MT5 NG
Daniel Stein
5 (14)
FX Power: 통화 강세 분석으로 더 스마트한 거래 결정을 개요 FX Power 는 어떤 시장 상황에서도 주요 통화와 금의 실제 강세를 이해하기 위한 필수 도구입니다. 강한 통화를 매수하고 약한 통화를 매도함으로써 FX Power 는 거래 결정을 단순화하고 높은 확률의 기회를 발견합니다. 트렌드를 따르거나 극단적인 델타 값을 사용해 반전을 예측하고자 한다면, 이 도구는 귀하의 거래 스타일에 완벽히 적응합니다. 단순히 거래하지 말고, FX Power 로 더 스마트하게 거래하세요. 1. FX Power가 거래자에게 매우 유용한 이유 통화와 금의 실시간 강세 분석 • FX Power 는 주요 통화와 금의 상대적 강세를 계산하고 표시하여 시장 역학에 대한 명확한 통찰력을 제공합니다. • 어떤 자산이 앞서고 있고 어떤 자산이 뒤처지는지 모니터링하여 보다 현명한 거래 결정을 내릴 수 있습니다. 포괄적인 멀티 타임프레임 뷰 • 단기, 중기 및 장기 타임프레임에서 통화와 금의 강세를
FX Volume MT5
Daniel Stein
4.82 (17)
FX Volume: 브로커 시각에서 바라보는 진짜 시장 심리 간단 요약 트레이딩 접근 방식을 한층 더 향상시키고 싶으신가요? FX Volume 는 소매 트레이더와 브로커의 포지션을 실시간으로 파악할 수 있게 해 줍니다. 이는 COT 같은 지연된 보고서보다 훨씬 빠릅니다. 꾸준한 수익을 추구하는 분이든, 시장에서 더 깊은 우위를 원하시는 분이든, FX Volume 을 통해 대규모 불균형을 찾아내고, 돌파 여부를 확인하며 리스크 관리를 정교화할 수 있습니다. 지금 시작해 보세요! 실제 거래량 데이터가 의사결정을 어떻게 혁신할 수 있는지 직접 경험해 보시기 바랍니다. 1. 트레이더에게 FX Volume이 매우 유익한 이유 탁월한 정확도를 지닌 조기 경보 신호 • 다른 사람들보다 훨씬 앞서, 각 통화쌍을 매수·매도하는 트레이더 수를 거의 실시간으로 파악할 수 있습니다. • FX Volume 은 여러 리테일 브로커에서 추출한 실제 거래량 데이터를 종합해 명확하고 편리한 형태로 제공하는
TPSpro RFI Levels MT5
Roman Podpora
4.55 (20)
주요 플레이어의 반전 구역 / 피크 볼륨 / 활성 구역 =       TS TPS프로시스템 지침 RUS       /       지침       영어       /           버전 MT4        이 지표를 구매한 모든 구매자는 또한 다음을 무료로 받습니다. RFI SIGNALS 서비스의 거래 신호에 6개월 동안 액세스할 수 있습니다. TPSproSYSTEM 알고리즘에 따른 즉시 사용 가능한 진입 포인트입니다. 정기적으로 업데이트되는 교육 자료 - 전략에 푹 빠져서 전문가 수준을 높여보세요. 주중 24/5 지원 및 비공개 트레이더 채팅 이용 - 시장 상황에 대한 소통, 지원 및 분석. 저자가 설정한 파일 - 별도의 노력 없이 최대 결과를 얻을 수 있도록 지표를 자동으로 설정합니다. 주요 기능: 판매자와 구매자의 활동 영역을 표시합니다! 이 지표는 매수 및 매도에 대한 모든 올바른 첫 번째 임펄스 레벨/존을 표시합니다. 진입점 검색이 시작되는 이러한 레벨/존이 활성화되면
Matrix Arrow Indicator MT5
Juvenille Emperor Limited
5 (13)
매트릭스 화살표 표시기 MT5 는 외환, 상품, 암호 화폐, 지수, 주식과 같은 모든 기호/도구에 사용할 수 있는 100% 다시 칠하지 않는 다중 기간 표시기를 따르는 고유한 10 in 1 추세입니다.  Matrix Arrow Indicator MT5 는 다음과 같은 최대 10개의 표준 지표에서 정보와 데이터를 수집하여 초기 단계에서 현재 추세를 결정합니다. 평균 방향 이동 지수(ADX) 상품 채널 지수(CCI) 클래식 하이켄 아시 캔들 이동 평균 이동 평균 수렴 발산(MACD) 상대 활력 지수(RVI) 상대 강도 지수(RSI) 포물선 SAR 스토캐스틱 오실레이터 윌리엄스의 백분율 범위 모든 지표가 유효한 매수 또는 매도 신호를 제공하면 강력한 상승/하락 추세를 나타내는 다음 캔들/막대가 시작될 때 해당 화살표가 차트에 인쇄됩니다. 사용자는 사용할 표시기를 선택하고 각 표시기의 매개변수를 개별적으로 조정할 수 있습니다. 매트릭스 화살표 표시기 MT5는 선택한 표시기에서만 정보를 수
FX Levels MT5
Daniel Stein
5 (4)
FX Levels: 모든 시장을 위한 뛰어난 정확도의 지지와 저항 간단 요약 통화쌍, 지수, 주식, 원자재 등 어떤 시장이든 믿을 만한 지지·저항 레벨을 찾고 싶나요? FX Levels 는 전통적인 “Lighthouse” 기법과 첨단 동적 접근을 결합해, 거의 보편적인 정확성을 제공합니다. 실제 브로커 경험을 반영하고, 자동화된 일별 업데이트와 실시간 업데이트를 결합함으로써 FX Levels 는 가격 반전 포인트를 파악하고, 수익 목표를 설정하며, 자신 있게 트레이드를 관리할 수 있게 돕습니다. 지금 바로 시도해 보세요—정교한 지지/저항 분석이 어떻게 여러분의 트레이딩을 한 단계 끌어올릴 수 있는지 직접 확인하세요! 1. FX Levels가 트레이더에게 매우 유용한 이유 뛰어난 정확도의 지지·저항 존 • FX Levels 는 다양한 브로커 환경에서도 거의 동일한 존을 생성하도록 설계되어, 데이터 피드나 시간 설정 차이로 인한 불일치를 해소합니다. • 즉, 어떤 브로커를 사용하
ATrend
Zaha Feiz
4.77 (13)
ATREND: 작동 방식 및 사용 방법 ### 작동 방식 MT5 플랫폼을 위한 "ATREND" 지표는 기술 분석 방법론의 조합을 활용하여 트레이더에게 강력한 매수 및 매도 신호를 제공하도록 설계되었습니다. 이 지표는 주로 변동성 측정을 위해 평균 진폭 범위(ATR)를 활용하며, 잠재적인 시장 움직임을 식별하기 위한 트렌드 탐지 알고리즘과 함께 사용됩니다. 구매 후 메시지를 남기면 특별 보너스 선물을 받게 됩니다. ### 주요 특징: - 동적 트렌드 탐지: 이 지표는 시장 트렌드를 평가하고 신호를 조정하여 트레이더가 현재 시장 상황에 맞춰 전략을 조정할 수 있도록 돕습니다. - 변동성 측정: ATR을 사용하여 시장의 변동성을 측정하며, 이는 최적의 손절매(SL) 및 이익 실현(TP) 수준을 결정하는 데 중요합니다. - 신호 시각화: 이 지표는 차트에 매수 및 매도 신호를 시각적으로 표시하여 트레이더의 의사 결정을 향상시킵니다. ### 운영 단계 #### 입력 및 설정 - TimeFr
MetaBands M5
Vahidreza Heidar Gholami
4.5 (2)
MetaBands uses powerful and unique algorithms to draw channels and detect trends so that it can provide traders with potential points for entering and exiting trades. It’s a channel indicator plus a powerful trend indicator. It includes different types of channels which can be merged to create new channels simply by using the input parameters. MetaBands uses all types of alerts to notify users about market events. Features Supports most of the channel algorithms Powerful trend detection algorith
The   Time_Price_SQ9_Degree   indicator is based on the 9 Gann square. Using this indicator, you can identify strong time and price zones. The indicator displays the levels as a degree value. The degrees can be set in the settings. After launching, the MENU button appears. If it is highlighted, it can be moved to any point on the graph, and after double-clicking on it, it stops being highlighted and menu buttons appear. To hide the menu, just double-click on the button, it will become highlight
Entry Points Pro for MT5
Yury Orlov
4.46 (130)
다시 색을 칠하지 않고 거래에 진입할 수 있는 정확한 신호를 제공하는 MT5용 지표입니다. 외환, 암호화폐, 금속, 주식, 지수 등 모든 금융 자산에 적용할 수 있습니다. 매우 정확한 추정값을 제공하고 매수와 매도의 가장 좋은 시점을 알려줍니다. 하나의 시그널로 수익을 내는 지표의 예와 함께 비디오 (6:22)시청하십시오! 대부분의 거래자는 Entry Points Pro 지표의 도움으로 첫 거래 주 동안 트레이딩 결과를 개선합니다. 저희의   Telegram Group 을 구독하세요! Entry Points Pro 지표의 좋은점. 재도색이 없는 진입 신호 신호가 나타나고 확인되면(시그널 캔들이 완성된 경우) 신호는 더 이상 사라지지 않습니다. 여타 보조지표의 경우 신호를 표시한 다음 제거되기 때문에 큰 재정적 손실로 이어집니다. 오류 없는 거래 게시 알고리즘을 통해 트레이드(진입 또는 청산)를 할 이상적인 순간을 찾을 수 있으며, 이를 통해 이를 사용하는 모든 거래자의 성공률이
이 지표를 구매하신 분께는 다음과 같은 혜택이 무료로 제공됩니다: 각 거래를 자동으로 관리하고, 손절/익절 수준을 설정하며, 전략 규칙에 따라 거래를 종료하는 전용 도우미 툴 "Bomber Utility" 다양한 자산에 맞게 지표를 설정할 수 있는 셋업 파일(Set Files) "최소 위험", "균형 잡힌 위험", "관망 전략" 모드로 설정 가능한 Bomber Utility의 셋업 파일 이 전략을 빠르게 설치, 설정, 시작할 수 있도록 돕는 단계별 영상 매뉴얼 주의: 위의 모든 보너스를 받기 위해서는 MQL5 개인 메시지 시스템을 통해 판매자에게 연락해 주세요. 독창적인 커스텀 지표인 “Divergence Bomber(다이버전스 봄버)”를 소개합니다. 이 지표는 MACD 다이버전스(괴리) 전략을 기반으로 한 올인원(All-in-One) 거래 시스템입니다. 이 기술 지표의 주요 목적은 가격과 MACD 지표 간의 다이버전스를 감지하고, **향후 가격이 어느 방향으로 움직일지를 알려주는
RelicusRoad Pro MT5
Relicus LLC
4.78 (18)
이제 $ 147 (몇 가지 업데이트 후 $ 499 증가) - 무제한 계정 (PCS 또는 MACS) RelicusRoad 사용 설명서 + 교육 비디오 + 비공개 Discord 그룹 액세스 + VIP 상태 시장을 보는 새로운 방법 RelicusRoad는 외환, 선물, 암호화폐, 주식 및 지수에 대한 세계에서 가장 강력한 거래 지표로서 거래자에게 수익성을 유지하는 데 필요한 모든 정보와 도구를 제공합니다. 우리는 초보자부터 고급까지 모든 거래자가 성공할 수 있도록 기술적 분석 및 거래 계획을 제공합니다. 미래 시장을 예측할 수 있는 충분한 정보를 제공하는 핵심 거래 지표입니다. 우리는 차트에서 말이 안 되는 여러 지표 대신 완전한 솔루션을 믿습니다. 타의 추종을 불허하는 매우 정확한 신호, 화살표 + 가격 조치 정보를 표시하는 올인원 표시기입니다. 강력한 AI를 기반으로 하는 RelicusRoad는 누락된 정보와 도구를 제공하여 교육하고 성공적인 트레이더인 트레이딩 전문가가 되도
Trend Hunter MT5
Andrey Tatarinov
5 (2)
Trend Hunter 는 Forex, 암호화폐 및 CFD 시장에서 작업하기 위한 추세 지표입니다. 이 지표의 특별한 특징은 가격이 추세선을 약간 돌파할 때 신호를 변경하지 않고 자신있게 추세를 따른다는 것입니다. 표시기는 다시 그려지지 않으며 막대가 닫힌 후에 시장 진입 신호가 나타납니다. 추세를 따라 이동할 때 표시기는 추세 방향에 대한 추가 진입점을 표시합니다. 이러한 신호를 바탕으로 작은 StopLoss로 거래할 수 있습니다. Trend Hunter 는 정직한 지표입니다. 표시 신호 위로 마우스를 가져가면 신호의 잠재적 이익과 가능한 중지가 표시됩니다. 새로운 신호가 나타나면 다음 알림을 받을 수 있습니다. 알리다 푸시 알림 이메일로 알림 텔레그램 알림 차트 스크린샷도 텔레그램으로 전송되므로 거래 결정을 내리기 위해 단말기를 열 필요가 없습니다. 표시 신호는 텔레그램 채널 https://www.mql5.com/ko/market/product/11085#!tab=com
설명 ICSM(Impulse-Correction SCOB Mapper)은 가격 움직임을 분석하고 유효한 충격, 수정 및 SCOB(Single Candle Order Block)을 식별하는 지표입니다. 유연하고 정보가 풍부하며 사용하기 쉽고 가장 유동성이 높은 관심 영역에 대한 트레이더의 인식을 크게 향상시키기 때문에 모든 유형의 기술적 분석과 함께 사용할 수 있는 강력한 도구입니다. 설정 일반 | 시각 색상 테마 - ICSM의 색상 테마를 정의합니다. SCOB | 시각 SCOB 표시 - SCOB를 활성화/비활성화합니다; SCOB 표시 방법 - SCOB 표현을 위한 스타일 옵션 목록을 나타냅니다; SCOB 색상 - SCOB의 색상을 정의합니다; ICM | 시각 ICM 라인 표시 - ICM(Impulse-Correction Mapper) 라인을 활성화/비활성화합니다; IC 트렌드 표시 - 차트 하단의 색상 구분선을 통해 충격-수정 트렌드 시각화를 활성화/비활성화합니다;
Easy Breakout MT5
Mohamed Hassan
4.6 (5)
After your purchase, feel free to contact me for more details on how to receive a bonus indicator called VFI, which pairs perfectly with Easy Breakout for enhanced confluence!     Easy Breakout MT5   is a powerful price action trading system built on one of the most popular and widely trusted strategies among traders: the   Breakout strategy ! This indicator delivers crystal-clear Buy and Sell signals based on breakouts from key support and resistance zones. Unlike typical breakout indicators
Blahtech Supply Demand MT5
Blahtech Limited
4.54 (13)
Was: $299  Now: $149  Supply Demand uses previous price action to identify potential imbalances between buyers and sellers. The key is to identify the better odds zones, not just the untouched ones. Blahtech Supply Demand indicator delivers functionality previously unavailable on any trading platform. This 4-in-1 indicator not only highlights the higher probability zones using a multi-criteria strength engine, but also combines it with multi-timeframe trend analysis, previously confirmed swings
[ MT4 Version ]  [ Order Blocks ]  [ Kill Zones ]  [ SMT Divergences ] How to trade using Order Blocks :  Click here User Interface Performance:  During testing in the strategy tester, the UI may experience lag. Rest assured, this issue is specific to the testing environment and does not affect the indicator's performance in live trading. Elevate your trading strategy with the  Order Blocks ICT Multi TF  indicator, a cutting-edge tool designed to enhance your trading decisions through advanced o
Basic Harmonic Patterns Dashboard MT5
Mehran Sepah Mansoor
4.13 (8)
이 대시보드는 선택한 심볼에 대해 사용 가능한 최신 고조파 패턴을 표시하므로 시간을 절약하고 더 효율적으로 사용할 수 있습니다 /   MT4 버전 . 무료 인디케이터:   Basic Harmonic Pattern 인디케이터 열 Symbol :   선택한 심볼이 나타납니다 Trend :   강세 또는 약세 Pattern :   패턴 유형(가틀리, 나비, 박쥐, 게, 상어, 사이퍼 또는 ABCD) Entry :   진입 가격 SL:   스톱로스 가격 TP1:   1차 테이크프로핏 가격 TP2:   2차 테이크프로핏 가격 TP3:   3차 테이크프로핏 가격 Current price:   현재 가격 Age (in bars):   마지막으로 그려진 패턴의 나이 주요 입력 Symbols :   "28개 주요 통화쌍" 또는 "선택한 심볼" 중에서 선택합니다. Selected Symbols :   쉼표로 구분하여 모니터링하려는 원하는 심볼("EURUSD,GBPUSD,XAUUSD")을 선택
Precision trading: leverage wolfe waves for accurate signals Wolfe Waves are naturally occurring trading patterns present in all financial markets and represent a fight towards an equilibrium price. These patterns can develop over short and long-term time frames and are one of the most reliable predictive reversal patterns in existence, normally preceding strong and long price movements. [ Installation Guide | Update Guide | Troubleshooting | FAQ | All Products ] Clear trading signals Amazingly
IQ Gold Gann Levels a non-repainting, precision tool designed exclusively for XAUUSD/Gold intraday trading. It uses W.D. Gann’s square root method to plot real-time support and resistance levels, helping traders spot high-probability entries with confidence and clarity. William Delbert Gann (W.D. Gann) was an exceptional market analyst, whose trading technique was based on a complex blend of mathematics, geometry, astrology, and ancient mathematics which proved to be extremely accurate. Download
Basic Supply Demand Dashboard MT5
Mehran Sepah Mansoor
5 (1)
이 대시보드는 선택한 기호에 대한 거래 전략에 따라 스캘핑 모드와 장기 모드 모두에서 차트의 공급 및 수요 영역을 검색하고 표시합니다. 또한 대시보드의 스캐너 모드를 통해 원하는 모든 기호를 한눈에 확인하고 적합한 위치를 놓치지 않도록 도와줍니다 / MT4 버전 . 무료 보조지표:   Basic Supply Demand 특징 여러 통화쌍에 대한 거래 기회를 볼 수 있으며, 공급 및 수요 영역에 대한 근접성에 따라 순위가 매겨진 모든 쌍을 명확하고 간결하게 볼 수 있습니다. 색상부터 감지 매개변수까지 특정 요구에 맞게 사용자 지정 설정 가능 주요 입력 Indicator mode :   표시기 모드 또는 새로운 기능이 포함된 패널 모드 중에서 선택 가능 Symbols :   "28개 주요 통화쌍" 또는 "선택한 심볼" 중에서 선택 Selected Symbols :   쉼표로 구분하여 모니터링하려는 원하는 심볼("EURUSD, GBPUSD, XAUUSD")을 선택합니다. 브로
Blahtech Market Profile MT5
Blahtech Limited
5 (10)
Was: $249  Now: $149   Market Profile defines a number of day types that can help the trader to determine market behaviour. A key feature is the Value Area, representing the range of price action where 70% of trading took place. Understanding the Value Area can give traders valuable insight into market direction and establish the higher odds trade. It is an excellent addition to any system you may be using. Inspired by Jim Dalton’s book “Mind Over Markets”, this indicator is designed to suit the
Bill Williams Advanced
Siarhei Vashchylka
5 (9)
Bill Williams Advanced is designed for automatic chart analysis using Bill Williams' "Profitunity" system. The indicator analyzes four timeframes at once. Manual (Be sure to read before purchasing) Advantages 1. Automatically analyzes the chart using the "Profitunity" system of Bill Williams. The found signals are placed in a table in the corner of the screen. 2. Equipped with a trend filter based on the Alligator indicator. Most of the system signals are recommended to be used only according t
Royal Scalping Indicator M5
Vahidreza Heidar Gholami
5 (6)
Royal Scalping Indicator is an advanced price adaptive indicator designed to generate high-quality trading signals. Built-in multi-timeframe and multi-currency capabilities make it even more powerful to have configurations based on different symbols and timeframes. This indicator is perfect for scalp trades as well as swing trades. Royal Scalping is not just an indicator, but a trading strategy itself. Features Price Adaptive Trend Detector Algorithm Multi-Timeframe and Multi-Currency Trend Low
제작자의 제품 더 보기
Trend Screener Pro MT5
STE S.S.COMPANY
4.85 (80)
트렌드 표시기, 트렌드 트레이딩 및 필터링을 위한 획기적인 고유 솔루션, 하나의 도구 안에 내장된 모든 중요한 트렌드 기능! Forex, 상품, 암호 화폐, 지수 및 주식과 같은 모든 기호/도구에 사용할 수 있는 100% 다시 칠하지 않는 다중 시간 프레임 및 다중 통화 표시기입니다. Trend Screener는 차트에 점이 있는 화살표 추세 신호를 제공하는 효율적인 지표 추세 추종 지표입니다. 추세 분석기 표시기에서 사용할 수 있는 기능: 1. 트렌드 스캐너. 2. 최대 이익 분석이 있는 추세선. 3. 추세 통화 강도 측정기. 4. 경고가 있는 추세 반전 점. 5. 경고가 있는 강력한 추세 점. 6. 추세 화살표 Trend Screener Indicator가 있는 일일 분석 예, 일일 신호 성능...등은 여기에서 찾을 수 있습니다. 여기를 클릭하십시오. LIMITED TIME OFFER : Trend Screener Indicator는 50$ 및 평생 동안만 사용할 수 있습니다.
Trend Screener
STE S.S.COMPANY
4.78 (93)
트렌드 표시기, 트렌드 트레이딩 및 필터링을 위한 획기적인 고유 솔루션, 하나의 도구 안에 내장된 모든 중요한 트렌드 기능! Forex, 상품, 암호 화폐, 지수 및 주식과 같은 모든 기호/도구에 사용할 수 있는 100% 다시 칠하지 않는 다중 시간 프레임 및 다중 통화 표시기입니다. 기간 한정 특가: 지원 및 저항 스크리너 지표는 단 100달러에 평생 제공됩니다. (원래 가격 50 달러) (제안 연장) Trend Screener는 차트에 점이 있는 화살표 추세 신호를 제공하는 효율적인 지표 추세 추종 지표입니다. 추세 분석기 표시기에서 사용할 수 있는 기능: 1. 트렌드 스캐너. 2. 최대 이익 분석이 있는 추세선. 3. 추세 통화 강도 측정기. 4. 경고가 있는 추세 반전 점. 5. 경고가 있는 강력한 추세 점. 6. 추세 화살표 Trend Screener Indicator가 있는 일일 분석 예, 일일 신호 성능...등은 여기에서 찾을 수 있습니다.   여기를 클릭하십시오. L
Trend Line Map Pro MT5
STE S.S.COMPANY
4.09 (11)
트렌드 라인 맵 표시기는 트렌드 스크리너 표시기의 애드온입니다. Trend screener(Trend Line Signals)에 의해 생성된 모든 신호에 대한 스캐너로 작동합니다. Trend Screener Indicator 기반의 Trend Line Scanner입니다. Trend Screener Pro 표시기가 없으면 Trend Line Map Pro가 작동하지 않습니다. It's a Trend Line Scanner based on Trend Screener Indicator. If you don't have Trend Screener Pro Indicator,     the Trend Line Map Pro will not work . MQL5 블로그에 액세스하여 추세선 지도 표시기의 무료 버전을 다운로드할 수 있습니다. Metatrader Tester 제한 없이 구매하기 전에 사용해 보십시오. : 여기를 클릭하세요 1. 쉽게 얻을 수 있는 이점 통화 및 시간 프레
Support Resistance screnner
STE S.S.COMPANY
4.94 (36)
Support And Resistance Screener는 하나의 지표 안에 여러 도구를 제공하는 MetaTrader에 대한 하나의 레벨 지표입니다. 사용 가능한 도구는 다음과 같습니다. 1. 시장 구조 스크리너. 2. 완고한 후퇴 영역. 3. 약세 후퇴 영역. 4. 일일 피벗 포인트 5. 주간 피벗 포인트 6. 월간 피벗 포인트 7. 고조파 패턴과 볼륨에 기반한 강력한 지지와 저항. 8. 은행 수준 구역. LIMITED TIME OFFER : HV 지원 및 저항 표시기는 50 $ 및 평생 동안만 사용할 수 있습니다. ( 원래 가격 125$ ) 메타트레이더 백테스터 제한 없이 인디케이터를 사용하시겠습니까? 데모 버전을 다운로드하려면 여기를 클릭하십시오. 주요 특징들 고조파 및 볼륨 알고리즘을 기반으로 하는 강력한 지원 및 저항 영역. Harmonic 및 Volume 알고리즘을 기반으로 한 강세 및 약세 풀백 영역. 시장 구조 스크리너 일간, 주간 및 월간 피벗 포인트. 문서 모
우리의 지지 또는 저항 수준은 시장의 가격 움직임이 반전되고 방향이 바뀌면서 시장에 고점 또는 저점(스윙 포인트)을 남길 때 형성됩니다. 지원 및 저항 수준은 거래 범위를 개척할 수 있습니다. 지표는 지표 세트에 정의된 X개의 막대( 기간 )를 기반으로 스윙 하이 및 스윙 로우를 식별합니다. 참고: 가격 조치 표시기가 마음에 들면 하나의 추세 표시기(추세 스크리너, 추세선, 강한 추세 및 추세 반전 신호 등)를 모두 사용해 보십시오. 그것을 얻으려면 , 여기를 클릭하십시오 주요 특징들 기술적 분석의 핵심 개념은 저항이나 지지 수준이 무너지면 그 역할이 역전된다는 것입니다. 가격이 지원 수준 아래로 떨어지면 그 수준은 저항이 될 것입니다. 가격이 저항선 위로 올라가면 종종 지지선이 됩니다. 수평 지원 및 저항 수준은 이러한 수준의 가장 기본적인 유형입니다. 그들은 단순히 수평선으로 식별됩니다. 차트의 녹색 레벨은 저항 레벨입니다. 차트의 빨간색 레벨은 지원 레벨입니다. 우리의
FREE
Trend Line Map Pro
STE S.S.COMPANY
4.47 (15)
트렌드 라인 맵 표시기는 트렌드 스크리너 표시기의 애드온입니다. Trend screener (Trend Line Signals)에 의해 생성된 모든 신호에 대한 스캐너로 작동합니다. Trend Screener Indicator 기반의 Trend Line Scanner입니다. Trend Screener Pro 표시기가 없으면 Trend Line Map Pro가 작동하지 않습니다. MQL5 블로그에 액세스하여 추세선 지도 표시기의 무료 버전을 다운로드할 수 있습니다. Metatrader Tester 제한 없이 구매하기 전에 사용해 보십시오. :   여기를 클릭하세요 1. 쉽게 얻을 수 있는 이점 통화 및 시간 프레임을 기반으로 매수 및 매도 신호를 표시합니다. 차트에 화살표가 나타난 이후 가격이 몇 핍 증가 또는 감소했는지 평가하십시오. ( 트렌드 스크리너 표시기 화살표 ) 신호의 타이밍을 표시합니다. 구매 및 판매 알림에 대한 다중 기간 및 다중 통화 알림 받기. 2. 추세
통화 강도 측정기는 현재 어떤 통화가 강하고 어떤 통화가 약한지에 대한 빠른 시각적 가이드를 제공합니다. 미터는 모든 외환 교차 쌍의 강도를 측정하고 계산을 적용하여 각 개별 통화의 전체 강도를 결정합니다. 우리는 28 쌍의 추세를 기반으로 통화의 강도를 기반으로 계산합니다. MQL5 블로그에 액세스하여 표시기의 무료 버전을 다운로드할 수 있습니다. Metatrader 테스터 제한 없이 구매하기 전에 시도하십시오.   여기를 클릭하십시오. 1. 문서 모든 추세 통화 강도 문서( 지침 ) 및 전략 세부 정보는 MQL5 블로그의 이 게시물에서 볼 수 있습니다.   여기를 클릭하십시오. 2. 연락처 질문이 있거나 도움이 필요하면 비공개 메시지를 통해 저에게 연락하십시오. 3. 저자 SAYADI ACHREF, 핀테크 소프트웨어 엔지니어이자 Finansya 설립자.
Trend Currency Strength
STE S.S.COMPANY
5 (2)
통화 강도 측정기는 현재 어떤 통화가 강하고 어떤 통화가 약한지에 대한 빠른 시각적 가이드를 제공합니다. 미터는 모든 외환 교차 쌍의 강도를 측정하고 계산을 적용하여 각 개별 통화의 전체 강도를 결정합니다. 우리는 28 쌍의 추세를 기반으로 통화의 강도를 기반으로 계산합니다. MQL5 블로그에 액세스하여 표시기의 무료 버전을 다운로드할 수 있습니다. Metatrader 테스터 제한 없이 구매하기 전에 시도하십시오.   여기를 클릭하십시오. 1. 문서 모든 추세 통화 강도 문서( 지침 ) 및 전략 세부 정보는 MQL5 블로그의 이 게시물에서 볼 수 있습니다.   여기를 클릭하십시오. 2. 연락처 질문이 있거나 도움이 필요하면 비공개 메시지를 통해 저에게 연락하십시오. 3. 저자 SAYADI ACHREF, 핀테크 소프트웨어 엔지니어이자 Finansya 설립자.
모든 거래자는 거래당 5%(또는 7%) 이상의 위험을 감수해서는 안 된다는 것을 알고 있습니다. 이것은 자금 관리법이며 상인은 다른 거래 수준에 대해 다른 StopLoss 값을 사용해야 하기 때문에 사용 가능한 LotSize를 매번 계산해야 합니다. 이 표시기는 차트에 배치하고 "손절매선"을 임의의 방향으로 끌 때마다 적절한 LotSize를 계산합니다. 기간 한정 제공: 당사의 모든 프리미엄 지표는 단 50$에 제공됩니다. MQL5 블로그에 액세스하면 프리미엄 지표에 대한 모든 세부 정보를 찾을 수 있습니다. 여기를 클릭하십시오. 입력 MAX_RISK_PER_TRADE- 거래자가 거래당 몇 퍼센트의 위험을 감수할지. CUSTOM_BALANCE- 위험을 계산하는 데 사용할 금액을 정의합니다. 0 => 계산기는 계정 잔액을 사용합니다. ENTRY_PRICE_LINE_COLOR - TP(이익 실현) 라인의 색상 STOP_PRICE_LINE_COLOR- SL(손절매) 라인의 색상 SP
붐 및 충돌 스파이크 감지기 표시기는 주로 가격에서 붐 및 충돌을 감지하기 위한 고급 전략을 기반으로 코딩됩니다. 가격에서 높은 확률의 붐 및 충돌을 감지하기 위해 복잡한 알고리즘이 이식되었습니다. 잠재적인 붐 또는 충돌 단계에 대해 경고합니다. 붐 단계: 가격이 너무 빠르게 상승할 때. 충돌 단계: 가격이 너무 빠르게 하락하는 경우. 기간 한정 제공: 표시기는 30$ 및 평생 동안만 사용할 수 있습니다.  주요 특징들 푸시 알림을 휴대폰으로 보냅니다. 컴퓨터 또는 노트북에서 팝업 및 소리 경고 다시 칠하지 않는 화살표를 표시합니다(잠재 붐의 경우 위쪽 화살표, 잠재적 충돌의 경우 아래쪽 화살표). 모든 쌍으로 작업합니다. 추천 기간: H1 및 H4 추천 쌍 : 추세 단계의 쌍. 연락하다 질문이 있거나 도움이 필요하면 비공개 메시지를 통해 저에게 연락하십시오. 작가 SAYADI ACHREF, 핀테크 소프트웨어 엔지니어이자 Finansya의 설립자.
변동성 분석기는 타이트한 거래 범위에서 통합된 후 가격이 강하게 이탈하는 경향을 이용하는 모멘텀 지표입니다. 지표는 또한 스퀴즈가 발생할 때 예상되는 움직임 방향을 보여주기 위해 모멘텀 오실레이터를 사용합니다. 이 히스토그램은 0선을 중심으로 진동하며 0선 위로 모멘텀이 증가하면 매수 기회를 나타내고 모멘텀이 0선 아래로 떨어지면 매도 기회를 나타낼 수 있습니다. LIMITED TIME OFFER : 표시기는 50 $ 및 평생 동안만 사용할 수 있습니다. (정가 125$ ) 주요 특징들 옆으로 추세 감지기. 낮은 변동성 감지기. 강세 고 및 약세 고 변동성 감지기. 모든 시간대와 모든 쌍으로 작업합니다. 팝업 알림 및 푸시 알림 알림을 제공합니다. 연락하다 질문이 있거나 도움이 필요하면 비공개 메시지를 통해 저에게 연락하십시오. 경고 모든 지표와 도구는 공식 Metatrader Store( MQL5 Market )를 통해서만 사용할 수 있습니다. 프리미엄 지표 MQL5
평균 일일 범위는 특정 기간 동안 측정된 Forex 쌍의 평균 핍 범위를 보여줍니다. 거래자는 ADR을 사용하여 평균 일일 이동을 벗어난 잠재적인 가격 조치를 시각화할 수 있습니다. ADR이 평균보다 높으면 일일 변동성이 평소보다 높다는 것을 의미하며, 이는 통화 쌍이 정상 이상으로 확장될 수 있음을 의미합니다. ADR Analyzer는 5가지 주요 기능으로 구성됩니다. 범위(ADR) 스크리너: 다중 통화 ADR 분석. ADR 구역: ADR 구역 외의 가격 붐이 일 동안 예상되는 시장 범위를 보여줍니다. X막대 Zone : 사용자가 지정한 X막대, X막대의 틈을 보여줍니다. 일간 고저존 : 전일 고점 또는 저점의 구간을 식별합니다. Weekly High and Low Zone : 주간 High 레벨 또는 Low 레벨을 식별합니다. 기간 한정 제공: 범위 분석기 표시기는 50$ 및 평생 동안만 사용할 수 있습니다. ( 원래 가격 125$ ) 주요 특징들 다중 통화 스크리너. AD
변동성 분석기는 타이트한 거래 범위에서 통합된 후 가격이 강하게 이탈하는 경향을 이용하는 모멘텀 지표입니다. 지표는 또한 스퀴즈가 발생할 때 예상되는 움직임 방향을 보여주기 위해 모멘텀 오실레이터를 사용합니다. 이 히스토그램은 0선을 중심으로 진동하며 0선 위로 모멘텀이 증가하면 매수 기회를 나타내고 모멘텀이 0선 아래로 떨어지면 매도 기회를 나타낼 수 있습니다. LIMITED TIME OFFER : 표시기는 50 $ 및 평생 동안만 사용할 수 있습니다. (정가 125$ ) 주요 특징들 옆으로 추세 감지기. 낮은 변동성 감지기. 강세 고 및 약세 고 변동성 감지기. 모든 시간대와 모든 쌍으로 작업합니다. 팝업 알림 및 푸시 알림 알림을 제공합니다. 연락하다 질문이 있거나 도움이 필요하면 비공개 메시지를 통해 저에게 연락하십시오. 경고 모든 지표와 도구는 공식 Metatrader Store( MQL5 Market )를 통해서만 사용할 수 있습니다. 프리미엄 지표 MQL5
모든 거래자는 거래당 5%(또는 7%) 이상의 위험을 감수해서는 안 된다는 것을 알고 있습니다. 이것은 자금 관리법이며 상인은 다른 거래 수준에 대해 다른 StopLoss 값을 사용해야 하기 때문에 사용 가능한 LotSize를 매번 계산해야 합니다. 이 표시기는 차트에 배치하고 "손절매선"을 임의의 방향으로 끌 때마다 적절한 LotSize를 계산합니다. 기간 한정 제공: 당사의 모든 프리미엄 지표는 단 50$에 제공됩니다. MQL5 블로그에 액세스하면 프리미엄 지표에 대한 모든 세부 정보를 찾을 수 있습니다. 여기를 클릭하십시오. 입력 MAX_RISK_PER_TRADE- 거래자가 거래당 몇 퍼센트의 위험을 감수할지. CUSTOM_BALANCE- 위험을 계산하는 데 사용할 금액을 정의합니다. 0 => 계산기는 계정 잔액을 사용합니다. ENTRY_PRICE_LINE_COLOR - TP(이익 실현) 라인의 색상 STOP_PRICE_LINE_COLOR- SL(손절매) 라인의 색상 SP
붐 및 충돌 스파이크 감지기 표시기는 주로 가격에서 붐 및 충돌을 감지하기 위한 고급 전략을 기반으로 코딩됩니다. 가격에서 높은 확률의 붐 및 충돌을 감지하기 위해 복잡한 알고리즘이 이식되었습니다. 잠재적인 붐 또는 충돌 단계에 대해 경고합니다. 붐 단계: 가격이 너무 빠르게 상승할 때. 충돌 단계: 가격이 너무 빠르게 하락하는 경우. 기간 한정 제공: 표시기는 30$ 및 평생 동안만 사용할 수 있습니다.  주요 특징들 푸시 알림을 휴대폰으로 보냅니다. 컴퓨터 또는 노트북에서 팝업 및 소리 경고 다시 칠하지 않는 화살표를 표시합니다(잠재 붐의 경우 위쪽 화살표, 잠재적 충돌의 경우 아래쪽 화살표). 모든 쌍으로 작업합니다. 추천 기간: H1 및 H4 추천 쌍 : 추세 단계의 쌍. 연락하다 질문이 있거나 도움이 필요하면 비공개 메시지를 통해 저에게 연락하십시오. 작가 SAYADI ACHREF, 핀테크 소프트웨어 엔지니어이자 Finansya의 설립자.
평균 일일 범위는 특정 기간 동안 측정된 Forex 쌍의 평균 핍 범위를 보여줍니다. 거래자는 ADR을 사용하여 평균 일일 이동을 벗어난 잠재적인 가격 조치를 시각화할 수 있습니다. ADR이 평균보다 높으면 일일 변동성이 평소보다 높다는 것을 의미하며, 이는 통화 쌍이 정상 이상으로 확장될 수 있음을 의미합니다. ADR Analyzer는 5가지 주요 기능으로 구성됩니다. 범위(ADR) 스크리너: 다중 통화 ADR 분석. ADR 구역: ADR 구역 외의 가격 붐이 일 동안 예상되는 시장 범위를 보여줍니다. X막대 Zone : 사용자가 지정한 X막대, X막대의 틈을 보여줍니다. 일간 고저존 : 전일 고점 또는 저점의 구간을 식별합니다. Weekly High and Low Zone : 주간 High 레벨 또는 Low 레벨을 식별합니다. 기간 한정 제공: 범위 분석기 표시기는 50$ 및 평생 동안만 사용할 수 있습니다. ( 원래 가격 125$ ) 주요 특징들 다중 통화 스크리너. AD
필터:
Medaka
166
Medaka 2025.03.14 00:46 
 

This is the best tool. In addition to my default pairs, I monitor the same pairs as the Trend Screener Pro. It allows me to see trend situations at a glance from M1 to MN multi-timeframes. This indicator's unique bank level accurately shows support and resistance. By combining it with the trend screener, it captures the early stages of trends and enables low-risk trading. Sayadi is friendly to users, gives accurate advice, and responds quickly to questions. Thank you so much!

R Bencheikh
57
R Bencheikh 2025.03.07 22:05 
 

The Support and Resistance Screener Pro for MT5 is a good tool for users seeking to enhance their market analysis. Its ability to accurately identify key support and resistance levels across multiple timeframes is impressive, providing a clear and actionable view of potential trading opportunities. The user-friendly interface and customizable alerts make it easy to stay on top of market movements without being overwhelmed. I appreciate the detailed insights and the efficiency it brings to the trading strategy. Thanks My Achraf.

STE S.S.COMPANY
296078
개발자의 답변 Sayadi Achraf 2025.03.08 00:24
Thank you for your thoughtful review! We're thrilled to hear that the Support and Resistance Screener Pro for MT5 has been a valuable tool in enhancing your market analysis. Accuracy and efficiency are at the core of our design, and it's great to know that the customizable alerts and user-friendly interface are helping you stay on top of market movements with ease. Your feedback is truly appreciated, and we’re grateful for your support. Wishing you continued success in your trading journey!
USD Down
59
USD Down 2024.12.04 13:19 
 

this tool is very important to calculate the risk and using the lot calculator, you can get a good combination of support and resistance level in addition to calculating the risk, the cost is nothing compared to the advantage of having such as a tool in hands, the costumer service is very comprehensive and answerring the questions in clear and precise manner, i recommand this tool for all traders with the lot and size calculator you will never be in hasardous situation due to non calculated open positions .

STE S.S.COMPANY
296078
개발자의 답변 Sayadi Achraf 2025.03.08 00:25
Thank you for your great review! We're delighted to hear that you find the Support and Resistance Screener Pro for MT5 invaluable for risk calculation and trade management. The lot and size calculator is designed to help traders make informed decisions, and it's fantastic to know that it’s helping you avoid hazardous situations with non-calculated positions. We also appreciate your kind words about our customer service—clear and precise support is a priority for us. Thanks for recommending the tool, and we wish you continued success in your trading! 🚀📈
Nice Trader OÜ
2483
Aller Uja 2024.12.01 17:53 
 

a good tool if you learn to use it

168622
64
168622 2024.11.06 13:02 
 

사용자가 평가에 대한 코멘트를 남기지 않았습니다

Clinton Van
118
Clinton Van 2024.09.25 15:43 
 

I love both indicators Trend screener Pro and Support and Resistance Screener Pro but you can't use them blindly. You need to understand market structure. I always try to trade a strong currency versus a weaker one. I then trade with the trend after price makes corrections. The Support and resistance indicator helps see how close price is from support or resistance. On uptrend I buy at support levels and downtrend I buy at resistance levels of price corrections. Together these indicators is all you need to make informed decisions. I do my analysis on the 1H time Frame and then I enter my trades using the 1min or 5min time frames. Thanks for these indicators. They really safe me allot of time.

Dang Minh Tien
592
Dang Minh Tien 2024.02.08 08:01 
 

My indicator doesn't draw the S/R zone; it only shows text. Bank levels work fine. I think it's a minor bug because it looks like the indicator isn't compatible when you change your chart color scheme.

STE S.S.COMPANY
296078
개발자의 답변 Sayadi Achraf 2024.02.09 11:54
Hi sir, Thank you for taking time to write your review. I'm sending you ASAP a private message to check the issue you're facing.
--- best regards.
SAYADI ashref.
dutchguy076
90
dutchguy076 2023.10.23 22:09 
 

사용자가 평가에 대한 코멘트를 남기지 않았습니다

STE S.S.COMPANY
296078
개발자의 답변 Sayadi Achraf 2023.11.17 14:57
Dear sir, Thank you for taking time to write your review. We have just sent you an email to fix the issue that you're facing with u.
--- Please if you have any questions, feel free to contact me. Best regards.
SAYADI ashref.
Jerry Slagger
92
Jerry Slagger 2023.09.15 20:10 
 

This is one of the main indicators I use and I have been using it for 2 months now. The new version 13 is awesome. It allows all the levels to be displayed at the same time. So I can see that price is pushing a major or minor level, etc. These levels, along with the PullBack feature bring it all together so one can easily see the best entry / exit points. The HH LL Scanner is awesome as well. I use it to see if price is too high / low to enter, to make sure I am not entering after the move has already happened. Support is top notch and responsive.

STE S.S.COMPANY
296078
개발자의 답변 Sayadi Achraf 2023.09.20 17:46
Thank you for taking the time to share your review, Mr. Jerry.
Wilfried Pelletier
161
Wilfried Pelletier 2023.08.30 17:37 
 

사용자가 평가에 대한 코멘트를 남기지 않았습니다

STE S.S.COMPANY
296078
개발자의 답변 Sayadi Achraf 2023.08.30 17:39
Thank you for your review, we are happy to know that you liked our indicator. Any questions, please feel free to contact us.
Dunstan Wafula Namusonge
851
Dunstan Wafula Namusonge 2023.06.09 19:26 
 

The reason why I like this forex indicator so much is because it is easy to use. The indicator accurately gives me both price action and technical analysis at the same time. The multi-functional features make this a unique product. Alerts are accurate with precise signals. The author is very responsive and available. I strongly recommend this indicator.Trust me when I say that this will be your go to indicator once you try it.

STE S.S.COMPANY
296078
개발자의 답변 Sayadi Achraf 2023.09.20 17:46
Thank you for taking time to share your review MR. Wafula.
Олег Похилько
160
Олег Похилько 2023.04.06 16:48 
 

Good indicator, but Sayadi just the best!

Andres.Morelo
129
Andres.Morelo 2023.01.26 10:33 
 

excellent indicator, I like me very much. It complements my trading plan very well and customer service is exceptional, too good for price. I recommend 100% I give you five stars

Agbakeleke Idowu
689
Agbakeleke Idowu 2023.01.21 22:37 
 

Very Worst Indicator in mql5 market. You will do yourself a great disadvantage buying it. Don't be deceived by the fake comments you saw here. It is a total waste of money. Wasted my hard earned $50 on this Garbage of a Thing. I once added a review but this Big man Liar has deleted it. The Creator did a very lazy Job on this indicator, and I consider it a big theft taking $50 for this nonesense indicator.

Deleting my Review on this indicator means this is a scam indicator. Nonesense

A BAD SELLER. DON'T EVER BUY FROM HIM. FAKE REVIEWS EVERYWHERE

STE S.S.COMPANY
296078
개발자의 답변 Sayadi Achraf 2023.06.06 00:17
Hello Mr. Idowu, Thank you for taking the time to share your feedback with us. I must say, I was taken aback by your review. As sellers, we do not have the capability to remove customer reviews and we always value constructive criticism as it helps us improve our services. However, it seemed from your review that you may have had a misunderstanding about our indicator/service. We have been selling on the MQL5 market since 2020 and our primary goal has always been to provide the best possible service to our customers. Any suggestions that we have engaged in dishonest activities are deeply unsettling and contrary to our principles. We believe in transparency and honest communication with our customers. Thank you once again for your feedback, and we wish you a safe and prosperous trading journey. Best regards,
SAYADI Ashref
26 Trades, LLC
373
JASON ALAN MYERS 2022.12.03 16:45 
 

Awesome indicator! I use the Pullback Zones on higher timeframes, set and wait for alert, then go to lower timeframe and wait for alert to enter trade. Also, there is no repaint on this indicator. Most indicators have great signals until you realize they have repainted, but not this indicator. Support is always prompt and helpful.

STE S.S.COMPANY
296078
개발자의 답변 Sayadi Achraf 2023.03.23 10:29
Thank you for your review, Mr. Jason.
25170142
144
25170142 2022.10.24 13:55 
 

Very good indicator, I use the pullback function in combination with indices and trade the pullbacks. That works great. Also the support is very good always quick response to questions.

STE S.S.COMPANY
296078
개발자의 답변 Sayadi Achraf 2023.03.23 10:28
Thank you for your review sir.
Long Zhang
62
Long Zhang 2022.08.25 07:56 
 

你好,可能因为防火墙的原因看不到视频,您可以将视频发到我的邮箱吗

STE S.S.COMPANY
296078
개발자의 답변 Sayadi Achraf 2022.08.25 18:05
Dear sir, Thank you for taking time to write your review. I'm sending you now the request video via PM. Best regards.
SAYADI Ashref.
SparksyB
102
SparksyB 2022.08.20 23:11 
 

Amazing indicator with pivot points features !

GoldHulk
955
GoldHulk 2022.03.26 02:49 
 

I got that SR Indicator for MT4+5 and observe it now for quite some time (4 months +)

- I have to say it still impresses me of how good these SR Zones are.

There are many SR/SnD Indicators, some of them are pretty good (I also like Blahtech Supply and Demand very much), but this SR Indicator here just masters an incredible difficult part (especially for coding this)

>> It only gives you the IMPORTANT SR Zones on your screen and doesnt clutter your whole screen til its useless.

Also I like the Settings very much on this indicator, they are smart trimmed down to the necessary but still versatile enough for adjustments (very good in not to overwhelm you with a shitload of settings like many others do)

In short: If you have a good foundation in basic trading skills/knowledge, then this Indicator here is an amazing tool

(for me: it helps me to get more structured in my own trading approach - without this indicator I tend to be all over the charts, have difficulties to prioritize - so its a great help to overcome my weaknesses)

PS: @Sayadi Achraf, not sure if thats possible, but if you can manage to make this working in similar quality on major crypto assests as well, then this would be amazing :)

STE S.S.COMPANY
296078
개발자의 답변 Sayadi Achraf 2022.03.26 14:47
Hi sir, Thank you for your review and I'm to know that you liked our indicator. I sent crypto request to my technical team and we will for this crypto feature in our next upgrade. Best regards.
SAYADI Ashref.
33225272
161
33225272 2022.02.05 18:14 
 

THE BEST TOOL EVER...

12
리뷰 답변
버전 13.20 2023.12.13
1. Fixed email alert issue with the last metatrader version.
버전 13.0 2023.09.15
1. Add options to enable-disable every feature
버전 12.0 2023.06.05
1. Optimize Pullback zones to include markets ( Deriv pairs )
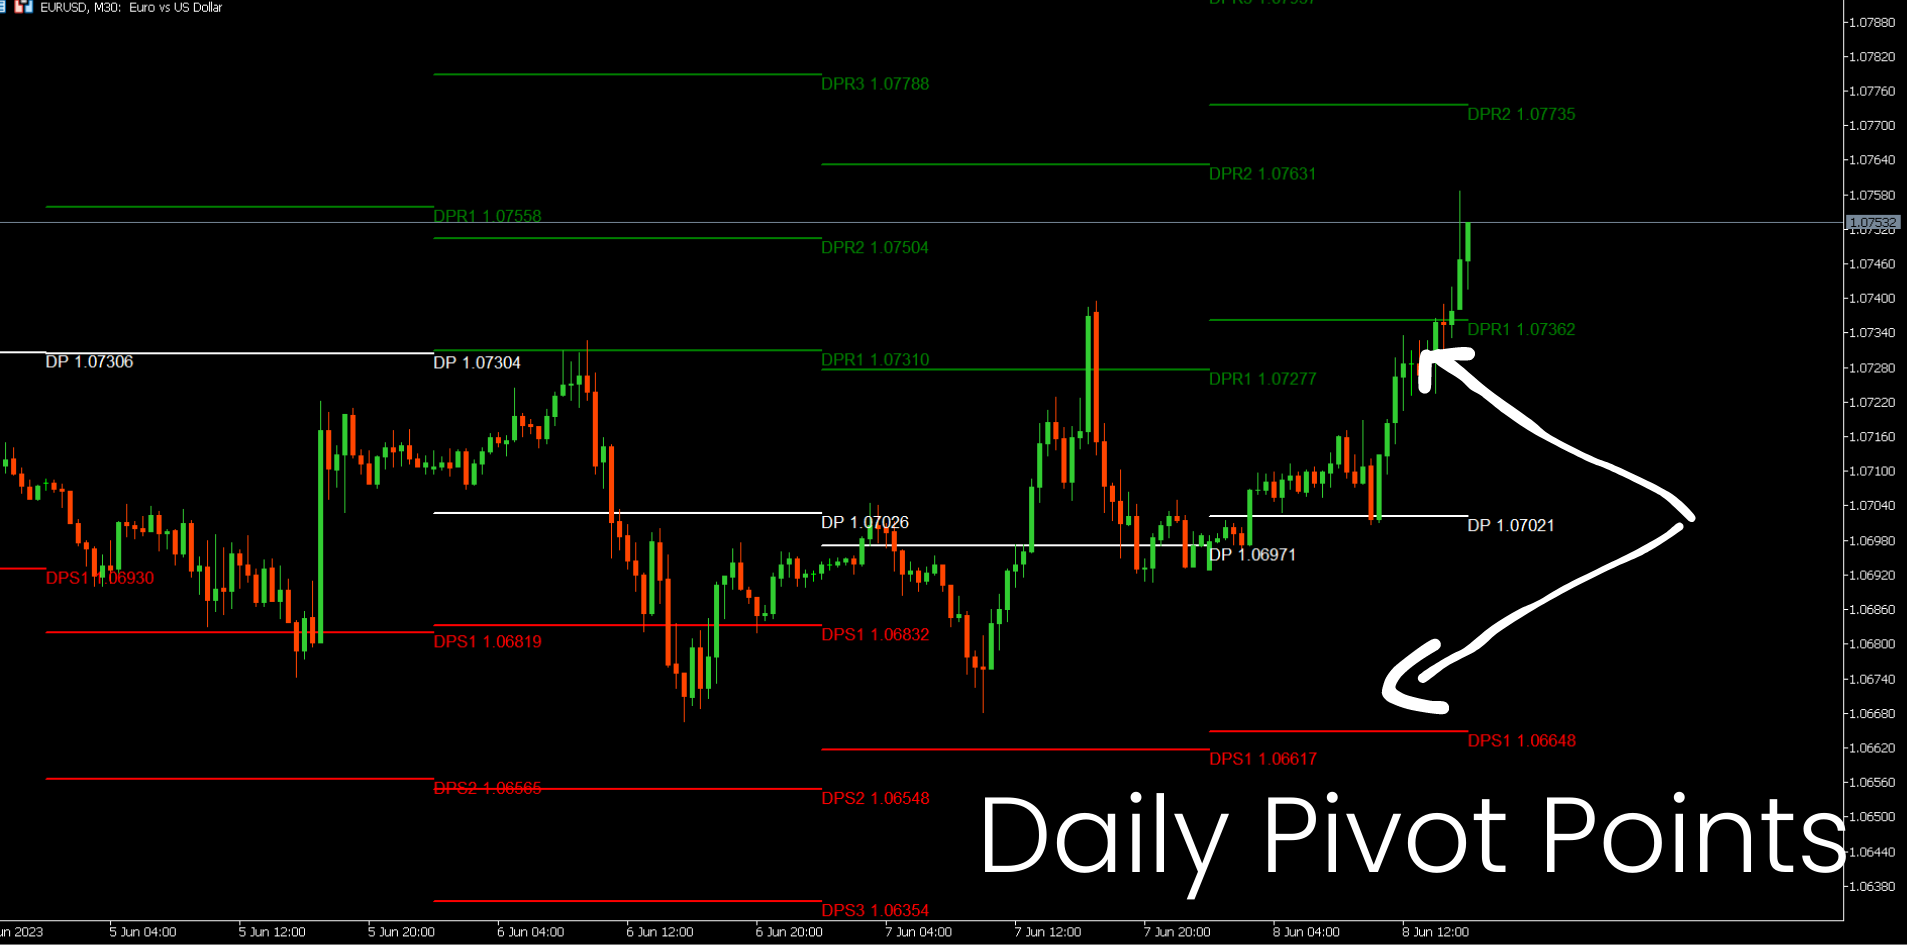
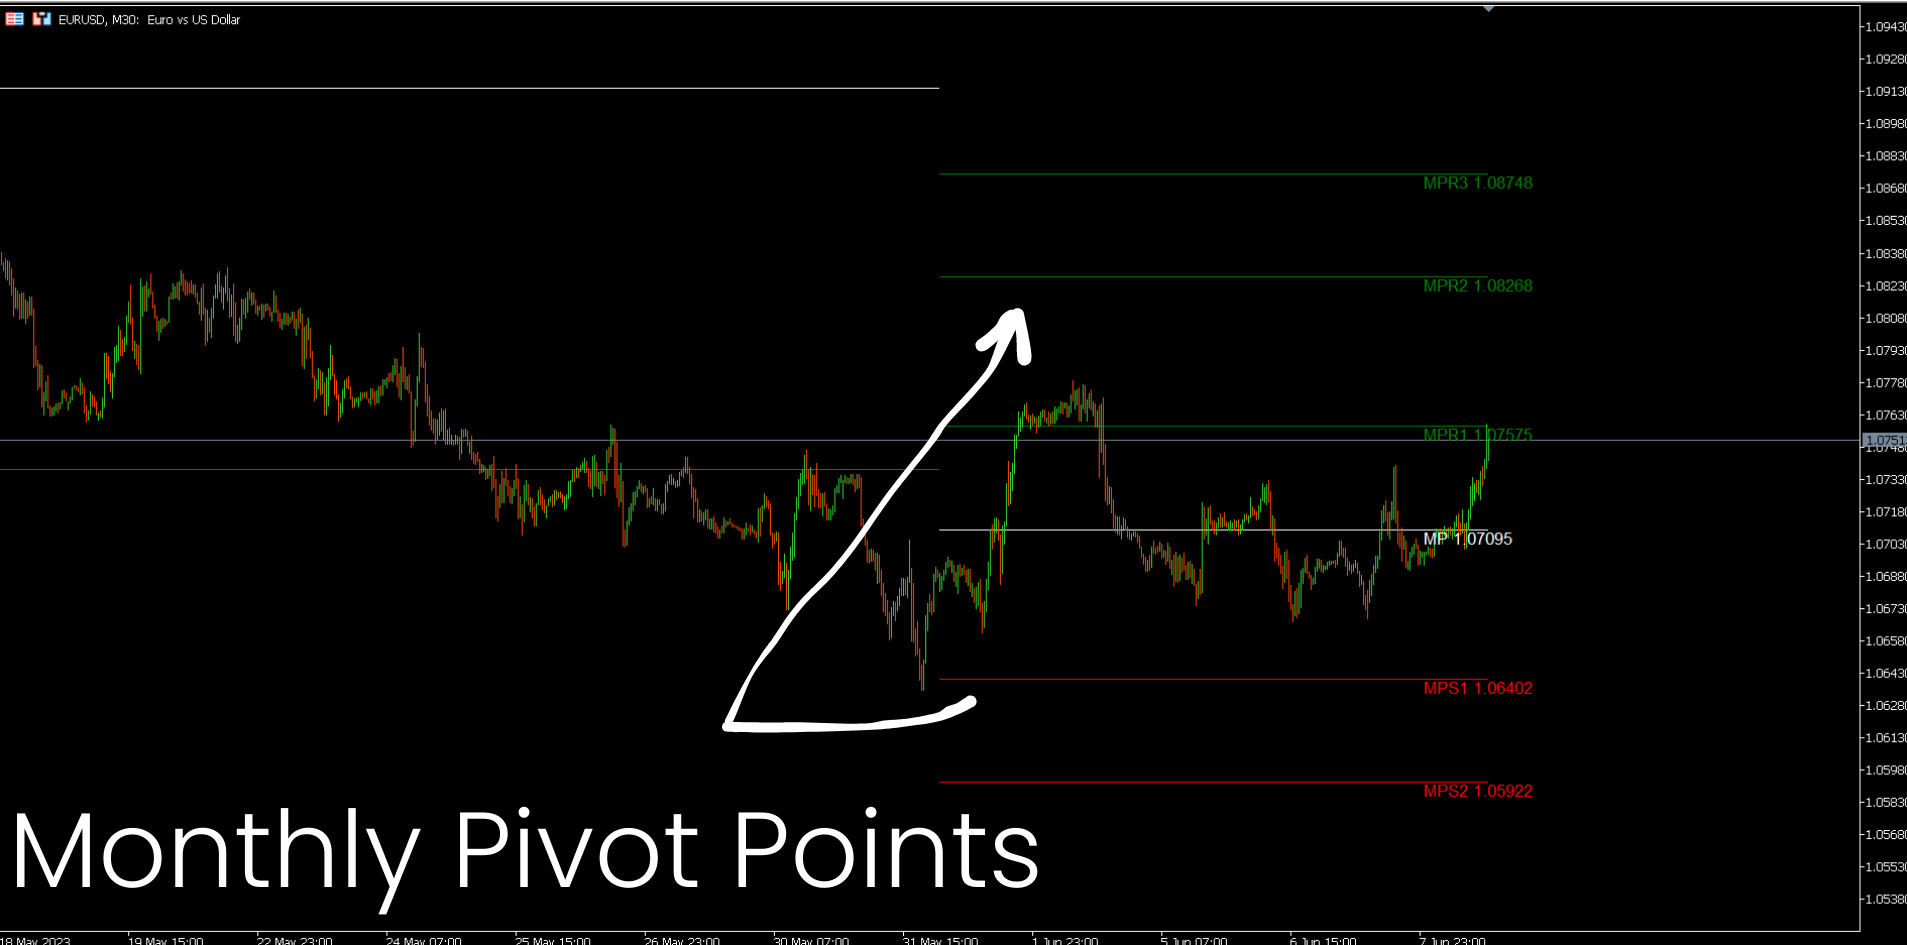
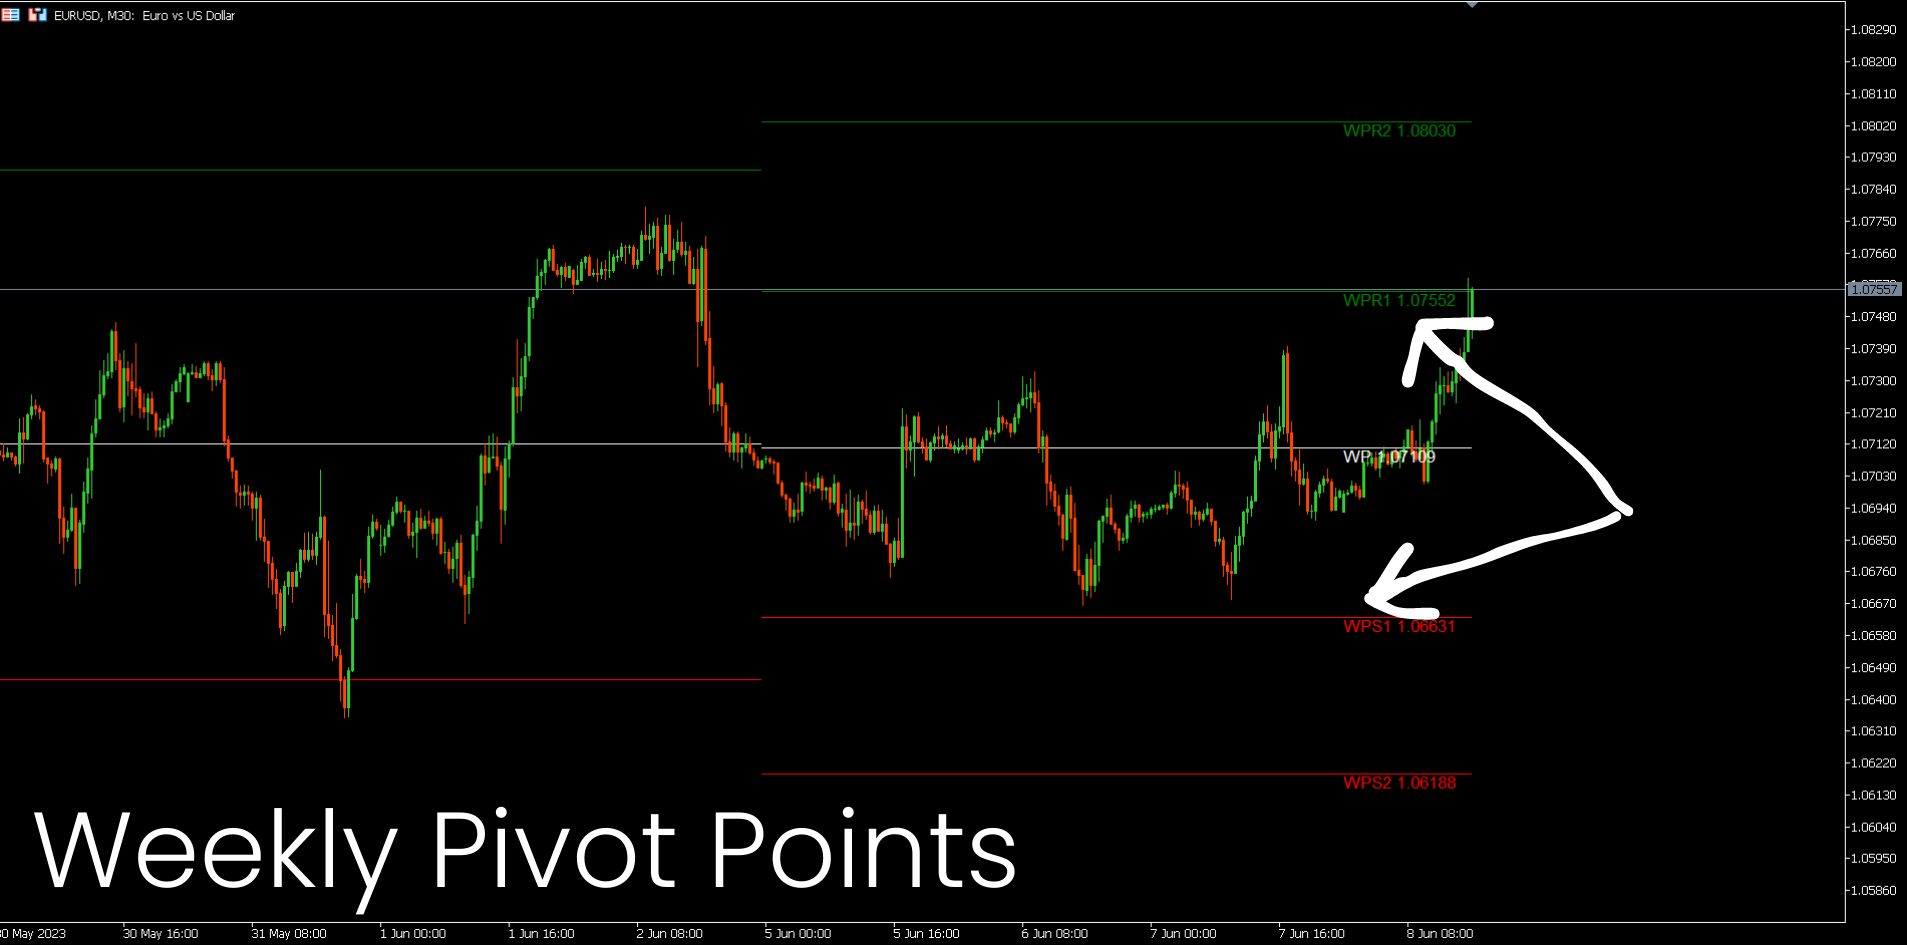
2. Enable 3 types of Pivots points.
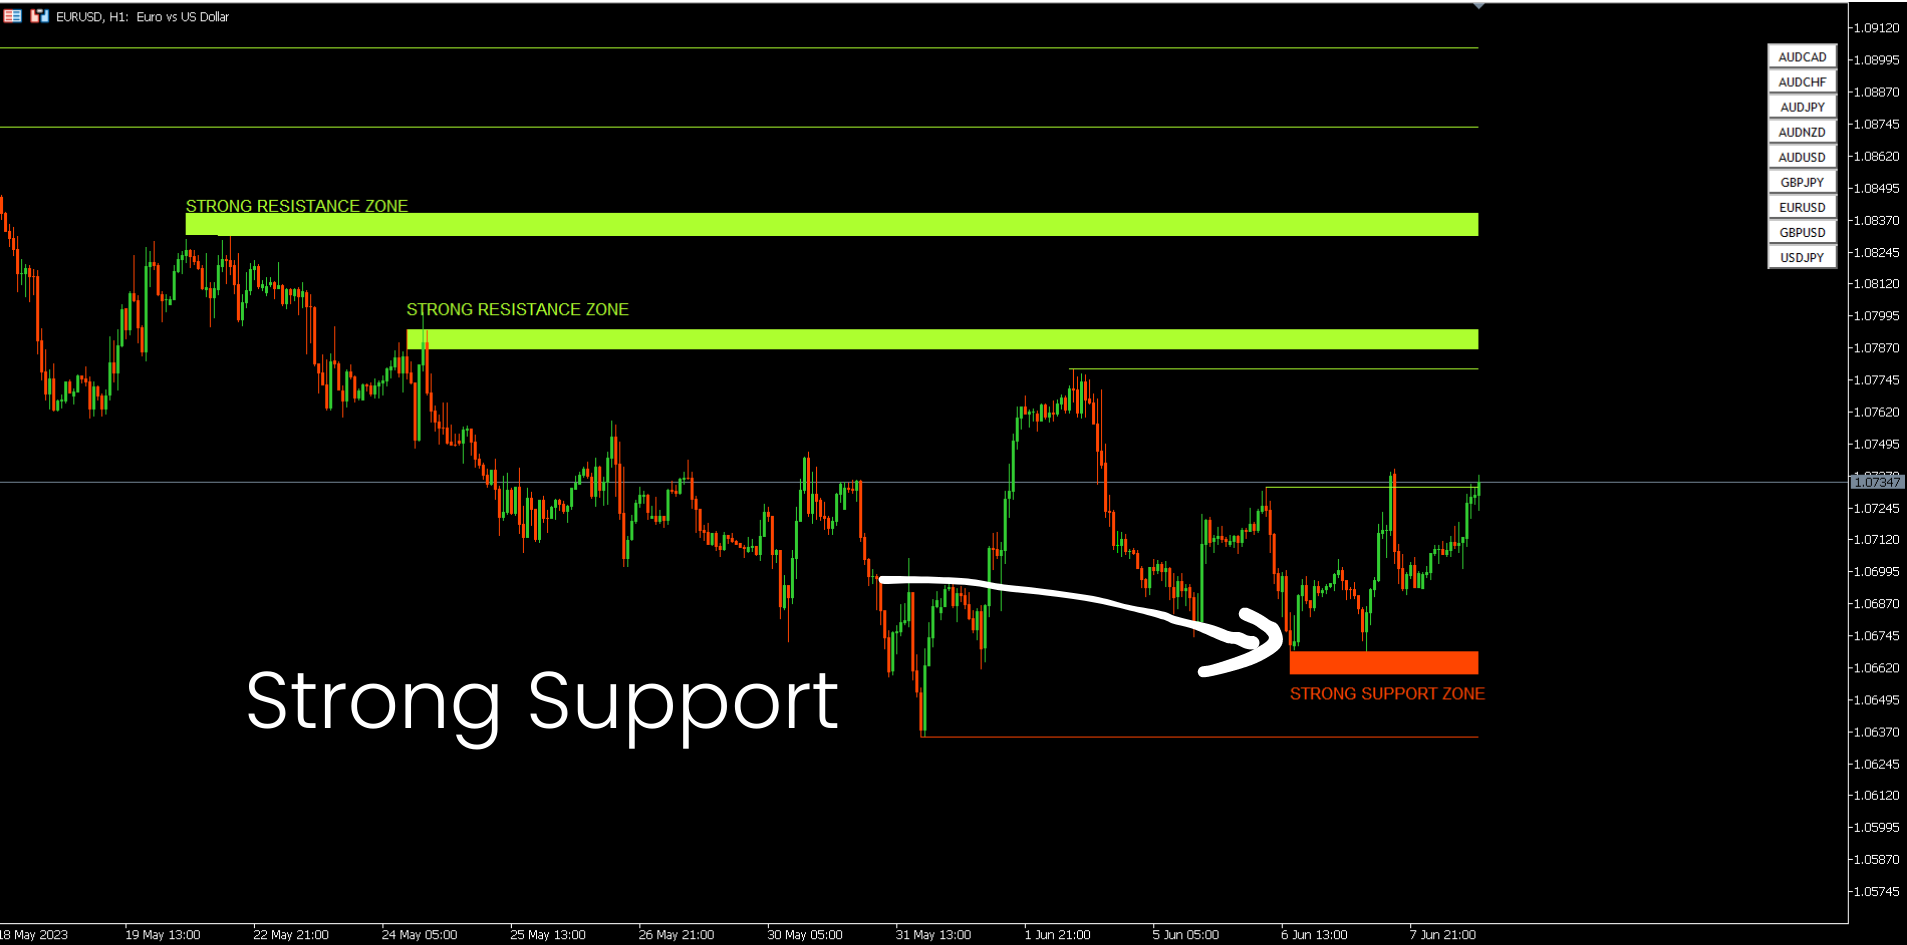
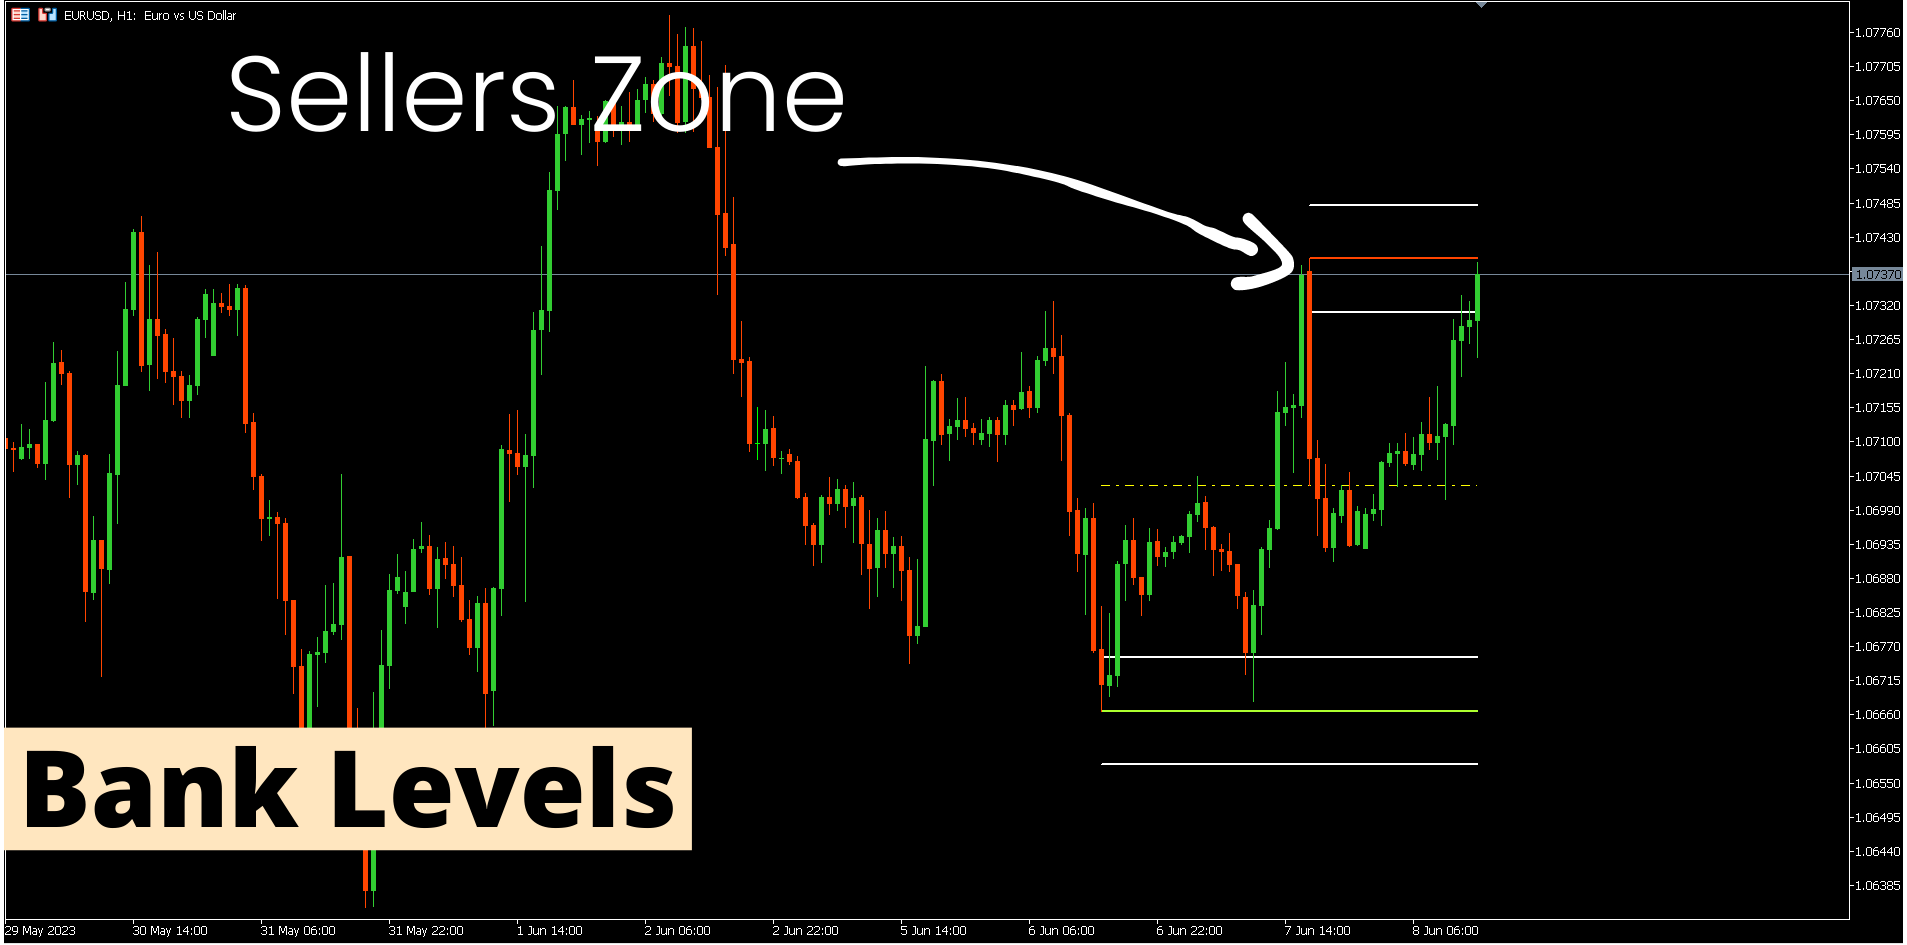
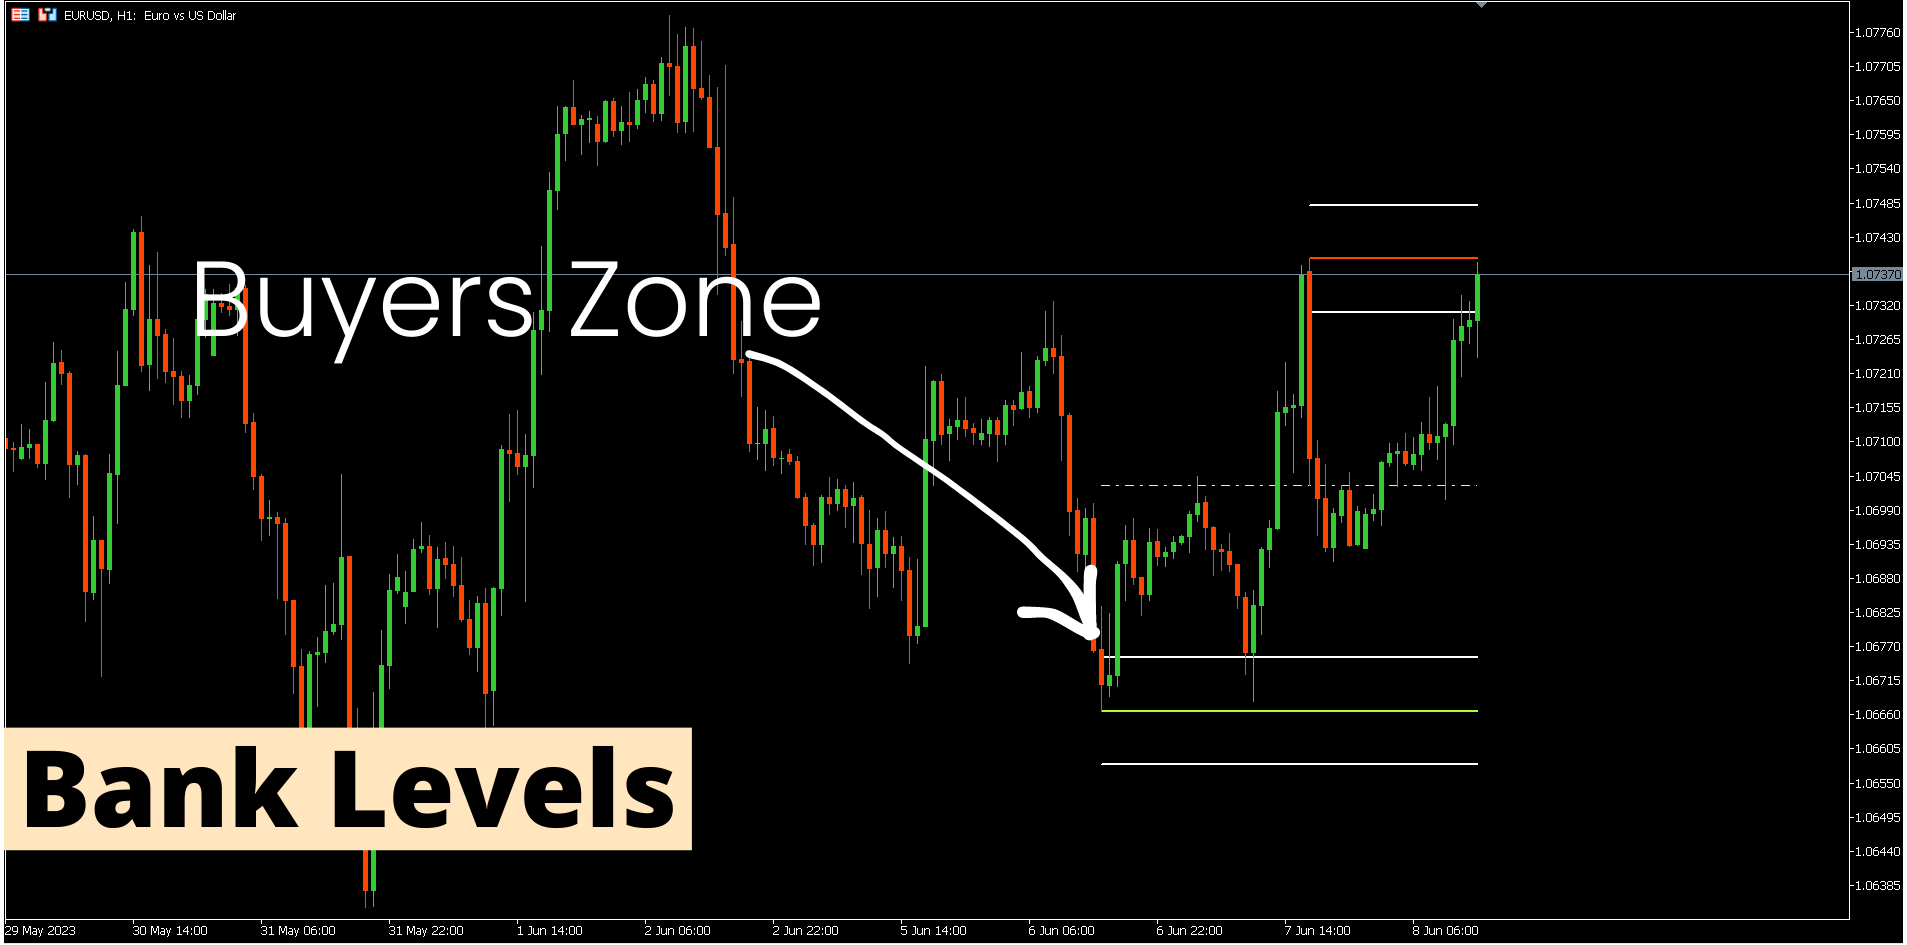
3. Optimize Bank level zones.
버전 11.1 2023.02.03
1. Combine Breakout/Pullback Zones to provide one zone with arrows.
버전 10.12 2023.01.23
1. Fixing speeling mistakes in the text of the alerts.
버전 10.10 2023.01.23
1. Fixing alert issue with In Buyers and Sellers Zones. ( PullBack - Breakout Zones Alerts )
2. Optimizing Buyers and Sellers backtesting speed.
버전 10.0 2023.01.18
1. Change Pullback Zones logic.
2. Add Breakout zones.
3. Remove the Bank level feature.
버전 9.30 2023.01.13
1. Improve the PullBack zone algorithm to wait for the bar to close to confirm the zone.
버전 9.2 2022.11.24
1. Add a Central line for Bank levels.
2. Optimizing and improving the Strong Support and Resistance zones Algorithm.
버전 9.1 2022.08.08
1. Fixing changing mode issues and cleaning old zones
버전 9.0 2022.08.07
1. Optimizing Pullback feature algorithm.
2. Add an option to keep old pullback zones.
버전 8.50 2022.05.30
1. Add a new feature: Bank Levels.
2. Add Alerts to the Price Action Screener.
버전 8.40 2022.02.08
1. Add Line Width for Pivots lines.
버전 8.30 2022.02.03
1. Add support for US30 via sensitivity parameter.
버전 8.21 2021.12.24
1. Optimizing Indicator code and speed performance.
2. Add Pivots points levels.
버전 8.20 2021.10.06
1. Optimizing indicator algorithm.
버전 8.10 2021.05.09
1. Increase indicator speed.
버전 8.0 2021.04.27
- Fixing issue of pairs navigator with GKFX Broker.
버전 7.50 2020.12.03
1. Algorithm optimization.
버전 7.20 2020.11.29
1. Fixing refreshing issue.
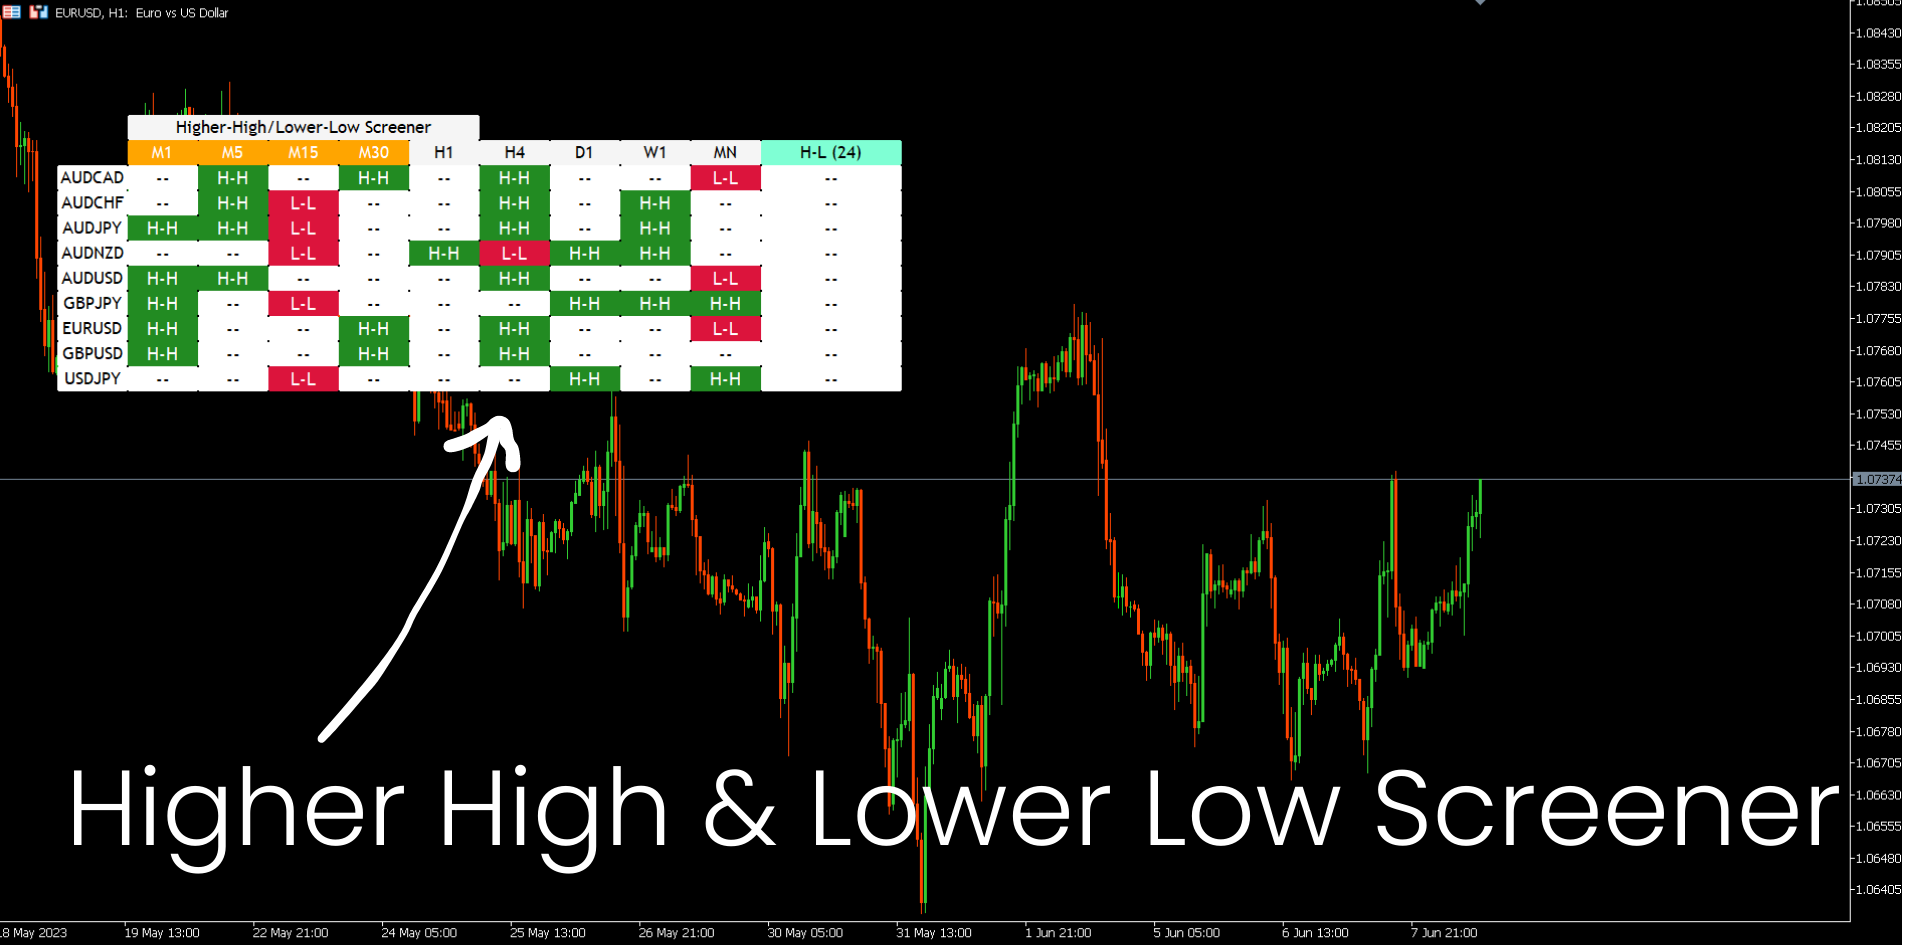