• Información general
  • Comentarios (21)
  • Discusión (60)
  • Novedades

Support and Resistance Screener Pro MT5

4.71

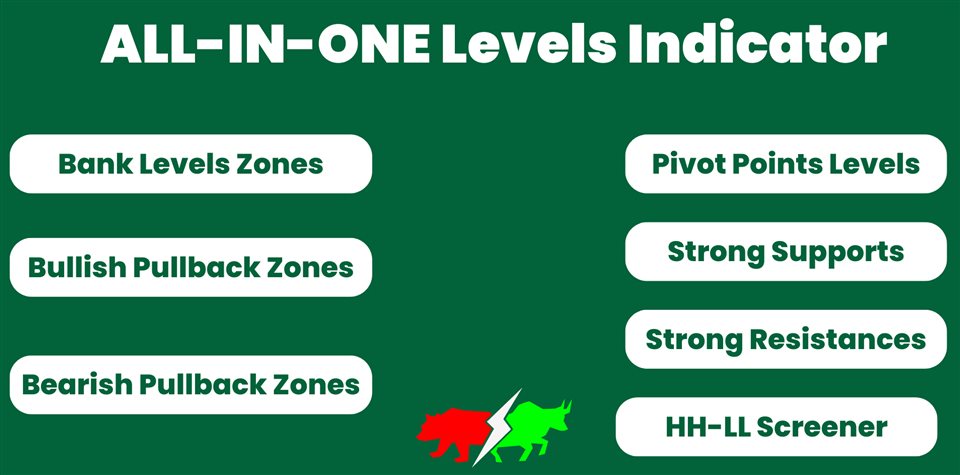
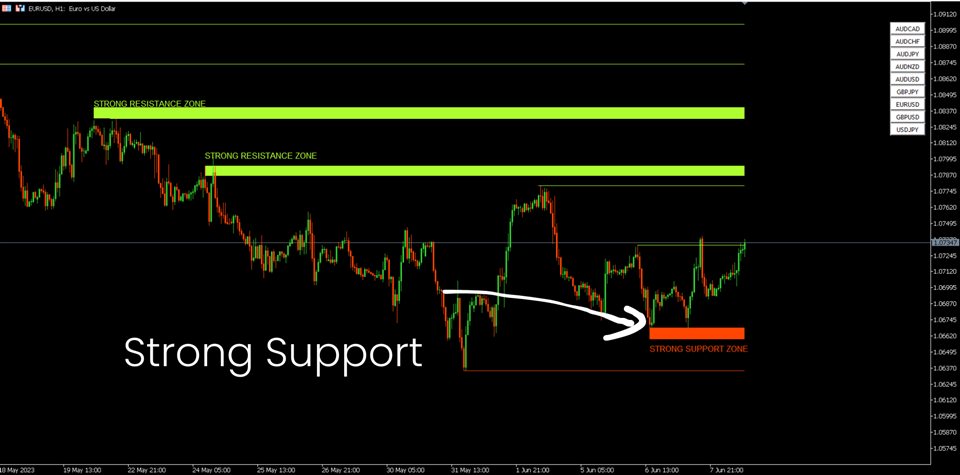
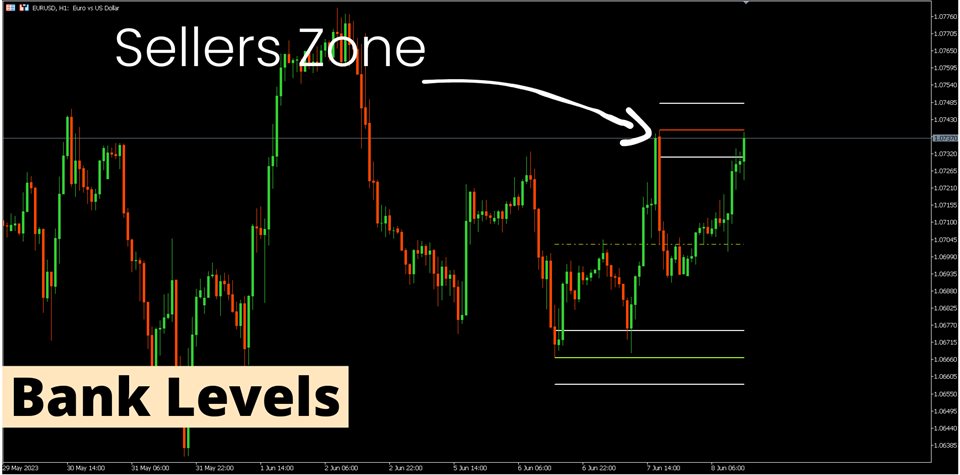
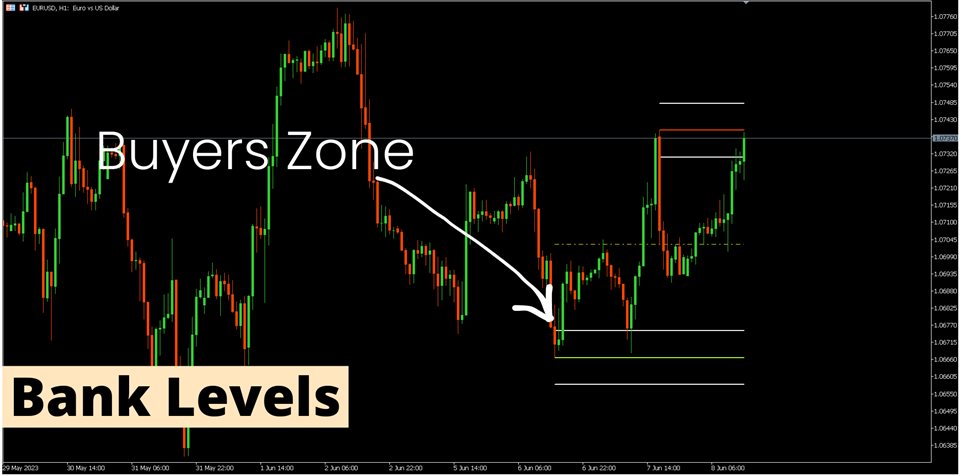
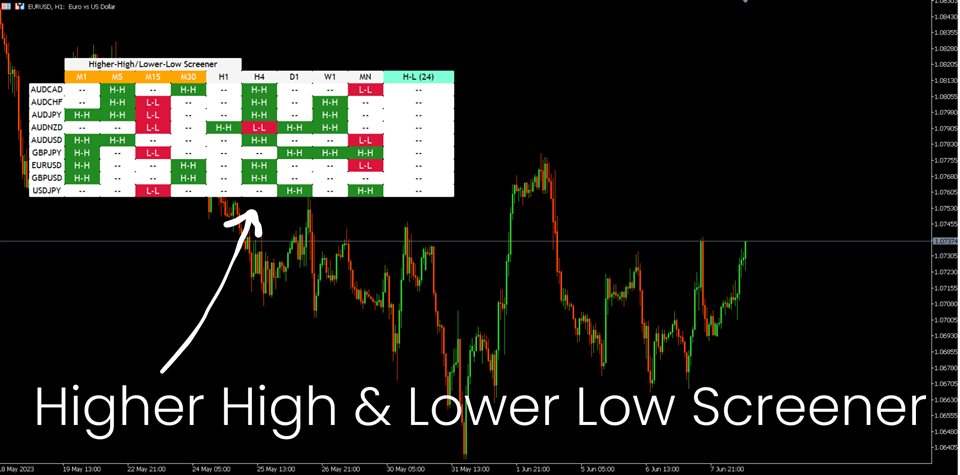
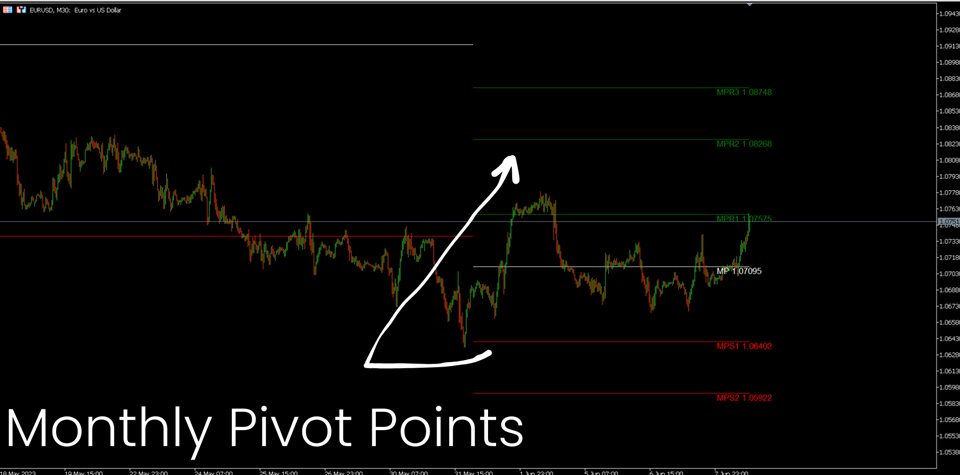
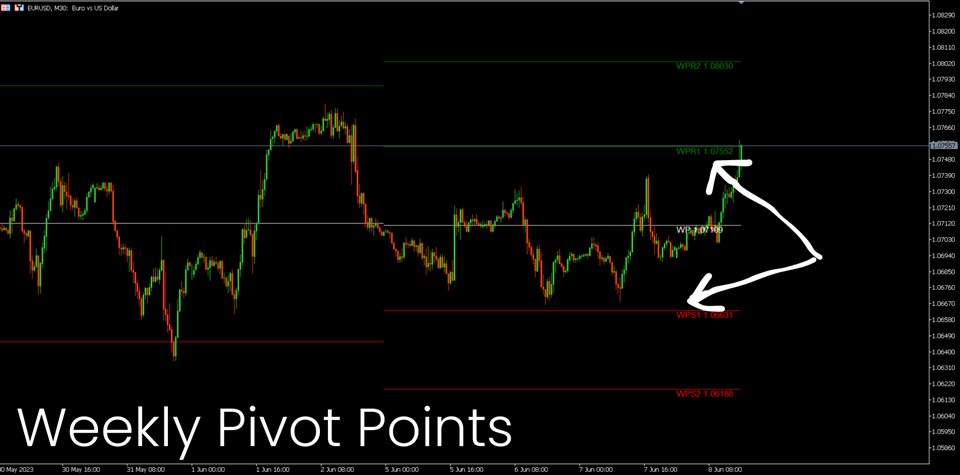
Support And Resistance Screener está en un indicador de nivel para MetaTrader que proporciona múltiples herramientas dentro de un indicador. Las herramientas disponibles son:

1. Cribador de estructura de mercado.

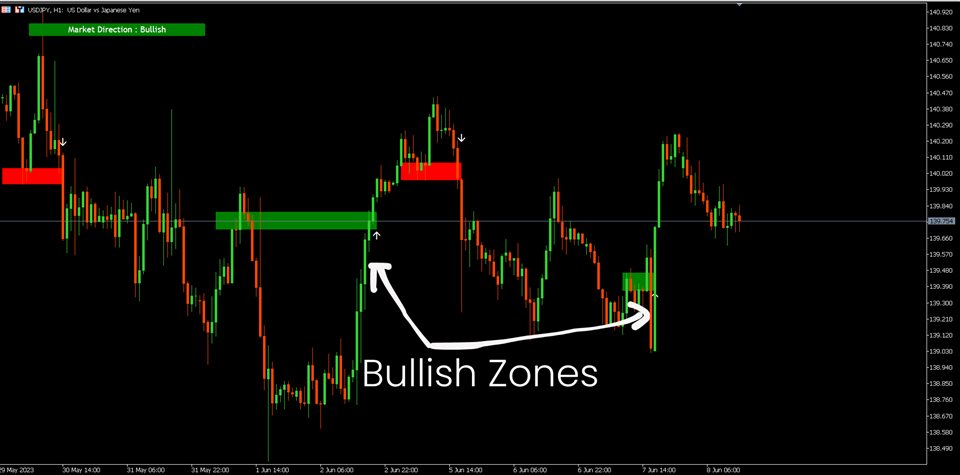
2. Zona de retroceso alcista.

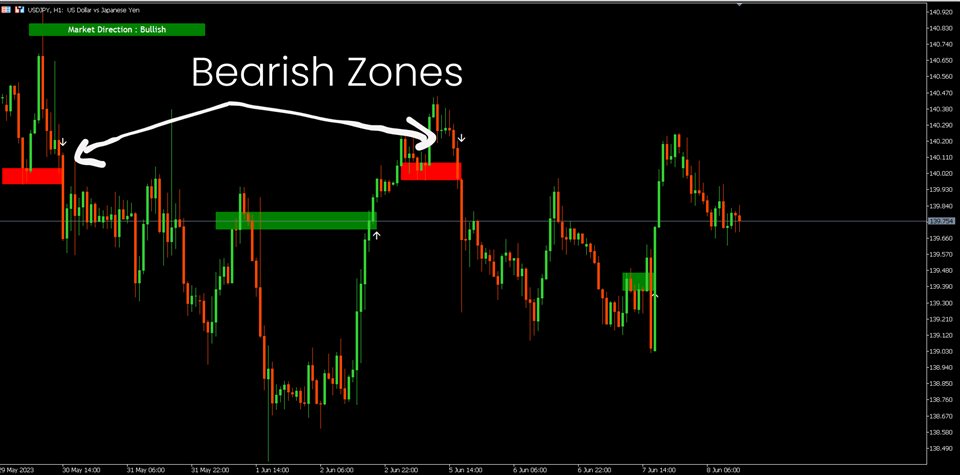
3. Zona de retroceso bajista.

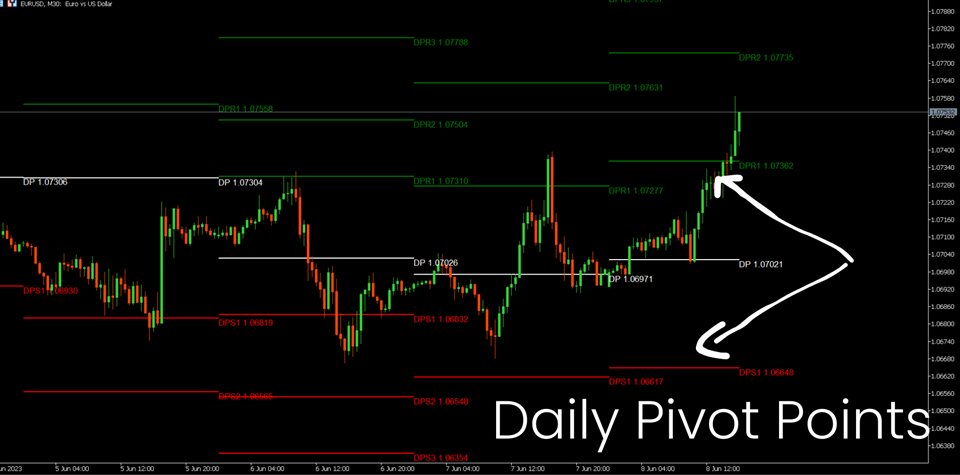
4. Puntos pivotes diarios

5. Puntos de pivote semanales

6. Puntos Pivotes mensuales

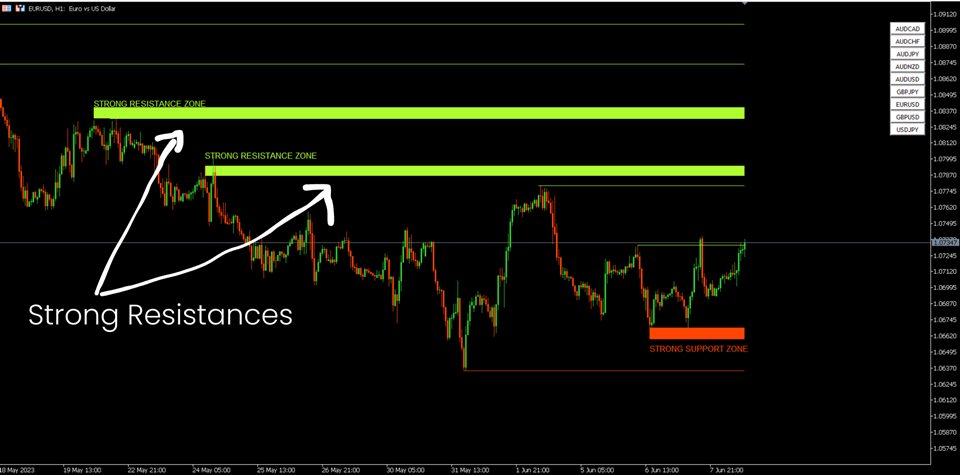
7. Fuerte soporte y resistencia basado en patrón armónico y volumen.

8. Zonas de nivel de banco.

OFERTA POR TIEMPO LIMITADO: El indicador de soporte y resistencia HV está disponible por solo 50 $ y de por vida. (Precio original 125 $)
Al acceder a nuestro Blog MQL5, puede encontrar todos nuestros indicadores premium con ejemplos de análisis: Haga clic aquí


Características clave

  • Zonas de fuerte soporte y resistencia basadas en algoritmos armónicos y de volumen.
  • Zonas de pullbacks alcistas y bajistas basadas en algoritmos armónicos y de volumen.
  • Evaluador de estructura de mercado.
  • Puntos Pivots diarios, semanales y mensuales.

Documentaciones

Toda la documentación (Instrucciones) de Support and Resistance Screener y los detalles de la estrategia están disponibles en esta publicación en nuestro Blog de MQL5: Haga clic aquí.


Contacto

Si tiene alguna pregunta o si necesita ayuda, contácteme por mensaje privado.


Autor

SAYADI ACHREF, ingeniero de software fintech y fundador de Finansya.
Comentarios 20
Clinton Van
118
Clinton Van 2024.09.25 15:43 
 

I love both indicators Trend screener Pro and Support and Resistance Screener Pro but you can't use them blindly. You need to understand market structure. I always try to trade a strong currency versus a weaker one. I then trade with the trend after price makes corrections. The Support and resistance indicator helps see how close price is from support or resistance. On uptrend I buy at support levels and downtrend I buy at resistance levels of price corrections. Together these indicators is all you need to make informed decisions. I do my analysis on the 1H time Frame and then I enter my trades using the 1min or 5min time frames. Thanks for these indicators. They really safe me allot of time.

Jerry Slagger
92
Jerry Slagger 2023.09.15 20:10 
 

This is one of the main indicators I use and I have been using it for 2 months now. The new version 13 is awesome. It allows all the levels to be displayed at the same time. So I can see that price is pushing a major or minor level, etc. These levels, along with the PullBack feature bring it all together so one can easily see the best entry / exit points. The HH LL Scanner is awesome as well. I use it to see if price is too high / low to enter, to make sure I am not entering after the move has already happened. Support is top notch and responsive.

Dunstan Wafula Namusonge
851
Dunstan Wafula Namusonge 2023.06.09 19:26 
 

The reason why I like this forex indicator so much is because it is easy to use. The indicator accurately gives me both price action and technical analysis at the same time. The multi-functional features make this a unique product. Alerts are accurate with precise signals. The author is very responsive and available. I strongly recommend this indicator.Trust me when I say that this will be your go to indicator once you try it.

Productos recomendados
Laguerre SuperTrend Clouds   adds an Adaptive Laguerre averaging algorithm and alerts to the widely popular SuperTrend indicator. As the name suggests,   Laguerre SuperTrend Clouds (LSC)   is a trending indicator which works best in trendy (not choppy) markets. The SuperTrend is an extremely popular indicator for intraday and daily trading, and can be used on any timeframe. Incorporating Laguerre's equation to this can facilitate more robust trend detection and smoother filters. The LSC uses the
Noize Absorption Index - is the manual trading system that measures the difference of pressure between bears forces and bulls forces. Green line - is a noize free index that showing curent situation. Zero value of index shows totally choppy/flat market.Values above zero level shows how powerfull bullish wave is and values below zero measures bearish forces.Up arrow appears on bearish market when it's ready to reverse, dn arrow appears on weak bullish market, as a result of reverse expectation.
Swing Points
Usiola Oluwadamilol Olagundoye
Swing Points Indicator for MetaTrader 5 The **Swing Points Indicator** is a custom-built technical tool designed for MetaTrader 5 (MT5), primarily used for identifying crucial reversal points in price action. By plotting swing highs and swing lows, it highlights potential trend reversals, making it a valuable tool for traders relying on price action analysis. This indicator helps traders anticipate changes in market direction by visually marking significant turning points on the chart. Main
FREE
An indicator of pattern #31 ("Long Island") from Encyclopedia of Chart Patterns by Thomas N. Bulkowski. The second gap is in the opposite direction. Parameters: Alerts - show alert when an arrow appears   Push - send a push notification when an arrow appears (requires configuration in the terminal) GapSize - minimum gap size in points ArrowType - a symbol from 1 to 17 ArrowVShift - vertical shift of arrows in points   ShowLevels - show levels ColUp - color of an upward line ColDn - color of a
Trading Utility for Forex Currency Pairs Only not for Gold  Functions Auto Lot Calculation based on Risk Auto stoploss  Auto TakeProfit Breakeven Auto Close Half % Close in percentage with respect to the PIPs Pending Orders BuyLimit Sell Limit with distances BuyStop Sell Stop    with distances Trading Informations Risk in percentage For Multiple trades Combine Takeprofit and Combine Stoplosses
US30NinjaMT5
Satyaseelan Shankarananda Moodley
US30 Ninja is a 5 minute scalping indicator that will let know you when there is a trade set up (buy or sell). Once the indicator gives the trade direction, you can open a trade and use a 30 pip stop loss and a 30 pip to 50 pip take profit. Please trade at own own risk. This indicator has been created solely for the US30 market and may not yield positive results on any other pair. 
Volality Index Scalper
Lesedi Oliver Seilane
5 (1)
Volality Index scalper indicator  Meant for Volality pairs such as Volality 10, 25, 50, 75 and 100 The indicator works on all timeframes from the 1 minute to the monthly timeframe the indicator is non repaint the indicator has 3 entry settings 1 color change on zero cross 2 color change on slope change 3 color change on signal line cross Orange line is your sell signal Blue line is your buy signal.
Bienvenido al indicador de reconocimiento Ultimate Harmonic Patterns Este indicador detecta el patrón de Gartley, el patrón de murciélago y el patrón de cifrado en función de HH y LL de la estructura de precios y los niveles de Fibonacci, y cuando se alcanzan ciertos niveles de fib, el indicador mostrará el patrón en el gráfico. Este indicador es una combinación de mis otros 3 indicadores que detecta patrones avanzados Características : Algoritmo avanzado para detectar el patrón con alta precisi
Owl Smart Levels MT5
Sergey Ermolov
4.07 (28)
Versión MT4  |  FAQ El Indicador Owl Smart Levels es un sistema comercial completo dentro de un indicador que incluye herramientas de análisis de mercado tan populares como los fractales avanzados de Bill Williams , Valable ZigZag que construye la estructura de onda correcta del mercado y los niveles de Fibonacci que marcan los niveles exactos de entrada. en el mercado y lugares para tomar ganancias. Descripción detallada de la estrategia Instrucciones para trabajar con el indicador Asesor de c
You can change the time period of the chart at the touch of a button. You can also change multiple charts at the touch of a button. You can also change multiple charts at the touch of a button,   saving you the trouble of changing time periods. We are live-streaming the actual operation of the system. Please check for yourself if it is usable. Please check it out for yourself. https://www.youtube.com/@ganesha_forex We do not guarantee your investment results. Investments should be made at y
[ MT4 Version ] Supply and Demand Multitimeframe Supply and Demand Multitimeframe is the first indicator in the market that combines multiple aspects like trading volume, price structure and momentum to identify Supply and Demand zones for every asset. The Supply and Demand indicator analyzes simultaneously up to 4 different TFs and represents their information in the current graph. Its interactive UI highlights everytime the price enters a Supply or Demand zone even if the zones are not visible
PZ Chart Overlay MT5
PZ TRADING SLU
4.5 (2)
El indicador de superposición de gráficos muestra la acción del precio de varios instrumentos en el mismo gráfico, lo que le permite evaluar qué tan diferentes fluctúan los pares de divisas entre sí. [ Guía de instalación | Guía de actualización | Solución de problemas | FAQ | Todos los productos ] Encuentre pares de divisas sobrecomprados o sobrevendidos fácilmente Trace hasta seis pares de divisas superpuestos en el mismo gráfico Mostrar símbolos invertidos si es necesario Adaptarse al ta
HMA Trend Professional MT5
Pavel Zamoshnikov
4.25 (4)
Improved version of the free HMA Trend indicator (for MetaTrader 4) with statistical analysis. HMA Trend is a trend indicator based on the Hull Moving Average (HMA) with two periods. HMA with a slow period identifies the trend, while HMA with a fast period determines the short-term movements and signals in the trend direction. The main differences from the free version: Ability to predict the probability of a trend reversal using analysis of history data. Plotting statistical charts for analyz
nuestro indicador   Basic Support and Resistance   es la solución que necesita para aumentar su análisis técnico.Este indicador le permite proyectar niveles de soporte y resistencia en el gráfico/ mt4 gratuita características Integración de los niveles de Fibonacci: Con la opción de mostrar los niveles de Fibonacci junto con los niveles de soporte y resistencia, nuestro indicador le brinda una visión aún más profunda del comportamiento del mercado y las posibles áreas de inversión. Optimiza
An indicator of pattern #30 ("Island Reversal") from Encyclopedia of Chart Patterns by Thomas N. Bulkowski (two gaps, the second gap is in the direction of the first one). Parameters: Alerts - show alert when an arrow appears   Push - send a push notification when an arrow appears (requires configuration in the terminal) GapSize - minimum gap size in points ArrowType - a symbol from 1 to 17 ArrowVShift - vertical shift of arrows in pixels ShowLevels - show levels ColUp - color of an upward line
The   Supply and Demand Zones indicator   is one of the best tools we have ever made. This great tool automatically draws supply and demand zones, the best places for opening and closing positions. It has many advanced features such as multi timeframe zones support, displaying the width of zones, alert notifications for retouched zones, and much more. Because of market fractality, this indicator can be used for any kind of trading. Whether you are a positional, swing, or intraday trader does no
This indicator studies price action as an aggregation of price and time vectors, and uses the average vector to determine the direction and strength of the market. This indicator highlights the short-term directionality and strength of the market, and can be used to capitalize from short-term price movements by trading breakouts or binary options   [ Installation Guide | Update Guide | Troubleshooting | FAQ | All Products ] Find market direction easily Confirm with breakouts or other indicators
Pipfinite creates unique, high quality and affordable trading tools. Our tools may or may not work for you, so we strongly suggest to try the Demo Version for MT4 first. Please test the indicator prior to purchasing to determine if it works for you. We want your good reviews, so hurry up and test it for free...we hope you will find it useful. Combo Energy Beam with Swing Control Strategy: Confirm swing pullback signals Watch Video: (Click Here) Energy Beam with Trend Laser Strategy: Confirm Tr
FX Levels es un indicador de soporte y resistencia excepcionalmente preciso que fusiona el método Lighthouse tradicional con un enfoque dinámico innovador, funcionando a la perfección en todos los símbolos de negociación. Esto incluye pares de divisas, índices, acciones o materias primas. FX Levels identifica puntos de reversión y los muestra en el gráfico, que pueden utilizarse idealmente como objetivos de beneficios en sus actividades de negociación. En el desarrollo de FX Levels, hemos utili
Magic sl NASDAQ 100
Benyamin Naser Mokhtari Karchegani
The indicator now at your disposal is undoubtedly one of the best tools for trading in the NASDAQ 100 market, especially in the 1-minute and 5-minute timeframes. This indicator is meticulously designed for high precision and can be adjusted for other timeframes as well. Simply run it and receive good exit signals. Key Features: Specialized performance in the 1-minute and 5-minute timeframes: While this indicator works in other timeframes as well, its primary focus is on these two timeframes. Co
Ultimate Supply Demand MT5
Ramon Sobrevals Arce
5 (4)
After working during many months, with the help of Neural Networks, we have perfected the ultimate tool you are going to need for identifying key price levels (Supports and Resistances) and Supply and Demand zones. Perfectly suitable to trigger your trades, set up your future actions, decide your Take Profit and Stop Loss levels, and confirm the market direction. Price will always move between those levels, bouncing or breaking; from one zone to another, all the remaining movements are just mark
El indicador Boom and Crash Spike Detector está codificado en base a una estrategia avanzada principalmente para detectar Boom and Crash en los precios. Se implantaron algoritmos complejos para detectar auges y caídas de alta probabilidad en los precios. Alerta sobre posibles fases de auge o choque: Fase de auge: cuando el precio aumenta demasiado rápido. Crash Phase: cuando el precio baja demasiado rápido. OFERTA POR TIEMPO LIMITADO: El indicador está disponible por solo 30 $ y de por vida. 
Awesome Oscillator by Bill Williams with the ability to fine-tune and replace the averaging algorithms of the indicator, which significantly expands the possibilities of using this oscillator in algorithmic trading and brings it closer in its properties to such an indicator as the MACD. To reduce price noise, the final indicator is processed with an additional Smooth averaging. The indicator has the ability to give alerts, send mail messages and push signals when the direction of movement of th
>>> BIG SALE PROMOTION: 50% OFF + GIFT EA!  - Promo price: $64 / Regular price $129 <<< - The promotion will end soon! The Forex Trend Tracker is an advanced tool designed to enhance the trading capabilities of forex traders. This sophisticated indicator uses complex mathematical formulas alongside the Average True Range (ATR) to detect the beginnings of new upward and downward trends in the forex market. It offers visual cues and real-time alerts to give traders a competitive advantage in th
Este es un indicador MTF de niveles de soporte y resistencia basado en los   extremos del indicador Advanced ZigZag Dynamic   y / o   Extended Fractals   con etiquetas de precio (se puede deshabilitar). Se pueden seleccionar TF más altos para el modo MTF. De forma predeterminada, los niveles se generan en función de los puntos indicadores de ZigZag. Los puntos indicadores de fractales también se pueden usar junto con ZigZag o en su lugar. Para simplificar el uso y ahorrar tiempo de CPU, el cálcu
Snipeer2
Ignacio Agustin Mene Franco
Sniper2 ,  Cuenta con puntos  de lineas , con colores que te estan mostrando una entrada ,  que funcionan como soporte y resistencia !  las lineas de puntos verdes verde muestra entrada en venta ,  las lineas de puntos rojos muestra entrada en compra , fijarse en los soportes   que funcionan como roptura para agarrar velas largas en mayor temporalidad .  funciona para forex todo los pares  funciona para indices sinteticos todo los pares !  indicador en oferta ! 
An indicator of patterns #24, #25, #26 and #27 ("Head and Shoulders", "Complex Head and Shoulders") from Encyclopedia of Chart Patterns by Thomas N. Bulkowski. Parameters: Alerts - show alert when an arrow appears   Push - send a push notification when an arrow appears (requires configuration in the terminal) PeriodBars - indicator period K - an additional parameter that influences the accuracy of pattern shape recognition. The smaller the value is, the smoother the row of peaks/valleys shoul
Stratos Pali mt5
Michela Russo
5 (2)
Stratos Pali Indicator is a revolutionary tool designed to enhance your trading strategy by accurately identifying market trends. This sophisticated indicator uses a unique algorithm to generate a complete histogram, which records when the trend is Long or Short. When a trend reversal occurs, an arrow appears, indicating the new direction of the trend. Important Information Revealed Leave a review and contact me via mql5 message to receive My Top 5 set files for Stratos Pali at no cost ! Do
All Harmonics 26
Alexey Isavnin
3.5 (4)
Harmonic patterns are characteristic series of price movements with respect to Fibonacci levels, which statistically precede price reversals. This indicator searches for harmonic patterns. It is capable of recognising 26 classical and non-classical harmonic patterns : Classical Gartley Butterfly Alternate Butterfly Bat Alternate Bat Crab Deep Crab Three Drives Non-classical Shark Alternate Shark Cypher 5-0 Anti Gartley Anti Butterfly Anti Alternate Butterfly Anti Bat Anti Alternate Bat Anti Crab
Atomic Analyst MT5
Issam Kassas
4.32 (19)
En primer lugar, vale la pena enfatizar que este Indicador de Trading no repinta, no redibuja y no se retrasa, lo que lo hace ideal tanto para el trading manual como para el automatizado. Manual del usuario: configuraciones, entradas y estrategia. El Analista Atómico es un Indicador de Acción del Precio PA que utiliza la fuerza y el impulso del precio para encontrar una mejor ventaja en el mercado. Equipado con filtros avanzados que ayudan a eliminar ruidos y señales falsas, y aumentan el poten
Los compradores de este producto también adquieren
TPSproTREND PrO MT5
Roman Podpora
4.9 (10)
TPSpro TREND PRO  - is a trend indicator that automatically analyzes the market and provides information about the trend and each of its changes, as well as giving signals for entering trades without redrawing! The indicator uses each candle, analyzing them separately. referring to different impulses - up or down impulse. Exact entry points into transactions for currencies, crypto, metals, stocks, indices!  Version MT4               DETAILED DESCRIPTION               R ecommended to use with an
TPSpro RFI Levels MT5
Roman Podpora
4.75 (12)
INSTRUCCIONES       RUSO   -   ING        Se   recomienda utilizar con un indicador.       -       TPSpro   TENDENCIA PRO -   Versión MT5 Un elemento clave en el trading son las zonas o niveles desde los que se toman las decisiones de compra o venta de un instrumento de trading. A pesar de los intentos de los principales actores de ocultar su presencia en el mercado, inevitablemente dejan rastros. Nuestra tarea era aprender a identificar estos rastros e interpretarlos correctamente. Funciones p
Quantum TrendPulse
Bogdan Ion Puscasu
5 (1)
Presentamos   Quantum TrendPulse   , la herramienta de trading definitiva que combina el poder de   SuperTrend   ,   RSI   y   Stochastic   en un indicador integral para maximizar su potencial de trading. Diseñado para traders que buscan precisión y eficiencia, este indicador le ayuda a identificar tendencias del mercado, cambios de impulso y puntos de entrada y salida óptimos con confianza. Características principales: Integración con SuperTrend:   siga fácilmente la tendencia predominante del
FX Power MT5 NG
Daniel Stein
5 (7)
Obtenga su actualización diaria del mercado con detalles y capturas de pantalla a través de nuestro Morning Briefing aquí en mql5 y en Telegram ! FX Power MT5 NG es la nueva generación de nuestro popular medidor de fuerza de divisas, FX Power. ¿Y qué ofrece este medidor de fuerza de nueva generación? Todo lo que le encantaba del FX Power original PLUS Análisis de fuerza de ORO/XAU Resultados de cálculo aún más precisos Períodos de análisis configurables individualmente Límite de cálculo persona
Primero que todo, vale la pena enfatizar que este Sistema de Trading es un Indicador No Repintado, No Redibujado y No Retrasado, lo que lo hace ideal tanto para el trading manual como para el automatizado. Curso en línea, manual y descarga de ajustes preestablecidos. El "Sistema de Trading Inteligente MT5" es una solución completa de trading diseñada para traders nuevos y experimentados. Combina más de 10 indicadores premium y presenta más de 7 estrategias de trading robustas, lo que lo convie
Matrix Arrow Indicator MT5
Juvenille Emperor Limited
5 (13)
Matrix Arrow Indicator MT5   es una tendencia única 10 en 1 que sigue un indicador   100% sin repintado   de marcos temporales múltiples que se puede usar en todos los símbolos/instrumentos:   divisas ,   materias primas ,   criptomonedas ,   índices ,   acciones .  Matrix Arrow Indicator MT5  determinará la tendencia actual en sus primeras etapas, recopilando información y datos de hasta 10 indicadores estándar, que son: Índice de movimiento direccional promedio (ADX) Índice de canales de prod
PZ Swing Trading MT5
PZ TRADING SLU
5 (4)
Swing Trading es el primer indicador diseñado para detectar oscilaciones en la dirección de la tendencia y posibles oscilaciones de reversión. Utiliza el enfoque de intercambio de línea de base, ampliamente descrito en la literatura comercial. El indicador estudia varios vectores de precios y tiempos para rastrear la dirección de la tendencia agregada y detecta situaciones en las que el mercado está sobrevendido o sobrecomprado y listo para corregir. [ Guía de instalación | Guía de actualización
Introduciendo       Quantum Breakout PRO   , el innovador indicador MQL5 que está transformando la forma en que comercia con Breakout Zones. Desarrollado por un equipo de comerciantes experimentados con experiencia comercial de más de 13 años,       Desglose cuántico PRO       está diseñado para impulsar su viaje comercial a nuevas alturas con su innovadora y dinámica estrategia de zona de ruptura. El indicador de ruptura cuántica le dará flechas de señal en las zonas de ruptura con 5 zonas
FX Volume MT5
Daniel Stein
4.93 (14)
Obtenga su actualización diaria del mercado con detalles y capturas de pantalla a través de nuestro Morning Briefing aquí en mql5 y en Telegram ! FX Volume es el PRIMER y ÚNICO indicador de volumen que proporciona una visión REAL del sentimiento del mercado desde el punto de vista de un bróker. Proporciona una visión impresionante de cómo los participantes institucionales del mercado, como los brokers, están posicionados en el mercado Forex, mucho más rápido que los informes COT. Ver esta info
Este es un genial indicador para MT5 que ofrece señales precisas para entrar en una transacción sin redibujar. Se puede aplicar a cualquier activo financiero: fórex, criptomonedas, metales, acciones, índices. Nos dará valoraciones bastante precisas y nos dirá cuándo es mejor abrir y cerra una transacción. Eche un vistazo  al vídeo  (6:22), ¡contiene un ejemplo de procesamiento de una sola señal que ha amortizado el indicador! La mayoría de los tráders mejoran sus resultados comerciales durante l
Ahora $ 147 (aumentando a $ 499 después de algunas actualizaciones) - Cuentas ilimitadas (PC o Mac) Manual de usuario de RelicusRoad + Videos de capacitación + Acceso al grupo privado de Discord + Estado VIP UNA NUEVA MANERA DE VER EL MERCADO RelicusRoad es el indicador comercial más poderoso del mundo para divisas, futuros, criptomonedas, acciones e índices, y brinda a los comerciantes toda la información y las herramientas que necesitan para mantenerse rentables. Brindamos análisis téc
Blahtech Supply Demand MT5
Blahtech Limited
4.54 (13)
Was: $299  Now: $99   Supply Demand uses previous price action to identify potential imbalances between buyers and sellers. The key is to identify the better odds zones, not just the untouched ones. Blahtech Supply Demand indicator delivers functionality previously unavailable on any trading platform. This 4-in-1 indicator not only highlights the higher probability zones using a multi-criteria strength engine, but also combines it with multi-timeframe trend analysis, previously confirmed swings
¡La mejor solución para cualquier operador novato o experto! Este indicador es una herramienta única, de alta calidad y asequible porque hemos incorporado una serie de características propias y una nueva fórmula. ¡Con sólo UN gráfico puede leer la Fuerza de la Divisa para 28 pares de Divisas! Imagínese cómo mejorará su operativa porque podrá señalar el punto exacto de activación de una nueva tendencia o de una oportunidad de scalping. Manual del usuario: haga   clic aquí Ese es el primero
IX Power MT5
Daniel Stein
4.17 (6)
IX Power   lleva por fin la insuperable precisión de FX Power a los símbolos que no son de Forex. Determina con exactitud la intensidad de las tendencias a corto, medio y largo plazo de tus índices, acciones, materias primas, ETF e incluso criptodivisas favoritas. Puede   analizar todo lo   que su terminal le ofrece. Pruébalo y experimenta cómo   tu timing mejora significativamente   a la hora de operar. Características principales de IX Power Resultados de cálculo 100% precisos y sin rep
Quantum Trend Sniper
Bogdan Ion Puscasu
4.71 (49)
Introduciendo       Indicador Quantum Trend Sniper   , el innovador indicador MQL5 que está transformando la forma en que identificas y negocias los cambios de tendencia. Desarrollado por un equipo de comerciantes experimentados con experiencia comercial de más de 13 años,       Indicador de francotirador de tendencia cuántica       está diseñado para impulsar su viaje comercial a nuevas alturas con su forma innovadora de identificar cambios de tendencia con una precisión extremadamente alta.
Italo Trend Indicator MT5
Italo Santana Gomes
4.9 (10)
BUY INDICATOR AND GET EA FOR FREE AS A BONUS + SOME OTHER GIFTS! ITALO TREND INDICATOR  is the best trend indicator on the market, the Indicator works on all time-frames and assets, indicator built after 7 years of experience on forex and many other markets. You know many trend indicators around the internet are not complete, does not help, and it's difficult to trade, but the Italo Trend Indicator is different , the Italo Trend Indicator shows the signal to buy or sell, to confirm the signal t
Auto Order Block with break of structure based on ICT and Smart Money Concepts (SMC) Futures Break of Structure ( BoS )             Order block ( OB )            Higher time frame Order block / Point of Interest ( POI )    shown on current chart           Fair value Gap ( FVG ) / Imbalance   -  MTF      ( Multi Time Frame )    HH/LL/HL/LH  -  MTF      ( Multi Time Frame )  Choch  MTF      ( Multi Time Frame )  Volume Imbalance     ,  MTF          vIMB Gap’s Power of 3 Equal High
Gold TMAF MTF - es el mejor indicador técnico bursátil. El algoritmo del indicador analiza el movimiento del precio de un activo y refleja la volatilidad y las posibles zonas de entrada. Las mejores señales del indicador: - Para VENTA = límite superior rojo de TMA2 por encima del límite superior rojo de TMA1 + indicador fractal rojo por encima + flecha amarilla de señal SR en la misma dirección. - Para COMPRA = límite inferior azul de TMA2 por debajo del límite inferior azul de TMA1 + i
TPA True Price Action indicator reveals the true price action of the market makers through 100% non-repainting signals strictly at the close of a candle! TPA shows entries and re-entries, every time the bulls are definitely stronger than the bears and vice versa. Not to confuse with red/green candles. The shift of power gets confirmed at the earliest stage and is ONE exit strategy of several. There are available now two free parts of the TPA User Guide for our customers. The first "The Basics"
Este indicador reconoce más de 30 patrones de velas japonesas y los resalta maravillosamente en el gráfico. Es simplemente uno de esos indicadores sin los que los operadores de acciones de precios no pueden vivir. Mejora tu análisis técnico de la noche a la mañana Detecta patrones de velas japonesas fácilmente Comercio de patrones de inversión confiables y universales Salte a las tendencias establecidas de forma segura utilizando patrones de continuación El indicador no se repinta e implementa
"The Squeeze indicator attempts to identify periods of consolidation in a market. In general the market is either in a period of quiet consolidation or vertical price discovery. By identifying these calm periods, we have a better opportunity of getting into trades with the potential for larger moves. Once a market enters into a "squeeze," we watch the overall market momentum to help forecast the market direction and await a release of market energy." The Modified TTM Squeeze Indicator is a modi
Was: $249  Now: $99   Market Profile defines a number of day types that can help the trader to determine market behaviour. A key feature is the Value Area, representing the range of price action where 70% of trading took place. Understanding the Value Area can give traders valuable insight into market direction and establish the higher odds trade. It is an excellent addition to any system you may be using. Inspired by Jim Dalton’s book “Mind Over Markets”, this indicator is designed to suit the
El Indicador de Cuadrados de Gann es una herramienta poderosa de análisis de mercado basada en el artículo "Fórmula Matemática para Predicciones de Mercado" escrito por W.D. Gann, que se basa en conceptos matemáticos para el análisis. Incorpora elementos de las técnicas de Gann relacionadas con los cuadrados de 144, 90 y 52, así como el cuadrado de 9. Además, incluye el método del  sobre cómo combinar el cuadrado de 9 con canales y patrones de estrellas. Manual del Usuario y Modo de Uso: Antes d
Gartley Hunter Multi
Siarhei Vashchylka
5 (8)
Gartley Hunter Multi - An indicator for searching for harmonic patterns simultaneously on dozens of trading instruments and on all possible timeframes. Manual (Be sure to read before purchasing) | Version for MT4 Advantages 1. Patterns: Gartley, Butterfly, Shark, Crab. Bat, Alternate Bat, Deep Crab, Cypher 2. Simultaneous search for patterns on dozens of trading instruments and on all possible timeframes 3. Search for patterns of all possible sizes. From the smallest to the largest 4. A
Volume Profile MT5
Mihails Babuskins
5 (3)
Contact me after payment to send you the User-Manual PDF File. Volume Profile Indicator A functional and useful tool that can improve your trading plan. This indicator calculates volume in price levels(typical volume indicator shows only candle volumes). With the volume of price levels, you can identify important areas that have the potential to reverse. You can also see the volume of support and resistance levels and decide on them. Using volume profiles along with   Price Action   and  
Trend Forecaster
Alexey Minkov
5 (6)
The Trend Forecaster indicator utilizes a unique proprietary algorithm to determine entry points for a breakout trading strategy. The indicator identifies price clusters, analyzes price movement near levels, and provides a signal when the price breaks through a level. The Trend Forecaster indicator is suitable for all financial assets, including currencies (Forex), metals, stocks, indices, and cryptocurrencies. You can also adjust the indicator to work on any time frames, although it is recommen
Este indicador encuentra patrones de reversión doble superior y doble inferior, y genera señales de negociación mediante rupturas. [ Guía de instalación | Guía de actualización | Solución de problemas | FAQ | Todos los productos ] Señales comerciales claras Colores y tamaños personalizables. Implementa estadísticas de desempeño Niveles de retroceso de Fibonacci personalizables Muestra niveles adecuados de stop-loss y take-profit. Implementa alertas por correo electrónico / sonido / visuales
El patrón de copa y asa es una formación técnica de precios que se asemeja a una copa y un asa, donde la copa tiene la forma de una "U" y el asa tiene una ligera deriva hacia abajo. El lado derecho del patrón -el mango- es más pequeño que el lado izquierdo -cup-, y no retrocede más del 50% desde la parte superior. Puede ser tanto una continuación como un patrón de inversión. [ Guía de instalación | Guía de actualización | Solución de problemas | FAQ | Todos los productos ] Señales comerciales cl
AW Donchian Trend MT5
AW Trading Software Limited
5 (1)
AW Donchian Trend es un indicador de tendencia basado en el canal Donchian. El indicador puede calcular los niveles TakeProfit y StopLoss, tiene estadísticas avanzadas sobre el éxito de las señales, así como tres tipos de notificaciones sobre una señal recibida. Guía de instalación e instrucciones -   Aquí   / Versión MT4 -   Aquí Cómo operar con el indicador: Operar con AW Donchian Trend consta de sólo tres sencillos pasos: Paso 1: abrir una posición Recibimos una señal de compra con un índice
Currency Strength Meter is the easiest way to identify strong and weak currencies. This indicator shows the relative strength of 8 major currencies + Gold: AUD, CAD, CHF, EUR, GBP, JPY, NZD, USD, XAU. Gold symbol can be changed to other symbols like XAG, XAU etc. By default the strength value is normalised to the range from 0 to 100 for RSI algorithm: The value above 60 means strong currency; The value below 40 means weak currency; This indicator needs the history data of all 28 major currenc
Otros productos de este autor
Trend Screener Pro MT5
STE S.S.COMPANY
4.88 (66)
Desbloquee el poder del comercio de tendencias con el indicador Trend Screener: ¡su solución definitiva para el comercio de tendencias impulsada por lógica difusa y un sistema multidivisa!Mejore su comercio de tendencias con Trend Screener, el revolucionario indicador de tendencias impulsado por lógica difusa. Es un poderoso indicador de seguimiento de tendencias que combina más de 13 herramientas y funciones premium y 3 estrategias comerciales, lo que lo convierte en una opción versátil para co
Trend Screener
STE S.S.COMPANY
4.81 (88)
Indicador de tendencia, solución única e innovadora para el comercio y filtrado de tendencias con todas las funciones de tendencias importantes integradas en una sola herramienta. Es un indicador 100% sin repintar de marcos temporales y monedas múltiples que se puede usar en todos los símbolos/instrumentos: divisas, materias primas, criptomonedas, índices y acciones. OFERTA POR TIEMPO LIMITADO: El indicador de detección de soporte y resistencia está disponible por solo 50$ y de por vida. (Precio
Trend Line Map Pro MT5
STE S.S.COMPANY
4.09 (11)
El indicador Trend Line Map es un complemento para Trend Screener Indicator. Funciona como un escáner para todas las señales generadas por el evaluador de tendencias (Trend Line Signals). Es un escáner de líneas de tendencia basado en el indicador de evaluación de tendencias. Si no tiene el indicador Trend Screener Pro, Trend Line Map Pro no funcionará. It's a Trend Line Scanner based on Trend Screener Indicator. If you don't have Trend Screener Pro Indicator,     the Trend Line Map Pro will
Nuestros niveles de soporte o resistencia se forman cuando la acción del precio de un mercado se invierte y cambia de dirección, dejando atrás un pico o valle (punto de oscilación) en el mercado. Los niveles de soporte y resistencia pueden crear rangos de negociación. El indicador identifica el Swing High y Swing Low según la cantidad X de barras (Periodo) definidas en el conjunto de indicadores. Nota: si le gusta nuestro indicador de acción del precio, pruebe nuestro indicador de tendencia t
FREE
Support Resistance screnner
STE S.S.COMPANY
4.97 (35)
Support And Resistance Screener está en un indicador de nivel para MetaTrader que proporciona múltiples herramientas dentro de un indicador. Las herramientas disponibles son: 1. Cribador de estructura de mercado. 2. Zona de retroceso alcista. 3. Zona de retroceso bajista. 4. Puntos pivotes diarios 5. Puntos de pivote semanales 6. Puntos Pivotes mensuales 7. Fuerte soporte y resistencia basado en patrón armónico y volumen. 8. Zonas de nivel de banco. OFERTA POR TIEMPO LIMITADO: El indicador de so
El indicador Boom and Crash Spike Detector está codificado en base a una estrategia avanzada principalmente para detectar Boom and Crash en los precios. Se implantaron algoritmos complejos para detectar auges y caídas de alta probabilidad en los precios. Alerta sobre posibles fases de auge o choque: Fase de auge: cuando el precio aumenta demasiado rápido. Crash Phase: cuando el precio baja demasiado rápido. OFERTA POR TIEMPO LIMITADO: El indicador está disponible por solo 30 $ y de por vida. 
Trend Line Map Pro
STE S.S.COMPANY
4.47 (15)
El indicador Trend Line Map es un complemento para Trend Screener Indicator . Funciona como un escáner para todas las señales generadas por el evaluador de tendencias (Trend Line Signals). Es un escáner de líneas de tendencia basado en el indicador de evaluación de tendencias. Si no tiene el indicador Trend Screener Pro, Trend Line Map Pro no funcionará. Al acceder a nuestro blog MQL5, puede descargar la versión gratuita del indicador Trend Line Map. Pruébelo antes de comprar, sin las res
Todo comerciante sabe que él o ella nunca deben arriesgar más del 5% (o 7%) por operación. Esta es una ley de administración de dinero y se debe calcular un tamaño de lote utilizable cada vez porque un comerciante debe usar un valor StopLoss diferente para diferentes niveles de negociación. Este indicador calculará un tamaño de lote apropiado para el momento en que lo colocará en el gráfico y cada vez arrastrará la "Línea de stop loss" en cualquier dirección. OFERTA POR TIEMPO LIMITADO: Tod
El indicador Boom and Crash Spike Detector está codificado en base a una estrategia avanzada principalmente para detectar Boom and Crash en los precios. Se implantaron algoritmos complejos para detectar auges y caídas de alta probabilidad en los precios. Alerta sobre posibles fases de auge o choque: Fase de auge: cuando el precio aumenta demasiado rápido. Crash Phase: cuando el precio baja demasiado rápido. OFERTA POR TIEMPO LIMITADO: El indicador está disponible por solo 30$ y de por vida.  C
El rango diario promedio muestra el rango de pips promedio de un par de divisas medido durante un cierto número de períodos. Los comerciantes pueden usar el ADR para visualizar la acción potencial del precio fuera del movimiento diario promedio. Cuando el ADR está por encima del promedio, significa que la volatilidad diaria es más alta de lo habitual, lo que implica que el par de divisas puede extenderse más allá de su norma. Nuestro analizador ADR se compone de 5 características principales:
El analizador de volatilidad es un indicador de impulso, que aprovecha la tendencia del precio a romper con fuerza después de consolidarse en un rango de cotización ajustado. El indicador también usa un oscilador de impulso para mostrar la dirección esperada del movimiento cuando se dispara el apretón. Este histograma oscila alrededor de la línea cero, el aumento del impulso por encima de la línea cero indica una oportunidad de compra larga, mientras que el impulso que cae por debajo de la líne
El medidor de fuerza de la moneda le brinda una guía visual rápida sobre qué monedas son fuertes actualmente y cuáles son débiles. El medidor mide la fuerza de todos los pares cruzados de divisas y aplica cálculos sobre ellos para determinar la fuerza general de cada moneda individual. Calculamos en base a la fuerza de la moneda en función de la tendencia de 28 pares. Accediendo a nuestro Blog MQL5, puede descargar la versión gratuita del indicador. Pruébelo antes de comprar, sin las rest
Todo comerciante sabe que él o ella nunca deben arriesgar más del 5% (o 7%) por operación. Esta es una ley de administración de dinero y se debe calcular un tamaño de lote utilizable cada vez porque un comerciante debe usar un valor StopLoss diferente para diferentes niveles de negociación. Este indicador calculará un tamaño de lote apropiado para el momento en que lo colocará en el gráfico y cada vez arrastrará la "Línea de stop loss" en cualquier dirección. OFERTA POR TIEMPO LIMITADO: Tod
El medidor de fuerza de la moneda le brinda una guía visual rápida sobre qué monedas son fuertes actualmente y cuáles son débiles. El medidor mide la fuerza de todos los pares cruzados de divisas y aplica cálculos sobre ellos para determinar la fuerza general de cada moneda individual. Calculamos en base a la fuerza de la moneda en función de la tendencia de 28 pares. Accediendo a nuestro Blog MQL5, puede descargar la versión gratuita del indicador. Pruébelo antes de comprar, sin las rest
El rango diario promedio muestra el rango de pips promedio de un par de divisas medido durante un cierto número de períodos. Los comerciantes pueden usar el ADR para visualizar la acción potencial del precio fuera del movimiento diario promedio. Cuando el ADR está por encima del promedio, significa que la volatilidad diaria es más alta de lo habitual, lo que implica que el par de divisas puede extenderse más allá de su norma. Nuestro analizador ADR se compone de 5 características principales:
El analizador de volatilidad es un indicador de impulso, que aprovecha la tendencia del precio a romper con fuerza después de consolidarse en un rango de cotización ajustado. El indicador también usa un oscilador de impulso para mostrar la dirección esperada del movimiento cuando se dispara el apretón. Este histograma oscila alrededor de la línea cero, el aumento del impulso por encima de la línea cero indica una oportunidad de compra larga, mientras que el impulso que cae por debajo de la líne
Filtro:
Clinton Van
118
Clinton Van 2024.09.25 15:43 
 

I love both indicators Trend screener Pro and Support and Resistance Screener Pro but you can't use them blindly. You need to understand market structure. I always try to trade a strong currency versus a weaker one. I then trade with the trend after price makes corrections. The Support and resistance indicator helps see how close price is from support or resistance. On uptrend I buy at support levels and downtrend I buy at resistance levels of price corrections. Together these indicators is all you need to make informed decisions. I do my analysis on the 1H time Frame and then I enter my trades using the 1min or 5min time frames. Thanks for these indicators. They really safe me allot of time.

Dang Minh Tien
561
Dang Minh Tien 2024.02.08 08:01 
 

My indicator doesn't draw the S/R zone; it only shows text. Bank levels work fine. I think it's a minor bug because it looks like the indicator isn't compatible when you change your chart color scheme.

STE S.S.COMPANY
290148
Respuesta del desarrollador Sayadi Achraf 2024.02.09 11:54
Hi sir, Thank you for taking time to write your review. I'm sending you ASAP a private message to check the issue you're facing.
--- best regards.
SAYADI ashref.
dutchguy076
74
dutchguy076 2023.10.23 22:09 
 

El usuario no ha dejado ningún comentario para su valoración

STE S.S.COMPANY
290148
Respuesta del desarrollador Sayadi Achraf 2023.11.17 14:57
Dear sir, Thank you for taking time to write your review. We have just sent you an email to fix the issue that you're facing with u.
--- Please if you have any questions, feel free to contact me. Best regards.
SAYADI ashref.
Jerry Slagger
92
Jerry Slagger 2023.09.15 20:10 
 

This is one of the main indicators I use and I have been using it for 2 months now. The new version 13 is awesome. It allows all the levels to be displayed at the same time. So I can see that price is pushing a major or minor level, etc. These levels, along with the PullBack feature bring it all together so one can easily see the best entry / exit points. The HH LL Scanner is awesome as well. I use it to see if price is too high / low to enter, to make sure I am not entering after the move has already happened. Support is top notch and responsive.

STE S.S.COMPANY
290148
Respuesta del desarrollador Sayadi Achraf 2023.09.20 17:46
Thank you for taking the time to share your review, Mr. Jerry.
Wilfried Pelletier
160
Wilfried Pelletier 2023.08.30 17:37 
 

El usuario no ha dejado ningún comentario para su valoración

STE S.S.COMPANY
290148
Respuesta del desarrollador Sayadi Achraf 2023.08.30 17:39
Thank you for your review, we are happy to know that you liked our indicator. Any questions, please feel free to contact us.
Dunstan Wafula Namusonge
851
Dunstan Wafula Namusonge 2023.06.09 19:26 
 

The reason why I like this forex indicator so much is because it is easy to use. The indicator accurately gives me both price action and technical analysis at the same time. The multi-functional features make this a unique product. Alerts are accurate with precise signals. The author is very responsive and available. I strongly recommend this indicator.Trust me when I say that this will be your go to indicator once you try it.

STE S.S.COMPANY
290148
Respuesta del desarrollador Sayadi Achraf 2023.09.20 17:46
Thank you for taking time to share your review MR. Wafula.
Олег Похилько
160
Олег Похилько 2023.04.06 16:48 
 

Good indicator, but Sayadi just the best!

Andres.Morelo
129
Andres.Morelo 2023.01.26 10:33 
 

excellent indicator, I like me very much. It complements my trading plan very well and customer service is exceptional, too good for price. I recommend 100% I give you five stars

Agbakeleke Idowu
556
Agbakeleke Idowu 2023.01.21 22:37 
 

Very Worst Indicator in mql5 market. You will do yourself a great disadvantage buying it. Don't be deceived by the fake comments you saw here. It is a total waste of money. Wasted my hard earned $50 on this Garbage of a Thing. I once added a review but this Big man Liar has deleted it. The Creator did a very lazy Job on this indicator, and I consider it a big theft taking $50 for this nonesense indicator.

Deleting my Review on this indicator means this is a scam indicator. Nonesense

A BAD SELLER. DON'T EVER BUY FROM HIM. FAKE REVIEWS EVERYWHERE

STE S.S.COMPANY
290148
Respuesta del desarrollador Sayadi Achraf 2023.06.06 00:17
Hello Mr. Idowu, Thank you for taking the time to share your feedback with us. I must say, I was taken aback by your review. As sellers, we do not have the capability to remove customer reviews and we always value constructive criticism as it helps us improve our services. However, it seemed from your review that you may have had a misunderstanding about our indicator/service. We have been selling on the MQL5 market since 2020 and our primary goal has always been to provide the best possible service to our customers. Any suggestions that we have engaged in dishonest activities are deeply unsettling and contrary to our principles. We believe in transparency and honest communication with our customers. Thank you once again for your feedback, and we wish you a safe and prosperous trading journey. Best regards,
SAYADI Ashref
26 Trades, LLC
370
JASON ALAN MYERS 2022.12.03 16:45 
 

Awesome indicator! I use the Pullback Zones on higher timeframes, set and wait for alert, then go to lower timeframe and wait for alert to enter trade. Also, there is no repaint on this indicator. Most indicators have great signals until you realize they have repainted, but not this indicator. Support is always prompt and helpful.

STE S.S.COMPANY
290148
Respuesta del desarrollador Sayadi Achraf 2023.03.23 10:29
Thank you for your review, Mr. Jason.
25170142
144
25170142 2022.10.24 13:55 
 

Very good indicator, I use the pullback function in combination with indices and trade the pullbacks. That works great. Also the support is very good always quick response to questions.

STE S.S.COMPANY
290148
Respuesta del desarrollador Sayadi Achraf 2023.03.23 10:28
Thank you for your review sir.
Long Zhang
63
Long Zhang 2022.08.25 07:56 
 

你好,可能因为防火墙的原因看不到视频,您可以将视频发到我的邮箱吗

STE S.S.COMPANY
290148
Respuesta del desarrollador Sayadi Achraf 2022.08.25 18:05
Dear sir, Thank you for taking time to write your review. I'm sending you now the request video via PM. Best regards.
SAYADI Ashref.
SparksyB
102
SparksyB 2022.08.20 23:11 
 

Amazing indicator with pivot points features !

GoldHulk
955
GoldHulk 2022.03.26 02:49 
 

I got that SR Indicator for MT4+5 and observe it now for quite some time (4 months +)

- I have to say it still impresses me of how good these SR Zones are.

There are many SR/SnD Indicators, some of them are pretty good (I also like Blahtech Supply and Demand very much), but this SR Indicator here just masters an incredible difficult part (especially for coding this)

>> It only gives you the IMPORTANT SR Zones on your screen and doesnt clutter your whole screen til its useless.

Also I like the Settings very much on this indicator, they are smart trimmed down to the necessary but still versatile enough for adjustments (very good in not to overwhelm you with a shitload of settings like many others do)

In short: If you have a good foundation in basic trading skills/knowledge, then this Indicator here is an amazing tool

(for me: it helps me to get more structured in my own trading approach - without this indicator I tend to be all over the charts, have difficulties to prioritize - so its a great help to overcome my weaknesses)

PS: @Sayadi Achraf, not sure if thats possible, but if you can manage to make this working in similar quality on major crypto assests as well, then this would be amazing :)

STE S.S.COMPANY
290148
Respuesta del desarrollador Sayadi Achraf 2022.03.26 14:47
Hi sir, Thank you for your review and I'm to know that you liked our indicator. I sent crypto request to my technical team and we will for this crypto feature in our next upgrade. Best regards.
SAYADI Ashref.
33225272
159
33225272 2022.02.05 18:14 
 

THE BEST TOOL EVER...

KUSPRAPTONO
35
KUSPRAPTONO 2022.01.13 09:26 
 

El usuario no ha dejado ningún comentario para su valoración

STE S.S.COMPANY
290148
Respuesta del desarrollador Sayadi Achraf 2022.01.13 14:01
Hi sir,ù Thank you for your message. This section for reviews only and for the request of support, you need to use the comment section, sir.
As i see that you bought the indicator since 3 hours ago, please don't worry we will give you all the necessary support to install the indicator properly in your Metatrader sir. We are sending you now a PM to check what issue you're facing to solve it with you. About exchange of product from MT5 to MT4, that's not possible sir. Best regards.
SAYADI Ashref.
peace55
45
peace55 2021.06.14 02:19 
 

I bought your product on Support and Resistance Pro... Please what timeframe works perfectly for it. Secondly, I wanted to get your order product the Currency strength meter but isn't in market place anymore

STE S.S.COMPANY
290148
Respuesta del desarrollador Sayadi Achraf 2022.01.14 09:44
Hi sir. Thank you for choosing our products. This section for reviews only and for the request of support, you need to use the comment section, sir. The best timeframe is H1 and H4 sir. We published again the Currency Strength Meter for MT5, we are removed for upgrade, sir. You can find in our seller profile. Please if you have any questions, feel free to contact me sir.
DrSB
101
DrSB 2021.06.01 18:52 
 

One word : Perfect.

STE S.S.COMPANY
290148
Respuesta del desarrollador Sayadi Achraf 2021.06.14 12:40
Thank you for your review sir.
Adelheid Mauler
825
Adelheid Mauler 2021.04.25 09:29 
 

Ich habe das Produkt gekauft aber leider funktioniert das Produkt nicht wie beschrieben. Ich habe den Metatrader 5 und ein Konto bei GKFX. Nach einer Kontaktaufnahme mit Herrn Sayadi Achraf konnte das Problem gelöst werden. Herr Sayadi Achraf hat sich sofort bemüht dass allesfunktioniert.Kann das Produkt sehr empfehlen. Alles Bestens!!!!

STE S.S.COMPANY
290148
Respuesta del desarrollador Sayadi Achraf 2021.04.28 11:43
Hi sir. Thank you for taking the time to write your review. Have a good and safe trading sir.
zbairen985
440
zbairen985 2021.04.05 11:30 
 

这个 MT5 指标加载后为什么支撑线(Support line) 与阻力线(Resistance line)的宽度(Width)不能自定义修改呢?希望作者把这个问题改进一下哦。另外,那个文字面板实在没有什么用处,只会使图表窗口显的更加凌乱,完全可以用不同的支撑线与阻力线的颜色来加以区分就可以。

STE S.S.COMPANY
290148
Respuesta del desarrollador Sayadi Achraf 2021.04.08 18:47
Thank you for your review sir and for choosing products. Note : 1. When you put the indicator first, you need to have already the OHLC data available ( Historical data ) in order that you can run the indicator smoothly sir. Best regards.
SAYADI Ashref.
12
Respuesta al comentario
Versión 13.20 2023.12.13
1. Fixed email alert issue with the last metatrader version.
Versión 13.0 2023.09.15
1. Add options to enable-disable every feature
Versión 12.0 2023.06.05
1. Optimize Pullback zones to include markets ( Deriv pairs )
2. Enable 3 types of Pivots points.
3. Optimize Bank level zones.
Versión 11.1 2023.02.03
1. Combine Breakout/Pullback Zones to provide one zone with arrows.
Versión 10.12 2023.01.23
1. Fixing speeling mistakes in the text of the alerts.
Versión 10.10 2023.01.23
1. Fixing alert issue with In Buyers and Sellers Zones. ( PullBack - Breakout Zones Alerts )
2. Optimizing Buyers and Sellers backtesting speed.
Versión 10.0 2023.01.18
1. Change Pullback Zones logic.
2. Add Breakout zones.
3. Remove the Bank level feature.
Versión 9.30 2023.01.13
1. Improve the PullBack zone algorithm to wait for the bar to close to confirm the zone.
Versión 9.2 2022.11.24
1. Add a Central line for Bank levels.
2. Optimizing and improving the Strong Support and Resistance zones Algorithm.
Versión 9.1 2022.08.08
1. Fixing changing mode issues and cleaning old zones
Versión 9.0 2022.08.07
1. Optimizing Pullback feature algorithm.
2. Add an option to keep old pullback zones.
Versión 8.50 2022.05.30
1. Add a new feature: Bank Levels.
2. Add Alerts to the Price Action Screener.
Versión 8.40 2022.02.08
1. Add Line Width for Pivots lines.
Versión 8.30 2022.02.03
1. Add support for US30 via sensitivity parameter.
Versión 8.21 2021.12.24
1. Optimizing Indicator code and speed performance.
2. Add Pivots points levels.
Versión 8.20 2021.10.06
1. Optimizing indicator algorithm.
Versión 8.10 2021.05.09
1. Increase indicator speed.
Versión 8.0 2021.04.27
- Fixing issue of pairs navigator with GKFX Broker.
Versión 7.50 2020.12.03
1. Algorithm optimization.
Versión 7.20 2020.11.29
1. Fixing refreshing issue.