• 미리보기
  • 리뷰 (2)
  • 코멘트
  • 새 소식

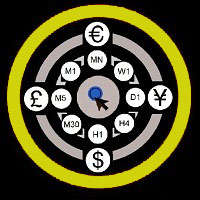
Directional Key To Change Symbols and TimeFrames

Do you think it's a bit cumbersome when you need to switch symbols or timeframes with mouse click?

1. What is this?

This is a program that can switch symbols and timeframes with direction keys.

  • Fast switching, very convenient, no mouse click required.
  • For traders, one symbol with multi-timeframe charts are usually added,  you can change symbol on those charts easily.
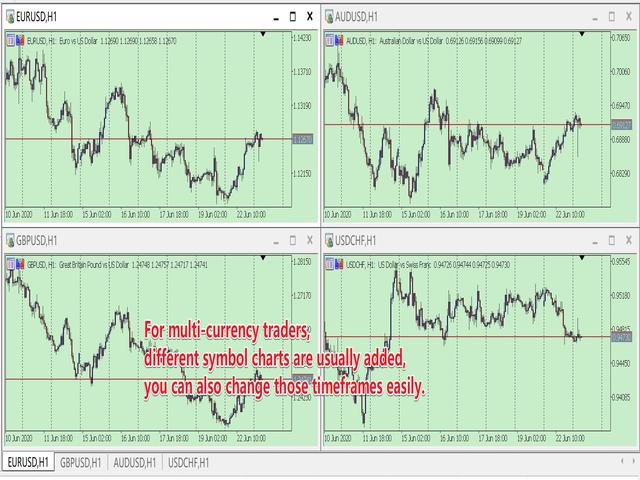
  • For multi-currency traders, different symbol charts are usually added, you can also change those timeframes easily.

I wrote this program in the form of indicator. So you can load other EAs, indicators or run other scripts.

2. How to use it

When you load the program:

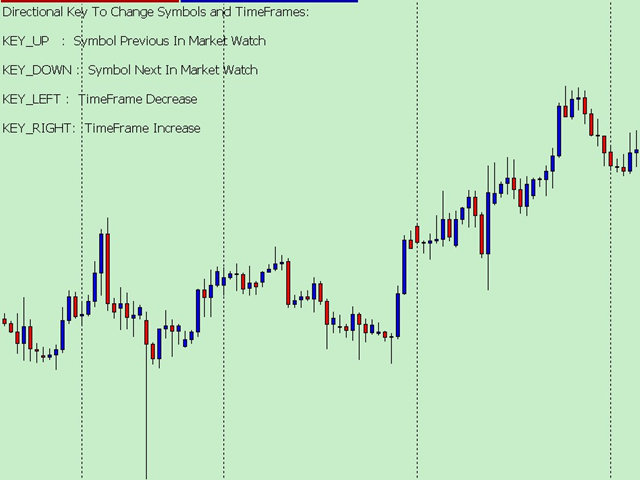
  • The direction key UP is to switch to the previous symbol in market watch.
    • PS:  When the chart is the first symbol, Key UP will switch to the last symbol.
  • The direction key DOWN is to switch to the next symbol in market watch.
    • PS:  When the chart is the last symbol, Key DOWN will switch to the first symbol.
  • The direction key LEFT is to decrease the timeframes.
    • PS:  When the timeframe is M1, Key LEFT will switch to the MN1 timeframe.
  • The direction key RIGHT is the increase time frame.
    • PS:  When the timeframe is MN1, Key RIGHT will switch to the M1 timeframe.

3. Parameters:

  • bool TurnOn_UpDown=true;    // Turn on the UP/DOWN key function to change Symbol.
  • bool TurnOn_LeftRight=true;  // Turn on the LEFT/RIGHT key function to change TimeFrame.
  • bool AllTimeFrames=false;     // Whether to use All Time Frames

=====The following options are used to change other open charts:

PS: I must tell you, when switching between multi charts, the system will download the data, If your system doesn't have data, it will download the data and sometime will cause slowdowns. That is the limited of MT5/MT4 client. When you don't have enough data, don't use the keyboard too quickly.

  • bool OtherOpenChart_Symbol = false;    // Change symbol on other open chart?
  • bool OtherOpenChart_TimeFrame = false;  // Change timeframe on other open chart?
  • int PermitCount = 0; // Just change the count of initially opened chart. 0 means all.
    • PS: when you want to change other charts, but not all the open charts. you can change the num.


추천 제품
Orion Telegram Notifier Bot  allows the trader to receive trade notifications in his Telegram whenever a position is opened or closed. The EA sends notifications showing the Symbol, Magic Number, Direction, Lot (Volume), Entry Price, Exit Price, Take Profit, Stop-Loss and Profit of the position. How to setup Orion Telegram Notifier? Open Telegram and Search for “BotFather” Click or Type “/newbot” Create a nickname and username (Example: nickname: MT5trades   - username: MT5TelegramBot) *The us
RenkoChart EA
Paulo Henrique Da Silva
4.33 (3)
The RenkoChart tool presents an innovative and highly flexible approach to visualizing market data in MetaTrader 5. This expert creates a custom symbol with Renko bricks directly on the chart, displaying accurate prices at the respective opening date/time for each brick. This feature makes it possible to apply any indicator to the Renko chart. Furthermore, this tool also allows access to historical brick data through native methods in the MQL5 programming language, such as iOpen, iHigh, iLow and
FREE
Account Informer MT5
Ismail Hakki Delibas
5 (2)
Account Informer Utility Helps you :     Stay in Touch With Your Account.     Hear About Your Account Critical Conditions.     Check Your Account Connectivity.     Inform from any Position Change.     When All Orders Closed     Receive Notifications as Android or IOS Notifications on Your Phone, Email or Popup Window. Information can send in these conditions according to your selection :     Constant Time Period     When Drawdown Larger than Specified Value     When Margin Level Sm
This is a support tool that will notify you when the price crosses a trend line, you can draw any trend line by manual, and you can change or drag it on chart in working time This tool will automatically update the new location of the trend line to alert you How to use: after added it on chart, you will draw a trend line and set name of the trend line same as in input of the tool (the parameter LineName ) There are 3 notification methods : Pop Up Alert, Send Email or Notification You can choose
Enhance your price action strategy: inside bar breakouts at your fingertips This indicator detects inside bars of several ranges, making it very easy for price action traders to spot and act on inside bar breakouts. [ Installation Guide | Update Guide | Troubleshooting | FAQ | All Products ] Easy to use and understand Customizable color selections The indicator implements visual/mail/push/sound alerts The indicator does not repaint or backpaint An inside bar is a bar or series of bars which is/
Super ATR
Lina Staseliene
Super ATR is a powerful tool for analyzing the ATR (Average True Range) levels. The intuitive interface allows you to easily monitor all the main ranges of volatility. Key Features Plots the daily АТR areas on the chart. Plots the weekly АТR areas on the chart. Plots the monthly АТR areas on the chart. Displays a panel with the current values of the main volatility ranges (M5,H1,D1,W1,MN) on the chart. The areas and values in the table change their color when the ATR level is reached. Draws th
BeST Swing Strategy MT5 is a Metatrader indicator based on the corresponding Jim Berg's work about volatility as described in his article "The Truth About Volatitlity" (TASC 2/2005).The indicator consists of 2 channel lines deriving as (MA+/- times the ATR) and can be used as a standalone trading system.The outlier prices of the Market as of the indicator's values can be used for producing Entry and Exit Signals. Advantages of the indicator == Uses 2 Swing Strategies == Never repaints it
Have you ever take a long time to watch a Symbol when the network link is not good ? Have you ever wait for a long time when you switch chart between different Symbols or different TimeFrames ? If you do long-term backtesting , Have you ever to be downloaded datas for a long time ? Yes, If there is no data in the system, those will happen.  1. What is this: Download all the Symbol data in Market Watch to the system. PS: This is not outputting data to Files. This Link go to Demo version: https:
TradingX Hotkeys
Johannes Stephanus Lombard
Inputs Available Lotsizes Partial Close % You can change lotsizes as you require On an open chart click once to select chart to be able to use hotkeys on specific chart. All Pairs can be used with this expert We created this expert to be able to still trade C300 with a 0.06 Lotsize If you enter a 0.6 lot and close 0.90% you can trade with 0.06 Lot Keys to be used: B -Buy S -Sell C -Close Profitable D -Breakeven (Note if stoploss is set it won't break even) P -Partial close
AutoCloseTimer allows you to close positions and delete pending orders at a specified time. Usage Download and drag and drop AutoCloseTimer onto the chart. Check Allow AutoTrading in Common tab. Set parameters in Inputs tab. Notice: The close time must be later than the current market time. Input Parameters CloseSymbol - there are 2 options SymBol Of Chart - just close the symbol of the current chart All Symbols - close all symbols CloseTimerDay - specify a day for AutoCloseTimer. The defau
Rectangle line Trade Execution Assistant Rectangle Line Trade Assistant EA  Semi-Automated Trading Assistant       IMPORTANT :   On the main/purchased program a user can click on the Rectangle line and move/ drag it around the chart, by double clicking on it. Please keep in mind that this option is not available on demo version, due to some restrictions/limitations of Strategy Tester, some Object related operations are not available in the Strategy Tester. But, it will not prevent you from Test
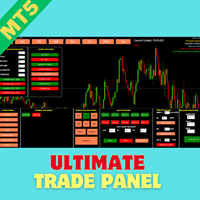
Introducing the Ultimate Trade Panel MT5 - Your All-in-One Trade Manager for MQL5 Trading Are you a trader looking to streamline your trading activities and gain a competitive edge in the market? Look no further! The Ultimate Trade Panel MT5 is here to revolutionize your trading experience on the MQL5 platform. With a plethora of unique and time-saving features, this expert advisor is designed to be your reliable companion for day-to-day trading activities. Key Features: Indicator Manager: Say g
안녕하세요 친구 사람들의 눈에는 투자가 어렵고 위험한 사업으로 여겨집니다. 그러나 지식과 기술을 습득하여 투자한다면 시장은 결코 당신에게 해를 끼치지 않을 것입니다. 자본 시장에서 필터 라이팅은 전문가들이 생산성을 높이고 시간을 절약하기 위해 이 분야에서 취하는 조치 중 하나입니다. 많은 수의 기호 활동으로 인해 저장된 정보 및 데이터의 양이 매우 높습니다. 이 시장에서 활동하는 사람들은 때때로 일련의 정보가 필요하며 문제의 민감성으로 인해 가능한 한 빨리 정보를 얻어야 합니다. 이 정보는 일반적으로 시장의 미래를 예측하는 데 도움이 되며 매우 중요합니다. Fitler가 우리의 명령으로 작성하면 요청한 조건에 맞는 공유를 찾아줄 것입니다! 선택한 기능을 필터링하면 거래 가능한 모든 주식을 검색하고 적합한 주식을 표시합니다. 자본시장의 각 개인은 거래에 대한 구체적인 전략을 가지고 있으며 필터링을 통해 전략에 따라 진행하기 쉽습니다. 그 후, 그는 다양한 시간대에 걸쳐 자신의
이 도구를 사용하면 한 번의 클릭으로 열려 있는 모든 주문을 닫을 수 있습니다. "모두 닫기"를 클릭하기만 하면 됩니다. 수익성 있는 주문만 청산하려면 "수익성 있는 청산" 버튼을 클릭하세요. 클릭한 후 모든 변동 주문이 청산됩니다. 변동 손실이 있는 주문만 종료하려면 "손실 가능 청산" 버튼을 클릭하세요. 클릭한 후 변동 손실이 있는 모든 주문이 종료됩니다. 이 도구는 1년 동안 테스트를 거쳤으며 원클릭 포지션 청산 기능이 매우 완벽합니다. 포지션 청산은 적시에 이루어지며 지연 범위는 작습니다. 물론 지연은 귀하가 속한 지역 및 네트워크 환경과도 관련이 있습니다. 이에 주의하시기 바랍니다. 과거 데이터의 백테스트 과정에서 도구는 더욱 완벽하게 작동했으며 100개의 주문을 모두 마감하는 데 최대 0.495초밖에 걸리지 않았습니다. 실제 거래 과정에서 나의 최대 포지션 주문 수는 26개에 불과했고, 모든 포지션이 청산되는 데 걸리는 시간은 1.28초였습니다.
HAshi-E is an enhanced way to analyze Heiken-Ashi signals. Briefing: Heiken-Ashi is particularly valued for its ability to filter out short-term volatility, making it a preferred tool for identifying and following trends, helps in decision-making regarding entry and exit points, and assists in distinguishing between false signals and genuine trend reversals. Unlike traditional candlestick charts, Heiken-Ashi candles are calculated using average values of previous bars, creating a smoother,
SyncGraph Plus
PATRICK ANTONIO MORELO A.
Indicator that synchronizes the charts, that is, when the asset is replaced in one of the charts, all those that appear with the synchronized indicator are changed, with the same timeframe (Same_Timeframe = true) or with different timeframes (Same_Timeframe = false). The graphics to be synchronized are identified by color (Label). To synchronize the indicators, the indicator must be inserted in all charts to be synchronized, using the same color (Label). A box with the chosen color (Label) and
MT5 To Notion
Levi Dane Benjamin
5 (2)
이 프로그램을 사용하면 메타 트레이더 계정에서 모든 거래를 매우 친숙한 사용자 인터페이스를 통해 직접 노션으로 내보낼 수 있습니다. MT4 버전  |  사용자 가이드 + 데모 시작하려면 사용자 가이드를 사용하고 노션 템플릿을 다운로드하십시오. 데모를 원하는 경우 사용자 가이드로 이동하십시오. 전략 테스터에서 작동하지 않습니다! 주요 기능 거래 계정에서 모든 거래를 노션에 내보내기 진행 중인 거래 및 대기 중인 주문을 노션에 내보내고 업데이트하기 템플릿 생성 전일부터의 거래 내보내기 지난 주부터의 거래 내보내기 지난 달부터의 거래 내보내기 사용자 정의 시간 범위에서 거래 내보내기 모든 새로운 종료된 거래를 자동으로 노션에 보내기 주문 유형, 거래량, 시작 시간, 종료 시간 등을 포함하여 내보낼 필드 선택 시작하는 방법 위의 사용자 가이드로 이동하거나 EA를 시작하고 '연결 도움말 받기'를 클릭하십시오. 연결된 후에는 '시작: 모두 내보내기'를 클릭하여 현재 모든 거래를 내력에서
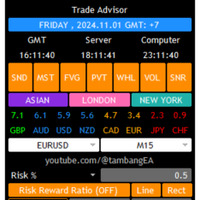
Trade Advisor :   차트 마스터링 전문 트레이더를 위한 궁극의 전문가 자문(EA) 어시스턴트 버전 MT4 버전 | MT5 버전 | 블로그 v.3.0 - Telegram Bot 통합 참고: MT4 버전은 MT5 버전보다 가볍습니다. Trade Advisor: 차트 마스터링 Trade Advisor는 주요 시장 분석 도구와 트레이더를 위한 원활한 기능을 통합하여 트레이딩 전략을 강화하도록 설계된 고급 트레이딩 어시스턴트입니다. Trade Advisor가 트레이더에게 강력한 자산인 이유에 대한 개요는 다음과 같습니다. 주요 기능 및 장점 1. 공급 및 수요 구역: Trade Advisor는 사용자가 중요한 공급 및 수요 구역을 식별하여 시장에서 보다 전략적인 진입 및 종료 지점을 보장하도록 돕습니다. 2. 시장 구조 분석: 이 기능을 통해 트레이더는 시장 추세와 구조를 더 잘 이해하고 강세, 약세 및 통합 단계를 명확하게 식별할 수 있습니다. 3
Title: Advanced Trend Lines   Supports and Resistances Levels Overview: Enhance your trading decisions with this powerful Trend Lines Supports and Resistances Levels Indicator . This tool identifies key market structures such as trend lines, pivot points, and support/resistance zones, providing traders with actionable insights to spot potential breakout or reversal opportunities. Tailored for technical analysts, this indicator offers customizability and real-time alerts to match any trading st
N-second K-line chart, customizable, monitoring multiple seconds of multiple symbols simultaneously, all Chinese parameters, easy to use -------------------------------------------------------------------------------------------------------------- You can ask me any questions in private messages https://www.mql5.com/en/users/chaoping0326 Customization of indicators and EA for MT4 and MT5 is available Long term programming project (MT4 from 2012, MT5 from 2016). Good programming skills, reasonabl
Click and Go Trade Manager, the ultimate solution for seamless trading execution. With a simple click on the chart, you can effortlessly define your stop loss, entry price, and target levels. No more hassle of inputting values manually - it's made incredibly intuitive and easy. Embedded risk management is a key feature of our Trade Manager. We understand the importance of protecting your investments, which is why the Click and Go Trade Manager incorporates risk management. When placing orders, y
This utility can compare simultaneously time frames of different instruments and keep under control   the nine major time frames  of an instrument. It is composed by two changers, a crosshair and some additional components : the  multicharts time frames changer   is designed to  compare  simultaneously  up to thirty time frames  of different symbols with the  keyboard or the button the multicharts symbols changer can  link up to nine charts and control simultaneously the nine major time frame b
TradePulse Commander Pannel
AL MOOSAWI ABDULLAH JAFFER BAQER
궁극의 **거래 관리 패널**을 소개합니다. 이 패널은 거래 작업을 간소화하고 효율성을 높이기 위해 설계되었습니다! 우리의 고급 패널은 강력한 기능을 갖추고 있어 거래 작업을 쉽게 관리하고 실시간 통찰력을 제공합니다: - **원클릭 TP 및 SL 관리**: 전체 계정 또는 특정 통화 쌍의 모든 Take Profit (TP) 및 Stop Loss (SL) 레벨을 버튼 하나로 쉽게 삭제할 수 있습니다. - **실시간 주문 추적**: 전체 계정과 개별 통화 쌍에 대한 총 주문 수, 매수/매도 수량, 및 수익/손실을 실시간으로 보여주는 업데이트로 거래 활동을 정확히 파악할 수 있습니다. - **수익 및 손실 최적화**: 전체 계정 또는 선택한 통화 쌍에서 모든 수익성 있는 또는 손실이 발생한 주문을 신속하게 종료하여 시장 변화에 빠르게 대응할 수 있습니다. - **자동 헤징**: 손실이 지정된 비율에 도달하면 자동 헤징을 설정할 수 있습니다. 패널은 SL 및 TP 삭제를 자
"Support or Resistance Alert Broken" is a simple and very intuitive tool that allows you to create or eliminate horizontal and trend supports and / or resistances with a simple click. When the support or resistance line is broken by the closing price at the end of the current candle, the "Support or Resistance Alert Broken" tool will send an alert with sound, as well as a notification to the MT4 or MT5 mobile application. This tool can send alerts from multiple pairs at the same time. Utili
PivotePoint MT5
Kambiz Shahriarynasab
Unlike many other indicators including the moving average indicator, Pivot Point can be a leading indicator. In these systems, the price levels of the previous period are used to determine the critical points instead of relying on the current price performance. Such an approach provides a clear framework for traders to plan their trades in the best possible way. You can use this method and its combination with the methods you want to build and use a powerful trading setup. MT4 version Let us k
PLEASE CONTACT ME BEFORE PURCHASE FOR DISCOUNT UP TO 50% Key Features: Full Range Breakout Strategy: The EA continuously monitors price movements and identifies breakout points based on predefined high and low ranges. When the price moves beyond these levels, the EA automatically opens trades, positioning itself to take advantage of potential price trends. Trailing Stop Loss: To enhance risk management and protect profits, the EA includes a trailing stop loss feature. This functionality allow
Spread Eliminator
Wouter Dries Bijnens
I'm proudly introducing "Spread Eliminator" - Your Ultimate Solution against High Spreads in Forex Trading! Are you tired of hitting Stop Losses or having pending orders triggered at a bad price due to high spreads while trading? All this is now over with our revolutionary EA , Spread Eliminator! Can be used on Prop Firms that enforce high overnight spreads and/or high spreads during high volatile market conditions. Key Features: Smart Spread Monitoring: Spread Eliminator constantly monitors mar
Script for quick updates (synchronization) up-to-date data in the SQLite database. Saves open positions and orders, current quotes. Take advantage of SQLite's capabilities for intermediate data storage, analytics, and integrations of the MetaTrader platform. Keep all your data in one place. Use the saved data in SQL analytical queries, from Python and other languages, to build dashboards Parameters useDefaults true - use default parameters. Save data to the COMMON hierarchy, to the db/ram
FREE
MQL Tool "Ofir Email to Telegram": Never Miss a Trading Alert Again! Tired of missing important alerts from your indicators and Expert Advisors (EAs)? Ofir Email to Telegram is the solution you've been waiting for! This revolutionary MQL tool automatically forwards all email alerts from your indicators and EAs directly to your Telegram account. Never again will you miss a trading opportunity or important notification! Here are just a few of the benefits of Ofir Email to Telegram: Quick and easy
The analyzer makes it possible to quickly assess spread changes on historical data,   the magnitude and frequency of bursts, the dynamics and nature of the extensions by the days of the week, etc. The analyzer needs to be started in the tester (visualization mode) on the symbol and time interval required for analysis,   recommended TimeFrame H1, select "Every tick based on real ticks" mode.
이 제품의 구매자들이 또한 구매함
Trade Assistant MT5
Evgeniy Kravchenko
4.39 (168)
거래당 위험 계산, 라인을 사용한 손쉬운 신규 주문, 부분 청산 기능을 통한 주문 관리, 7가지 유형의 트레일링 스탑 및 기타 유용한 기능을 제공합니다. 주의, 응용 프로그램은 전략 테스터에서 작동하지 않습니다. 설명 페이지에서 데모 버전을 다운로드할 수 있습니다.  Manual, Description, Download demo 라인 기능       - 차트에 개시선, 손절매, 차익실현을 표시합니다. 이 기능을 사용하면 새로운 주문을 쉽게 하고 개봉 전에 추가 특성을 볼 수 있습니다. 위기 관리       -       위험 계산 기능은 설정된 위험과 손절매 주문의 크기를 고려하여 새 주문의 볼륨을 계산합니다. 이를 통해 손절매 크기를 설정하고 동시에 설정된 위험을 존중할 수 있습니다. 로트 계산 버튼 - 위험 계산을 활성화/비활성화합니다. 필요한 위험 값은 위험 필드에 0에서 100 사이의 백분율 또는 예금 통화로 설정됩니다. 설정 탭에서 위험 계산 옵션을 선택합니다.
Trade Manager EA에 오신 것을 환영합니다. 이 도구는 거래를 보다 직관적이고 정확하며 효율적으로 만들기 위해 설계된 궁극적인 리스크 관리 도구 입니다. 단순한 주문 실행 도구가 아닌, 원활한 거래 계획, 포지션 관리 및 리스크 제어를 위한 종합 솔루션입니다. 초보자부터 고급 트레이더, 빠른 실행이 필요한 스캘퍼에 이르기까지 Trade Manager EA는 외환, 지수, 상품, 암호화폐 등 다양한 시장에서 유연성을 제공합니다. Trade Manager EA를 사용하면 복잡한 계산은 이제 과거의 일이 됩니다. 시장을 분석하고 진입, 손절 및 익절 수준을 차트의 수평선으로 표시한 후 리스크를 설정하면, Trade Manager가 이상적인 포지션 크기를 즉시 계산하고 SL 및 TP 값을 실시간으로 표시합니다. 모든 거래가 간편하게 관리됩니다. 주요 기능: 포지션 크기 계산기 : 정의된 리스크에 따라 거래 크기를 즉시 결정합니다. 간단한 거래 계획 : 진입, 손절, 익절을 위한
TradePanel MT5
Alfiya Fazylova
4.85 (119)
Trade Panel은 다기능 거래 보조원입니다. 이 애플리케이션에는 수동 거래를 위한 50개 이상의 거래 기능이 포함되어 있으며 대부분의 거래 작업을 자동화할 수 있습니다. 전략 테스터에서는 애플리케이션이 작동하지 않습니다. 구매하기 전에 데모 계정에서 데모 버전을 테스트할 수 있습니다. 데모 버전 여기 . 전체 지침 여기 . 거래. 한 번의 클릭으로 거래 작업을 수행할 수 있습니다: 자동 위험 계산을 통해 지정가 주문 및 포지션을 엽니다. 한 번의 클릭으로 여러 주문과 포지션을 열 수 있습니다. 주문 그리드를 엽니다. 그룹별 대기 주문 및 포지션을 마감합니다. 포지션 반전(매수 청산 후 매도 개시 또는 매도 청산 후 매수 개시). 포지션 고정(매수 포지션과 매도 포지션의 양을 동일하게 하는 추가 포지션 개설). 한 번의 클릭으로 모든 포지션을 부분 청산합니다. 모든 포지션의 이익실현과 손절매를 동일한 가격 수준으로 설정합니다. 모든 포지션에 대한 손절매를 해당 포지션의 손익 분기
The product will copy all telegram signal to MT5 ( which you are member) , also it can work as remote copier.  Merry Christmas and Happy New Year Price 169$ until Jan 05 2025 Easy to set up, copy order instant, can work with almost signal formats, image signal,  s upport to translate other language to English Work with all type of channel or group, even channel have "Restrict Saving Content", work with  multi channel, multi MT5 Work as remote copier: with signal have ticket number, it will co
Trade Manager DashPlus
Apex Software Ltd
5 (4)
DashPlus 는 MetaTrader 5 플랫폼에서 거래 효율성과 효과를 향상시키기 위해 설계된 고급 거래 관리 도구입니다. 리스크 계산, 주문 관리, 고급 그리드 시스템, 차트 기반 도구 및 성과 분석 등 포괄적인 기능을 제공합니다. 주요 기능 1. 리커버리 그리드 불리한 시장 상황에서 거래를 관리하기 위한 평균화 및 유연한 그리드 시스템을 구현합니다. 거래 회복을 최적화할 수 있도록 전략적인 진입 및 종료 포인트를 제공합니다. 2. 스택 그리드 강한 시장 움직임 동안 포지션을 추가하여 유리한 거래에서 잠재적 수익을 극대화하도록 설계되었습니다. 유리한 시장 트렌드에서 승률을 높이며 거래를 확장할 수 있도록 합니다. 3. 손익(P&L) 라인 차트에서 잠재적인 수익 및 손실 시나리오를 시각적으로 표현합니다. 설정을 조정하고 P&L 라인을 드래그하여 실행 전에 다양한 거래 결과를 평가할 수 있습니다. 4. 바스켓 모드 동일한 심볼에 여러 포지션을 단일 집계 포지션으로 결합하여 관리합니
Local Trade Copier EA MT5
Juvenille Emperor Limited
4.99 (76)
Local Trade Copier EA MT5 를 사용하여 매우 빠른 거래 복사 경험을 해보세요. 1분 안에 간편하게 설정할 수 있으며, 이 거래 복사기를 사용하면 Windows 컴퓨터 또는 Windows VPS에서 여러 개의 MetaTrader 터미널 간에 거래를 0.5초 미만의 초고속 복사 속도로 복사할 수 있습니다. 초보자든 전문가든   Local Trade Copier EA MT5 는 다양한 옵션을 제공하여 사용자의 특정 요구에 맞게 맞춤 설정할 수 있습니다. 이는 수익 잠재력을 높이려는 모든 사람을 위한 최고의 솔루션입니다. 지금 사용해보시고 이것이 왜 시장에서 가장 빠르고 쉬운 무역용 복사기인지 알아보세요! 팁: 여기 에서 데모 계정에서 Local Trade Copier EA MT5 데모 버전을 다운로드하여 사용해 볼 수 있습니다. 다운로드한 무료 데모 파일을 MT5 >> File >> Open Data Folder >> MQL5 >> Experts 폴더에 붙여넣고
Trade Dashboard MT5
Fatemeh Ameri
4.97 (58)
Tired of complex order placement and manual calculations? Trade Dashboard is your solution. With its user-friendly interface, placing orders becomes effortless, by a single click, you can open trades, set stop loss and take profit levels, manage trade lot size, and calculate risk to reward ratios, allowing you to only focus on your strategy. Say goodbye to manual calculations and streamline your trading experience with Trade Dashboard. Download  Demo Version  right now. You can find  Details of
YuClusters
Yury Kulikov
4.93 (41)
Attention: You can view the program operation in the free version  YuClusters DEMO .  YuClusters is a professional market analysis system. The trader has unique opportunities to analyze the flow of orders, trade volumes, price movements using various charts, profiles, indicators, and graphical objects. YuClusters operates on data based on Time&Sales or ticks information, depending on what is available in the quotes of a financial instrument. YuClusters allows you to build graphs by combining da
B e sure to watch this video before using A community for users, product discussion, update news, and first line of support  Use Webmoney For payments in cryptocurrencies. How I use this algo tool   Lazy Trader is NOT SUITABLE FOR SCALPING EVERY MINUTE MOVEMENT, ESPECIALLY IN CRYPTO. WITHOUT UNDERSTANDING WHAT IS HAPPENING ON THE CHART, THERE IS NO POINT IN BLINDLY HOPING FOR PROFITS! Lazy Trader does NOT USE openAI chat-gpt-4 technologies, which are added to descriptions for product promoti
MT5 to Telegram Signal Provider 는 사용하기 쉽고 완전히 커스터마이즈 가능한 유틸리티로, 특정 신호를 Telegram의 채팅, 채널 또는 그룹으로 전송하고, 귀하의 계정을 신호 제공자 로 만듭니다. 경쟁 제품과 달리 DLL 임포트를 사용하지 않습니다. [ 데모 ] [ 매뉴얼 ] [ MT4 버전 ] [ 디스코드 버전 ] [ 텔레그램 채널 ] 설정 단계별 사용자 가이드 가 제공됩니다. 텔레그램 API에 대한 지식은 필요하지 않습니다; 개발자가 제공하는 모든 것이 필요합니다. 주요 특징 구독자에게 보낸 주문 상세 정보를 커스터마이즈할 수 있습니다. 예를 들어, 브론즈, 실버, 골드와 같은 계층 구독 모델을 만들 수 있습니다. 골드 구독에서는 모든 신호를 받습니다. id, 심볼, 또는 코멘트로 주문을 필터링할 수 있습니다. 주문이 실행된 차트의 스크린샷이 포함됩니다 보낸 스크린샷에 닫힌 주문을 그려 추가 검증을 합니다 새 주문 메시지를 보내기 전에 포지션을 조
Telegram To MT5 Receiver
Levi Dane Benjamin
4.89 (9)
가입한 모든 채널에서 (개인 및 제한된 채널 포함) 시그널을 바로 MT5로 복사합니다.   이 도구는 사용자를 고려하여 설계되었으며 거래를 관리하고 모니터하는 데 필요한 많은 기능을 제공합니다. 이 제품은 사용하기 쉽고 시각적으로 매력적인 그래픽 인터페이스로 제공됩니다. 설정을 사용자 정의하고 제품을 몇 분 안에 사용할 수 있습니다! 사용자 가이드 + 데모  | MT4 버전 | 디스코드 버전 데모를 시도하려면 사용자 가이드로 이동하십시오. Telegram To MT5 수신기는 전략 테스터에서 작동하지 않습니다! Telegram To MT5 특징 여러 채널에서 동시에 신호를 복사합니다. 개인 및 제한된 채널에서 신호를 복사합니다. Bot 토큰이나 채팅 ID가 필요하지 않습니다.   (원하는 경우에는 사용할 수 있습니다) 위험 % 또는 고정된 로트로 거래합니다. 특정 심볼을 제외합니다. 모든 신호를 복사할지 또는 복사할 신호를 사용자 정의할지 선택할 수 있습니다. 모든 신호
This is exactly what the name says. Visual strategy builder . One of a kind. Turn your trading strategies and ideas into Expert Advisors without writing single line of code. Generate mql source code files with a few clicks and get your fully functional Expert Advisors, which are ready for live execution, strategy tester and cloud optimization. There are very few options for those who have no programming skills and can not create their trading solutions in the MQL language. Now, with Bots Build
Trade Manager DaneTrades
Levi Dane Benjamin
4.74 (23)
거래 관리자는 위험을 자동으로 계산하는 동시에 거래를 빠르게 시작하고 종료하는 데 도움을 줍니다. 과잉 거래, 복수 거래 및 감정 거래를 방지하는 데 도움이 되는 기능이 포함되어 있습니다. 거래를 자동으로 관리할 수 있으며 계정 성과 지표를 그래프로 시각화할 수 있습니다. 이러한 기능은 이 패널을 모든 수동 거래자에게 이상적으로 만들고 MetaTrader 5 플랫폼을 향상시키는 데 도움이 됩니다. 다중 언어 지원. MT4 버전  |  사용자 가이드 + 데모 트레이드 매니저는 전략 테스터에서 작동하지 않습니다. 데모를 보려면 사용자 가이드로 이동하세요. 위기 관리 % 또는 $를 기준으로 위험 자동 조정 고정 로트 크기 또는 거래량과 핍을 기반으로 한 자동 로트 크기 계산을 사용하는 옵션 RR, Pips 또는 Price를 사용한 손익분기점 손실 설정 추적 중지 손실 설정 목표 달성 시 모든 거래를 자동으로 마감하는 최대 일일 손실률(%)입니다. 과도한 손실로부터 계정을 보호하고 과도한
Trade Assistant 38 in 1
Makarii Gubaydullin
4.89 (18)
다기능 도구: 로트 계산기, 가격 조치, R/R 비율, 무역 관리자, 공급 및 수요 영역을 포함한 65개 이상의 기능 데모 버전   |   사용자 매뉴얼   |   MT5 버전 이 유틸리티는 전략 테스터에서 작동하지 않습니다.   여기에서 데모   버전을 다운로드하여 제품을 테스트할 수 있습니다. Contact me   질문/개선 아이디어가 있는 경우/버그가 발견된 경우   저에게 연락 하십시오. 거래 프로세스를 간소화, 가속화 및 자동화하십시오. 이 대시보드로 표준 터미널 기능을 확장하십시오. 유틸리티는 외환, 주식, 지수, 암호화폐 등 모든 거래 수단에서 작동합니다. 1. 새로운 거래 열기 : 로트/리스크/RR 계산: 1. Lot 계산기 (리스크 규모에 따른 거래량 계산) 2. 리스크 계산기 (로트 규모에 따른 리스크 금액) 3. 위험/보상 비율(RR) 4. 주문에 대한 활성화 트리거 + StopLimit 구매 / StopLimit 판매 5. 가상 SL / TP 레벨
News Trade EA MT5
Konstantin Kulikov
4.5 (10)
제가 몇 년 동안 사용하고 있는 유용한 로봇을 소개드립니다. 반자동뿐만 아니라 자동 모드로도 사용할 수 있습니다. 본 프로그램에는 경제 캘린더의 뉴스별로 유연한 거래 설정이 포함되어 있습니다. 전략 테스터에서 확인할 수 없습니다. 진짜 작업뿐입니다. 터미널 설정에서 허용된 URL 목록에 뉴스 사이트를 추가해야 합니다. 서비스>설정 > 조언자>를 클릭합니다. "다음 URL에 대해 WebRequest 허용:" 확인란을 선택합니다. 다음을 추가합니다 (공백 삭제): https://  nfs.faireconomy.media 자동 모드 시 기본 설정 관리: https://www.mql5.com/ko/signals/1447007 . 동일한 결과를 얻으려면 임의 기간 (기간이 얼마정도인지 상관 없음)의 GBPUSD 차트에 전문가를 첨부하십시오. 이 전문가를 위해 고유 설정 세트를 만들 때 블로그의 모든 매개변수에 대한 설명을 참조하십시오: https://www.mql5.com/en/
Trade copier MT5
Alfiya Fazylova
4.48 (27)
Trade Copier는 거래 계정 간의 거래를 복사하고 동기화하도록 설계된 전문 유틸리티입니다. 복사는 공급자의 계정/단말기에서 동일한 컴퓨터 또는 vps에 설치된 수신자의 계정/단말기로 발생합니다. 구매하기 전에 데모 계정에서 데모 버전을 테스트할 수 있습니다. 데모 버전 여기 . 전체 지침 여기 . 주요 기능 및 이점: 복사기는 "МТ5> МТ5", "МТ4> МТ5", "МТ5> МТ4" 복사를 지원합니다. 복사기는 데모 계정 > 실 계정, 실 계정 > 데모 계정, 데모 계정 > 데모 계정 및 실제 계정 > 실 계정 복사를 지원합니다. 복사기는 읽기 전용 암호가 적용된 투자자 계정에서 복사를 지원합니다. 하나의 공급자 터미널은 여러 수신 터미널로 트랜잭션을 보낼 수 있고 하나의 수신 터미널은 여러 공급자 터미널에서 트랜잭션을 수신할 수 있습니다. 복사기는 귀하 또는 귀하의 고문이 거래하는 동일한 터미널에서 작동할 수 있습니다. 높은 복사 속도(0.5초 미만). 복사기에는 간편
Exp COPYLOT CLIENT for MT5
Vladislav Andruschenko
4.15 (26)
MT5용 트레이드 복사기는 metaТrader 5 플랫폼용 트레이드 복사기입니다   . 그것은 사이의   외환 거래를 복사합니다       모든 계정   COPYLOT MT5 버전의 경우   MT5   -   MT5, MT4   -   MT5 (또는 COPYLOT MT4 버전의 경우   MT4 -   MT4 MT5   -  MT4) 믿을 수 있는 복사기! MT4 버전 전체 설명   +DEMO +PDF 구입 방법 설치하는 방법     로그 파일을 얻는 방법     테스트 및 최적화 방법     Expforex의 모든 제품 МТ4 터미널에서 거래를 복사할 수도 있습니다(   МТ4   -   МТ4, МТ5   -   МТ4   ):   COPYLOT CLIENT for MT4 이 버전은 МТ5   -   МТ5, МТ4   -   МТ5   터미널 간을 포함합니다. 거래 복사기는 2/3/10 터미널 사이의 거래/포지션을 복사하기 위해 만들어졌습니다. 데모 계정 및 투자 계
Unlimited Trade Copier Pro MT5 is a tool to copy trade remotely to multiple MT4, MT5 and cTrader accounts at different computers/locations over internet. This is an ideal solution for you if you are a signal provider and want to copy your trades to other receivers globally on your own rules. One provider can copy trades to multiple receivers and one receiver can get trade from multiple providers as well. The provider can even set the subscription expiry for each receiver, so that receiver will n
Grid Manual MT5
Alfiya Fazylova
4.88 (16)
"Grid Manual"은 주문 그리드 작업을 위한 거래 패널입니다. 이 유틸리티는 보편적이며 유연한 설정과 직관적인 인터페이스를 제공합니다. 그것은 손실을 평균화하는 방향뿐만 아니라 이익을 증가시키는 방향으로 주문 그리드와 함께 작동합니다. 거래자는 주문 그리드를 만들고 유지할 필요가 없으며 유틸리티에서 수행합니다. 거래자가 주문을 시작하는 것으로 충분하며 "Grid Manual"는 자동으로 그를 위한 주문 그리드를 생성하고 거래가 마감될 때까지 그와 동행할 것입니다. 전체 설명 및 데모 버전 여기 . 유틸리티의 주요 기능: 모바일 터미널을 포함하여 어떤 방식으로든 열린 주문과 함께 작동합니다. "제한" 및 "중지"의 두 가지 유형의 그리드와 함께 작동합니다. 고정 및 동적(ATR 표시기 기반)의 두 가지 유형의 그리드 간격 계산과 함께 작동합니다. 오픈 오더 그리드의 설정을 변경할 수 있습니다. 차트에서 각 주문 그리드의 손익분기점 수준을 표시합니다. 각 주문 그리드에 대한 이익
한 번의 클릭으로 거래할 수 있는 거래 패널.   위치 및 주문 작업!   차트 또는 키보드에서 거래. 당사의 거래 패널을 사용하면 차트에서 직접 클릭 한 번으로 거래를 실행할 수 있으며 표준 MetaTrader 컨트롤보다 30배 빠르게 거래 작업을 수행할 수 있습니다. 매개변수와 기능의 자동 계산을 통해 트레이더는 더욱 빠르고 편리하게 거래할 수 있습니다. 그래픽 팁, 정보 라벨, 무역 거래에 대한 전체 정보는 MetaTrader 차트에 있습니다. MT4 버전 전체 설명   +DEMO +PDF 구입 방법 설치하는 방법     로그 파일을 얻는 방법     테스트 및 최적화 방법     Expforex의 모든 제품 열기 및 닫기, 반전 및 잠금, 부분 닫기/오토로트. 가상/실제 손절매/이익 실현/후행 정지/손익분기점, 주문 그리드 ... MetaТrader 5   의 주요 주문 거래 컨트롤 패널: 구매, 판매, 구매 중지, 구매 제한, 판매 중지, 판매 제한, 닫기, 삭제
Adam FTMO MT5
Vyacheslav Izvarin
5 (2)
ADAM EA Special Version for FTMO Please use ShowInfo= false for backtesting ! Our 1st EA created using ChatGPT technology Trade only GOOD and checked PROP FIRMS  Default parameters for Challenge $100,000 Tested on EURUSD and GBPUSD only  Use 15MIN Time Frame Close all deals and Auto-trading  before Weekend at 12:00 GMT+3  Friday For Prop Firms MUST use special Protector  https://www.mql5.com/en/market/product/94362 -------------------------------------------------------------------------------
MetaCluster
Aleksei Vinogradov
5 (1)
MetaCluster Makes Any Market Transparent! MetaCluster is a professional trading and analytical system for effective trading on Forex , Crypto markets , and Binary Options . MetaCluster performs volume-cluster analysis simultaneously across multiple timeframes of an asset (Multi-Timeframe Analysis), identifying and displaying Target Zones for trade entries that remain invisible when analyzing a single timeframe. This allows you to see the traces of the Market Maker (smart money) and follow him,
-25% discount ($199 -> $149) Advanced trading tool: One click smart orders that execute under your conditions Developed by trader for trading community:  position size calculator (lot size), open position after price action, strategy builder, set and forget trading, mobile notifications... Risk Management -  Risk percentage position size calculator, gain percentage, target risk reward ratio, spread and commissions are included in calculations 7 Advanced order types  - Set and forget trading w
맞춤 알림으로 시장 움직임에 앞서 나가세요: 최고의 멀티 마켓 스캐너 사용자 지정 알림은 여러 시장에서 잠재력이 높은 설정을 쉽게 식별할 수 있는 강력한 올인원 시장 모니터링 도구입니다. 8개의 주요 통화(USD, CAD, GBP, EUR, CHF, JPY, AUD, NZD), 금(XAU), 최대 7개의 주요 지수(US30, UK100, WTI, 비트코인 포함)를 모두 포함하는 맞춤 알림은 다양한 자산의 중요한 변화를 계속 업데이트해 줍니다. 이 도구는 고급 FX 파워, FX 볼륨, IX 파워 지표의 데이터를 원활하게 통합하여 중요한 시장 이벤트에 대한 실시간 알림을 완전히 사용자 지정 가능한 형식으로 제공합니다. 사용자 지정 알림을 사용하면 차트를 계속 확인하지 않고도 잠재적 거래에 대해 항상 조치를 취할 수 있습니다. 사용자 지정 알림의 주요 이점 다중 시장 범위: 통화, 지수, 원자재, 암호화폐에 대한 인사이트를 한 곳에서 모두 확인할 수 있습니다. 실시간 이벤트 알림:
-25% discount ($149 -> $111) Everything for chart Technical Analysis indicator mt5 in one tool Draw your supply demand zone with rectangle and support resistance with trendline and get alerts to mobile phone or email alert -  Risk reward indicator mt5 Video tutorials, manuals, DEMO download   here .   Find contacts on my   profile . 1.   Extended rectangles and trendlines Object will be extended to the right edge of the chart when price will draw new candles on chart. This is rectangle extend
Invi Gold Hunters
Niruban Chakravarthy R
Gold Hunters is one of the straightforward tool to analysis the volatile market of Gold with demands precision, in-depth analysis, strong risk management and eliminating the need for constant market monitoring. Gold Hunter will hunt the good trade position with precise risk management on all market conditions on Gold.  Hunters plug-and-play functionality means you can get started with minimal effort, Simply install me and let me handle the rest. We will diligently monitor the market, identify t
DrawDown Limiter
Haidar, Lionel Haj Ali
5 (18)
Drawdown Limiter EA You are in the right place if you were searching for Drawdown control, Drawdown limiter, Balance protection, Equity Protection or Daily Drawdown Limit related to Prop Firm, FTMO, or Funded account trading, or if you want to protect your trading account. Have you suffered from controlling your drawdown when trading funded accounts? This EA is meant for you. Prop firms usually set a rule called “Trader Daily Drawdown”, and if it is not respected, you are disqualified.  I am an
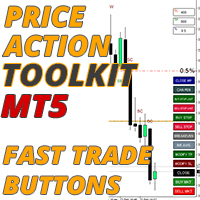
가격 조치 도구 키트 EA는 주로 스캘퍼를 위해 설계되었지만 모든 시간대에 사용하여 정지 수준에 따라 올바르게 계산된 로트 크기로 시장에 빠르게 진입할 수 있습니다. 주문) 그런 다음 시장이 움직일 때 스탑을 조정하고 이익을 얻습니다. 사용할 모든 기능, 설정 및 모범 사례 전략의 전체 목록을 보려면 여기를 클릭하십시오.   https://www.mql5.com/en/blogs/post/748072 위험 기반 진입 빠른 주문 버튼을 사용하면 계정의 위험 비율을 기반으로 포지션을 잡을 수 있습니다. 선택한 위험과 손절매까지의 거리를 기반으로 로트 크기를 자동으로 계산합니다. 따라서 브로커가 0.01 로트 크기 사용을 허용하는지 확인해야 합니다. 0.10 또는 1.00 로트 증분을 사용해야 하는 경우 작동하지 않습니다. 빠른 거래 실행 버튼 차트에 빠른 거래 실행 버튼을 배치하여 즉시 거래를 자동으로 열거나 닫거나 조정할 수 있습니다. 일반 진입 버튼뿐만 아니라 모든 포지션
RSI Divergence Scanner is a multi-timeframe and multi-symbol dashboard and alert that checks all timeframes and symbols to find regular and hidden divergences between price chart and RSI indicator. This divergence scanner is integrated with support and resistance zones so you can check the RSI divergences in the most important areas of the chart to find trend reversals in price chart. Download demo version   (works on M4,M5,M6,M12,H3,H8 timeframes) Full description of scanner parameters ->   cli
MT5 To Telegram Copier
Levi Dane Benjamin
3.67 (3)
MT5에서 Telegram으로 완전히 사용자 정의 가능한 신호를 보내고 신호 제공자가 되세요! 이 제품은 사용하기 쉽고 시각적으로 매력적인 그래픽 사용자 인터페이스로 제공됩니다. 설정을 사용자 정의하고 제품을 몇 분 안에 사용할 수 있습니다! 사용자 가이드 + 데모  | MT4 버전  | Discord 버전 데모를 시도하려면 사용자 가이드를 참조하십시오. MT5에서 Telegram으로 보내는 기능은 전략 테스터에서 작동하지 않습니다. MT5에서 Telegram으로의 기능 다양한 옵션으로 신호를 완전히 사용자 정의합니다 신호 앞이나 뒤에 자체 사용자 지정 메시지를 추가합니다. 태그, 링크, 채널 또는 기타 모든 것이 될 수 있습니다 신호에 이모티콘을 추가, 제거 또는 사용자 정의합니다. 또는 모두 제거할 수도 있습니다. 심볼 또는 매직 번호로 보낼 거래를 필터링합니다 특정 심볼의 전송 제외 특정 매직 번호의 전송 제외 신호와 함께 전송할 거래 세부 정보를 사용자 정의합니다 신호
제작자의 제품 더 보기
This product can be used to synchronize multiple Charts, and each Chart can be set to a different sync mode. With this product you can better view and manipulate charts: different time frames for a single Symbol, the same time frame for multiple Symbols, system indicators for single/multiple Symbols... and more. Feature: Chart settings can be synchronized, including : background, indentation, size, etc. Multiple Chart window start times  or end times can be synchronized. Multiple Chart time f
This product can be used to synchronize multiple Charts, and each Chart can be set to a different sync mode. With this product you can better view and manipulate charts: different time frames for a single Symbol, the same time frame for multiple Symbols... and more. PS: The link below is the FreeDemo product, you can use it on EURUSD/XUAUSD/USDCNH symbol: https://www.mql5.com/en/market/product/38557 Feature: Chart settings  can be synchronized, including : background, indentation, size, etc.
Do you think it's a bit cumbersome when you need to switch symbols or timeframes with mouse click? 1. What is this? This is a program that can switch symbols and timeframes with direction keys. Fast switching, very convenient, no mouse click required. For traders, one symbol with multi-timeframe charts are usually added,  you can change symbol on those charts easily. For multi-currency traders, different symbol charts are usually added, you can also change those timeframes easily. I wrote this p
1. What is this         Rising volatility and falling volatility are not the same, whether it is academic research or actual testing has shown this point.         The original ATR indicator is calculated by putting up and down fluctuations together. This indicator is to calculate separately the upward volatility and the downward volatility, which can better help you study the market. 2. Indicator description          There are two modes for the calculation of this indicator, as shown in the f
Have you ever take a long time to watch a Symbol when the network link is not good ? Have you ever wait for a long time when you switch chart between different Symbols or different TimeFrames ? If you do long-term backtesting , Have you ever to be downloaded datas for a long time ? Yes, If there is no data in the system, those will happen.  1. What is this: Download all the Symbol data in Market Watch to the system. PS: This is not outputting data to Files. This Link go to Demo version: https:
I see that many tools in the market deal with Position and Order in the form of operation panels. Which is loaded into a Chart in the form of an EA. However, once the operator panel EA is loaded, no other EAs can be loaded. So, I wrote the one-click operation of Position and Order as a script, so you can load other EAs and easily complete one-click operation of Trade. 1. What is this: This is a one-click script to close position order. Now you can close position tickets at high speed, for examp
I see that many tools in the market deal with Position and Order in the form of operation panels. Which is loaded into a Chart in the form of an EA. However, once the operator panel EA is loaded, no other EAs can be loaded. So, I wrote the one-click operation of Position and Order as a script, so you can load other EAs and easily complete one-click operation of Trade. 1. What is this: This is a one-click script to delete the pending order . Now you can delete pending tickets at high speed, for
According to trading experience: Some symbols are easy to reverse on certain days, such as Monday, or afternoon, and so on. So comparing the current price with the corresponding historical moment price is valuable. If the price coordinate system uses a logarithmic price, you will get a lot of valuable information. 1. What is this? This program can convert the symbol price and add it to your Chart. You can compare it with your major chart. The DEMO version Link: https://www.mql5.com/en/market/p
What is this: Violent trading: means sending a large number of orders to your brokerage server,  it can conduct a stress test of the trading. In this program you can run a variety of trading tests.  Now you can trade at high speed, For example 1000 orders in an instant. The Demo version's link:  https://www.mql5.com/en/market/product/38431/ Why to use: Whether manual trading or EA trading,  the status of the broker server is very important. So it is beneficial to conduct a trading stress test on
1. Why did I develop this series of indicators I found that most traders need to use multiple time frame indicators. They usually switch time frame to see indicators. However, once the timeframe is switched, you cannot see the  corresponding relationship  between  the price in the smaller timeframe  and  the indicator in the larger timeframe . For example: if your price chart is in H1 timeframe, you can see H4, D1 and W1 indicators in H1 timeframe Chart. This is more helpful for you to find t
필터:
[삭제] 2019.02.21 09:31 
 

사용자가 평가에 대한 코멘트를 남기지 않았습니다

[삭제] 2019.02.21 09:29 
 

사용자가 평가에 대한 코멘트를 남기지 않았습니다

리뷰 답변
버전 1.6 2020.06.06
recompiled for MT5 update.
버전 1.5 2020.02.18
A large update, now you can change other chart.
//The following options are used to change other open charts:
input bool OtherOpenChart_Symbol = false; //Change symbol on other open chart?
input bool OtherOpenChart_TimeFrame = false; //Change timeframe on other open chart?
input int PermitCount = 0; //Just change the count of initially opened chart. 0 means all.

PS:
I must tell you, When switching between multi charts, the system will download the data, If your system doesn't have data, it will download the data and sometime will cause slowdowns. That is the limited of MT5/MT4 client.
버전 1.4 2020.02.14
Change TurnOn parameter to :
bool TurnOn_UpDown=true; // Turn on the UP/DOWN key function to change Symbol.
bool TurnOn_LeftRight=true; // Turn on the LEFT/RIGHT key function to change TimeFrame.
Now, you can choose the change mode.
버전 1.3 2020.01.31
add the parameter to turn on/off the directional key funcion.
버전 1.2 2019.10.28
If you add this indicator more than once, the system will alert you.
버전 1.1 2019.10.24
Hide the text, and move it to program description.