• Panoramica
  • Recensioni (2)
  • Commenti
  • Novità

Directional Key To Change Symbols and TimeFrames

Do you think it's a bit cumbersome when you need to switch symbols or timeframes with mouse click?

1. What is this?

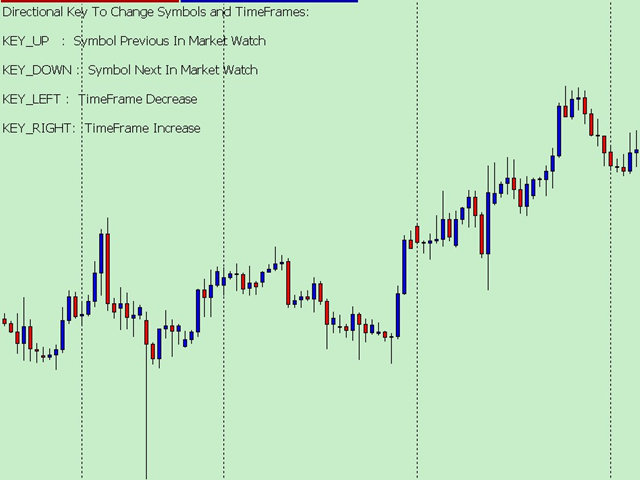
This is a program that can switch symbols and timeframes with direction keys.

  • Fast switching, very convenient, no mouse click required.
  • For traders, one symbol with multi-timeframe charts are usually added,  you can change symbol on those charts easily.
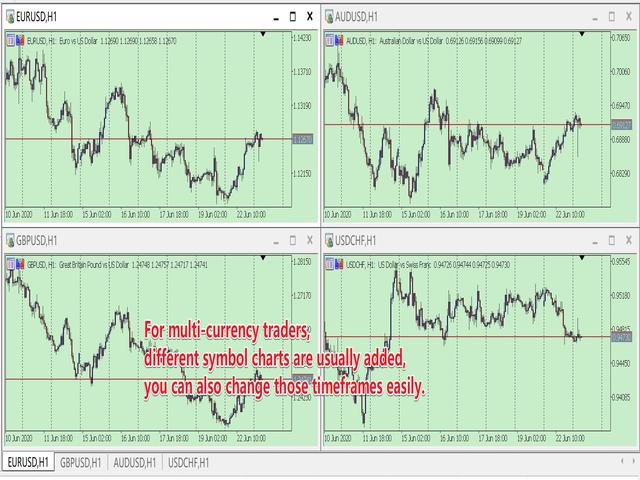
  • For multi-currency traders, different symbol charts are usually added, you can also change those timeframes easily.

I wrote this program in the form of indicator. So you can load other EAs, indicators or run other scripts.

2. How to use it

When you load the program:

  • The direction key UP is to switch to the previous symbol in market watch.
    • PS:  When the chart is the first symbol, Key UP will switch to the last symbol.
  • The direction key DOWN is to switch to the next symbol in market watch.
    • PS:  When the chart is the last symbol, Key DOWN will switch to the first symbol.
  • The direction key LEFT is to decrease the timeframes.
    • PS:  When the timeframe is M1, Key LEFT will switch to the MN1 timeframe.
  • The direction key RIGHT is the increase time frame.
    • PS:  When the timeframe is MN1, Key RIGHT will switch to the M1 timeframe.

3. Parameters:

  • bool TurnOn_UpDown=true;    // Turn on the UP/DOWN key function to change Symbol.
  • bool TurnOn_LeftRight=true;  // Turn on the LEFT/RIGHT key function to change TimeFrame.
  • bool AllTimeFrames=false;     // Whether to use All Time Frames

=====The following options are used to change other open charts:

PS: I must tell you, when switching between multi charts, the system will download the data, If your system doesn't have data, it will download the data and sometime will cause slowdowns. That is the limited of MT5/MT4 client. When you don't have enough data, don't use the keyboard too quickly.

  • bool OtherOpenChart_Symbol = false;    // Change symbol on other open chart?
  • bool OtherOpenChart_TimeFrame = false;  // Change timeframe on other open chart?
  • int PermitCount = 0; // Just change the count of initially opened chart. 0 means all.
    • PS: when you want to change other charts, but not all the open charts. you can change the num.


Prodotti consigliati
Orion Telegram Notifier Bot
Joao Paulo Botelho Silva
Orion Telegram Notifier Bot  allows the trader to receive trade notifications in his Telegram whenever a position is opened or closed. The EA sends notifications showing the Symbol, Magic Number, Direction, Lot (Volume), Entry Price, Exit Price, Take Profit, Stop-Loss and Profit of the position. How to setup Orion Telegram Notifier? Open Telegram and Search for “BotFather” Click or Type “/newbot” Create a nickname and username (Example: nickname: MT5trades   - username: MT5TelegramBot) *The us
RenkoChart EA
Paulo Henrique Da Silva
4.33 (3)
The RenkoChart tool presents an innovative and highly flexible approach to visualizing market data in MetaTrader 5. This expert creates a custom symbol with Renko bricks directly on the chart, displaying accurate prices at the respective opening date/time for each brick. This feature makes it possible to apply any indicator to the Renko chart. Furthermore, this tool also allows access to historical brick data through native methods in the MQL5 programming language, such as iOpen, iHigh, iLow and
FREE
Account Informer MT5
Ismail Hakki Delibas
5 (2)
Account Informer Utility Helps you :     Stay in Touch With Your Account.     Hear About Your Account Critical Conditions.     Check Your Account Connectivity.     Inform from any Position Change.     When All Orders Closed     Receive Notifications as Android or IOS Notifications on Your Phone, Email or Popup Window. Information can send in these conditions according to your selection :     Constant Time Period     When Drawdown Larger than Specified Value     When Margin Level Sm
This is a support tool that will notify you when the price crosses a trend line, you can draw any trend line by manual, and you can change or drag it on chart in working time This tool will automatically update the new location of the trend line to alert you How to use: after added it on chart, you will draw a trend line and set name of the trend line same as in input of the tool (the parameter LineName ) There are 3 notification methods : Pop Up Alert, Send Email or Notification You can choose
Enhance your price action strategy: inside bar breakouts at your fingertips This indicator detects inside bars of several ranges, making it very easy for price action traders to spot and act on inside bar breakouts. [ Installation Guide | Update Guide | Troubleshooting | FAQ | All Products ] Easy to use and understand Customizable color selections The indicator implements visual/mail/push/sound alerts The indicator does not repaint or backpaint An inside bar is a bar or series of bars which is/
Super ATR
Lina Staseliene
Super ATR is a powerful tool for analyzing the ATR (Average True Range) levels. The intuitive interface allows you to easily monitor all the main ranges of volatility. Key Features Plots the daily АТR areas on the chart. Plots the weekly АТR areas on the chart. Plots the monthly АТR areas on the chart. Displays a panel with the current values of the main volatility ranges (M5,H1,D1,W1,MN) on the chart. The areas and values in the table change their color when the ATR level is reached. Draws th
BeST Swing Strategy MT5 is a Metatrader indicator based on the corresponding Jim Berg's work about volatility as described in his article "The Truth About Volatitlity" (TASC 2/2005).The indicator consists of 2 channel lines deriving as (MA+/- times the ATR) and can be used as a standalone trading system.The outlier prices of the Market as of the indicator's values can be used for producing Entry and Exit Signals. Advantages of the indicator == Uses 2 Swing Strategies == Never repaints it
Have you ever take a long time to watch a Symbol when the network link is not good ? Have you ever wait for a long time when you switch chart between different Symbols or different TimeFrames ? If you do long-term backtesting , Have you ever to be downloaded datas for a long time ? Yes, If there is no data in the system, those will happen.  1. What is this: Download all the Symbol data in Market Watch to the system. PS: This is not outputting data to Files. This Link go to Demo version: https:
TradingX Hotkeys
Johannes Stephanus Lombard
Inputs Available Lotsizes Partial Close % You can change lotsizes as you require On an open chart click once to select chart to be able to use hotkeys on specific chart. All Pairs can be used with this expert We created this expert to be able to still trade C300 with a 0.06 Lotsize If you enter a 0.6 lot and close 0.90% you can trade with 0.06 Lot Keys to be used: B -Buy S -Sell C -Close Profitable D -Breakeven (Note if stoploss is set it won't break even) P -Partial close
AutoCloseTimer allows you to close positions and delete pending orders at a specified time. Usage Download and drag and drop AutoCloseTimer onto the chart. Check Allow AutoTrading in Common tab. Set parameters in Inputs tab. Notice: The close time must be later than the current market time. Input Parameters CloseSymbol - there are 2 options SymBol Of Chart - just close the symbol of the current chart All Symbols - close all symbols CloseTimerDay - specify a day for AutoCloseTimer. The defau
Rectangle line Trade Execution Assistant Rectangle Line Trade Assistant EA  Semi-Automated Trading Assistant       IMPORTANT :   On the main/purchased program a user can click on the Rectangle line and move/ drag it around the chart, by double clicking on it. Please keep in mind that this option is not available on demo version, due to some restrictions/limitations of Strategy Tester, some Object related operations are not available in the Strategy Tester. But, it will not prevent you from Test
Introducing the Ultimate Trade Panel MT5 - Your All-in-One Trade Manager for MQL5 Trading Are you a trader looking to streamline your trading activities and gain a competitive edge in the market? Look no further! The Ultimate Trade Panel MT5 is here to revolutionize your trading experience on the MQL5 platform. With a plethora of unique and time-saving features, this expert advisor is designed to be your reliable companion for day-to-day trading activities. Key Features: Indicator Manager: Say g
Ciao amici Investire è considerato un’attività difficile e rischiosa agli occhi delle persone. Ma se investi acquisendo conoscenze e competenze, il mercato non ti farà mai del male. La scrittura di filtri nel mercato dei capitali è una delle azioni che i professionisti intraprendono in questo campo per aumentare la produttività e risparmiare tempo. A causa dell'attività di un gran numero di simboli, il volume delle informazioni e dei dati memorizzati è molto elevato. Le persone attive in ques
Questo strumento può aiutarti a chiudere tutti gli ordini aperti con un clic, basta fare clic su "Chiudi tutto". Se desideri chiudere solo gli ordini redditizi, fai clic sul pulsante "Chiudi redditizi" Dopo aver cliccato, tutti gli ordini fluttuanti verranno chiusi; Se desideri chiudere solo gli ordini con perdite fluttuanti, fai clic sul pulsante "Chiudi perdibili" Dopo aver cliccato, tutti gli ordini con perdite fluttuanti verranno chiusi. Questo strumento è stato testato per un anno. La funzi
HAshi-E è un modo migliorato di analizzare i segnali Heiken-Ashi. Briefing: L'Heiken-Ashi è particolarmente apprezzato per la sua capacità di filtrare la volatilità a breve termine, che lo rende uno strumento privilegiato per identificare e seguire le tendenze, aiuta a prendere decisioni sui punti di entrata e di uscita e aiuta a distinguere tra falsi segnali e vere inversioni di tendenza. A differenza dei tradizionali grafici a candele, le candele Heiken-Ashi sono calcolate utilizzando i v
SyncGraph Plus
PATRICK ANTONIO MORELO A.
Indicator that synchronizes the charts, that is, when the asset is replaced in one of the charts, all those that appear with the synchronized indicator are changed, with the same timeframe (Same_Timeframe = true) or with different timeframes (Same_Timeframe = false). The graphics to be synchronized are identified by color (Label). To synchronize the indicators, the indicator must be inserted in all charts to be synchronized, using the same color (Label). A box with the chosen color (Label) and
MT5 To Notion
Levi Dane Benjamin
5 (2)
Questo programma ti permetterà di esportare tutti i tuoi scambi dal tuo account MetaTrader direttamente in Notion usando un'interfaccia utente molto amichevole.  Versione MT4  |  Guida dell'utente + Demo Per iniziare, utilizza la Guida dell'utente e scarica il Modello Notion. Se desideri una demo, consulta la Guida dell'utente. Non funziona nel tester di strategia! Funzionalità principali Esporta tutti gli scambi dal tuo account di trading nel tuo Notion Esporta gli scambi in corso e gli ordini
N-second K-line chart, customizable, monitoring multiple seconds of multiple symbols simultaneously, all Chinese parameters, easy to use -------------------------------------------------------------------------------------------------------------- You can ask me any questions in private messages https://www.mql5.com/en/users/chaoping0326 Customization of indicators and EA for MT4 and MT5 is available Long term programming project (MT4 from 2012, MT5 from 2016). Good programming skills, reasonabl
Click and Go Trade Manager MT5
Victor Christiaanse
5 (1)
Click and Go Trade Manager, the ultimate solution for seamless trading execution. With a simple click on the chart, you can effortlessly define your stop loss, entry price, and target levels. No more hassle of inputting values manually - it's made incredibly intuitive and easy. Embedded risk management is a key feature of our Trade Manager. We understand the importance of protecting your investments, which is why the Click and Go Trade Manager incorporates risk management. When placing orders, y
This utility can compare simultaneously time frames of different instruments and keep under control   the nine major time frames  of an instrument. It is composed by two changers, a crosshair and some additional components : the  multicharts time frames changer   is designed to  compare  simultaneously  up to thirty time frames  of different symbols with the  keyboard or the button the multicharts symbols changer can  link up to nine charts and control simultaneously the nine major time frame b
Support Or Resistance Alert Broken
Jhojan Alberto Tobon Monsalve
"Support or Resistance Alert Broken" is a simple and very intuitive tool that allows you to create or eliminate horizontal and trend supports and / or resistances with a simple click. When the support or resistance line is broken by the closing price at the end of the current candle, the "Support or Resistance Alert Broken" tool will send an alert with sound, as well as a notification to the MT4 or MT5 mobile application. This tool can send alerts from multiple pairs at the same time. Utili
PivotePoint MT5
Kambiz Shahriarynasab
Unlike many other indicators including the moving average indicator, Pivot Point can be a leading indicator. In these systems, the price levels of the previous period are used to determine the critical points instead of relying on the current price performance. Such an approach provides a clear framework for traders to plan their trades in the best possible way. You can use this method and its combination with the methods you want to build and use a powerful trading setup. MT4 version Let us k
CrossMAn MT5
Pavel Verveyko
"CrossMAn" is a table indicator that gives signals about the intersection of two moving averages, on selected instruments and time periods. The intersection of moving averages is one of the most popular signals on the stock exchange. The signal is displayed as colored rectangles in the table. Thus, you can assess at a glance which tool should be paid attention to. (Crossman does not add moving averages to the chart.) The indicator table can be dragged with the mouse. The size of the table
PLEASE CONTACT ME BEFORE PURCHASE FOR DISCOUNT UP TO 50% Key Features: Full Range Breakout Strategy: The EA continuously monitors price movements and identifies breakout points based on predefined high and low ranges. When the price moves beyond these levels, the EA automatically opens trades, positioning itself to take advantage of potential price trends. Trailing Stop Loss: To enhance risk management and protect profits, the EA includes a trailing stop loss feature. This functionality allow
Spread Eliminator
Wouter Dries Bijnens
I'm proudly introducing "Spread Eliminator" - Your Ultimate Solution against High Spreads in Forex Trading! Are you tired of hitting Stop Losses or having pending orders triggered at a bad price due to high spreads while trading? All this is now over with our revolutionary EA , Spread Eliminator! Can be used on Prop Firms that enforce high overnight spreads and/or high spreads during high volatile market conditions. Key Features: Smart Spread Monitoring: Spread Eliminator constantly monitors mar
MQL Tool "Ofir Email to Telegram": Never Miss a Trading Alert Again! Tired of missing important alerts from your indicators and Expert Advisors (EAs)? Ofir Email to Telegram is the solution you've been waiting for! This revolutionary MQL tool automatically forwards all email alerts from your indicators and EAs directly to your Telegram account. Never again will you miss a trading opportunity or important notification! Here are just a few of the benefits of Ofir Email to Telegram: Quick and easy
TradePulse Commander Pannel
AL MOOSAWI ABDULLAH JAFFER BAQER
Presentiamo il **Pannello di Gestione delle Transazioni** definitivo, progettato per ottimizzare le tue operazioni di trading e aumentare la tua efficienza! Il nostro pannello avanzato è dotato di potenti funzionalità per semplificare le tue attività di trading e fornire informazioni in tempo reale: - **Gestione TP e SL con un clic**: Elimina facilmente tutti i livelli di Take Profit (TP) e Stop Loss (SL) su tutto il tuo conto o per coppie specifiche con un solo clic. - **Monitoraggio degli
The analyzer makes it possible to quickly assess spread changes on historical data,   the magnitude and frequency of bursts, the dynamics and nature of the extensions by the days of the week, etc. The analyzer needs to be started in the tester (visualization mode) on the symbol and time interval required for analysis,   recommended TimeFrame H1, select "Every tick based on real ticks" mode.
Correlation Dashboard MT5
Christopher Cyril Abu Aita
This indicator calculates Correlation among currency pairs (Selected by user) to find the least and/or most correlated symbols in real time. Correlation ranges from -100% to +100%, where -100% represents currencies moving in opposite directions (negative correlation) and +100% represents currencies moving in the same direction. Note The Correlation more than 80 (Adjustable) between two currency pairs, Shows that they are quite similar in the kind of movement and side. The Correlation less than
Busque Trade
Edson Cavalca Junior
This indicator looks for SIGNS of Buy and Sell 14 SIGNS: Crossover of 2 moving averages; Crossover of 3 moving averages; RSI Indicator; Stochastic Indicator; Crossing line 0 MACD; Divergence of the RSI indicator; Divergence of the MACD indicator; Divergence of the OBV indicator; Divergence of the STOCHASTIC indicator; Three white soldiers candle pattern; Three black crows candle pattern; Hanging man    candle pattern; Hammer    candle pattern; Rupture Bands Bollinger. The indicator plot
Gli utenti di questo prodotto hanno anche acquistato
Trade Assistant MT5
Evgeniy Kravchenko
4.37 (166)
It helps to calculate the risk per trade, the easy installation of a new order, order management with partial closing functions, trailing stop of 7 types and other useful functions. Attention, the application does not work in the strategy tester. Manual, Description, Download demo Line function -   shows on the chart the Opening line, Stop Loss, Take Profit. With this function it is easy to set a new order and see its additional characteristics before opening.   Risk management  - The risk
Forex Trade Manager MT5
InvestSoft
4.97 (446)
Benvenuto a Trade Manager EA, lo strumento definitivo per la gestione del rischio , progettato per rendere il trading più intuitivo, preciso ed efficiente. Non è solo uno strumento per l'esecuzione degli ordini, ma una soluzione completa per la pianificazione delle operazioni, la gestione delle posizioni e il controllo del rischio. Che tu sia un principiante, un trader avanzato o uno scalper che necessita di esecuzioni rapide, Trade Manager EA si adatta alle tue esigenze, offrendo flessibilità s
TradePanel MT5
Alfiya Fazylova
4.85 (115)
Trade Panel è un assistente commerciale multifunzionale. L'applicazione contiene più di 50 funzioni per il trading manuale e ti consente di automatizzare la maggior parte delle azioni di trading. Prima dell'acquisto, puoi testare la versione Demo su un account demo. Demo qui . Istruzioni complete qui . Commercio. Ti consente di eseguire operazioni di trading di base in un clic: Apertura di ordini e posizioni pendenti. Apertura di una griglia di ordini. Chiusura di ordini e posizioni pendenti. In
Local Trade Copier EA MT5
Juvenille Emperor Limited
4.99 (70)
Sperimenta una copia di trading eccezionalmente veloce con il   Local Trade Copier EA MT5 . Con la sua facile configurazione in 1 minuto, questo copiatore di trading ti consente di copiare i trades tra diversi terminali di MetaTrader sullo stesso computer Windows o su Windows VPS con velocità di copia ultra veloci inferiori a 0.5 secondi. Che tu sia un trader principiante o professionista,   Local Trade Copier EA MT5   offre una vasta gamma di opzioni per personalizzarlo alle tue esigenze speci
Custom Alerts MT5
Daniel Stein
5 (2)
Custom Alerts è un versatile strumento di monitoraggio multi-mercato che identifica setup promettenti su tutte le otto principali valute (USD, CAD, GBP, EUR, CHF, JPY, AUD e NZD), nonché sull'ORO (XAU), su tutte le 28 coppie Forex e ORO basate su queste valute e su un massimo di sette indici come US30, UK100, WTI, Bitcoin, ecc. È completamente personalizzabile. Lo strumento raccoglie i dati dai nostri indicatori FX Power, FX Volume e IX Power e notifica gli eventi significativi.   Prima di in
Trade Dashboard MT5
Fatemeh Ameri
4.96 (51)
Tired of complex order placement and manual calculations? Trade Dashboard is your solution. With its user-friendly interface, placing orders becomes effortless, by a single click, you can open trades, set stop loss and take profit levels, manage trade lot size, and calculate risk to reward ratios, allowing you to only focus on your strategy. Say goodbye to manual calculations and streamline your trading experience with Trade Dashboard. Download  Demo Version  right now. You can find  Details of
Trade Manager DaneTrades
Levi Dane Benjamin
4.73 (22)
Trade Manager per aiutarti a entrare e uscire rapidamente dalle operazioni calcolando automaticamente il tuo rischio. Incluse funzionalità che ti aiutano a prevenire l'eccessivo trading, il vendetta trading e il trading emotivo. Le operazioni possono essere gestite automaticamente e i parametri di performance del conto possono essere visualizzati in un grafico. Queste caratteristiche rendono questo pannello ideale per tutti i trader manuali e aiuta a migliorare la piattaforma MetaTrader 5. Suppo
Exp COPYLOT CLIENT for MT5
Vladislav Andruschenko
4.08 (24)
Trade copyr per MT5 è un trade copyr per la piattaforma МetaТrader 5   . Copia le negoziazioni forex   tra       eventuali conti   MT5   -   MT5, MT4   -   MT5 per la versione COPYLOT MT5 (o MT4   -   MT4 MT5   -   MT4 per la versione COPYLOT MT4) Fotocopiatrice affidabile! Versione MT4 Descrizione completa   +DEMO +PDF Come comprare Come installare     Come ottenere i file di registro     Come testare e ottimizzare     Tutti i prodotti di Expforex Puoi anche copiare le operazioni nel ter
Telegram To MT5 Receiver
Levi Dane Benjamin
4.86 (7)
Copia i segnali da qualsiasi canale di cui sei membro (compresi quelli privati e ristretti) direttamente sul tuo MT5.  Questo strumento è stato progettato con l'utente in mente offrendo molte funzionalità necessarie per gestire e monitorare gli scambi. Questo prodotto è presentato in un'interfaccia grafica facile da usare e visivamente accattivante. Personalizza le tue impostazioni e inizia ad utilizzare il prodotto in pochi minuti! Guida per l'utente + Demo  | Versione MT4 | Versione Discord
The product will copy all telegram signal to MT5 ( which you are member) , also it can work as remote copier.  Easy to set up, copy order instant, can work with almost signal formats, image signal,  s upport to translate other language to English Work with all type of channel or group, even channel have "Restrict Saving Content", work with  multi channel, multi MT5 Work as remote copier: with signal have ticket number, it will copy exactly via ticket number. Support to backtest signal. How to s
MT5 to Telegram Signal Provider è un'utilità facile da usare e completamente personalizzabile che consente l'invio di segnali specificati a una chat, canale o gruppo Telegram, rendendo il tuo account un fornitore di segnali. A differenza della maggior parte dei prodotti concorrenti, non utilizza importazioni DLL. [ Dimostrativo ] [ Manuale ] [ Versione MT4 ] [ Versione Discord ] [ Canale Telegram ] Configurazione Una guida utente passo-passo è disponibile. Nessuna conoscenza dell'API di Telegr
VirtualTradePad One Click Trading Panel
Vladislav Andruschenko
4.56 (64)
Pannello di trading per il trading in 1 clic.   Lavorare con posizioni e ordini!   Trading dal grafico o dalla tastiera. Con il nostro pannello di trading, puoi eseguire operazioni con un solo clic direttamente dal grafico ed eseguire operazioni di trading 30 volte più velocemente rispetto al controllo MetaTrader standard. I calcoli automatici di parametri e funzioni rendono il trading più veloce e conveniente per i trader. Suggerimenti grafici, etichette informative e informazioni complete sugl
-25% discount ($199 -> $149) Advanced trading tool: One click smart orders that execute under your conditions Developed by trader for trading community:  position size calculator (lot size), open position after price action, strategy builder, set and forget trading, mobile notifications... Risk Management -  Risk percentage position size calculator, gain percentage, target risk reward ratio, spread and commissions are included in calculations 7 Advanced order types  - Set and forget trading w
Trading Chaos Expert
Gennadiy Stanilevych
5 (10)
This software has no equals in the world and represents a universal trade "console" covering trading signals, automated market entry, setting of Stop Loss and Take Profit, as well as Trailing Profit for multiple trades at the same time in a single open window. Intuitive control of the Expert Advisor in "three clicks" ensures a comprehensive use of all its functions on different computers, including tablets PCs. Interacting with additional signal indicators that mark the chart to give a real mark
Trade Assistant 38 in 1
Makarii Gubaydullin
4.89 (18)
Questo è uno strumento multifunzionale: ha più da 65 funzioni, tra cui possiamo citare alcuni come: calcolatrice della dimensione del Lot, azione sui prezzi, rapporto R/R, gestore commerciale, zone di domanda e offerta Versione demo   |   Manuale d'uso   |   MT4 L'utilità non funziona nel tester di strategia: puoi scaricare   la versione demo QUI   per testare il prodotto. Se hai qualsiasi domanda / idea di miglioramento o anche nel caso di trovare un bug, ti prego di   contattarmi   appena p
Risk Manager for MT5
Sergey Batudayev
4.5 (14)
Expert Advisor Risk Manager per MT5 è un programma molto importante e secondo me necessario per ogni trader. Con questo Expert Advisor sarai in grado di controllare il rischio nel tuo conto di trading. Il controllo del rischio e del profitto può essere effettuato sia in termini monetari che in termini percentuali. Affinché l'Expert Advisor funzioni, è sufficiente allegarlo al grafico della coppia di valute e impostare i valori di rischio accettabili nella valuta del deposito o in % del sald
Trade copier MT5
Alfiya Fazylova
4.48 (27)
Trade Copier è un'utilità professionale progettata per copiare e sincronizzare le transazioni tra conti di trading. La copiatura avviene dal conto/terminale del fornitore al conto/terminale del destinatario, che sono installati sullo stesso computer o vps. Prima di acquistare, puoi testare la versione demo su un account demo. Versione demo qui . Istruzioni complete qui . Funzionalità e vantaggi principali: Supporta la copia degli ordini: MT5> MT5, MT4> MT5, MT5> MT4, inclusi i conti di compensaz
Cerberus Equity Watcher
Samuel Bandi Roccatello
5 (2)
Cerberus the Equity Watcher è uno strumento di gestione del rischio che monitora costantemente il valore della tua equity ed evita grosse perdite causate da EA difettosi o dall'emotivitá. È estremamente utile per i trader sistematici che si affidano a EA che potrebbero contenere bug o che potrebbero non funzionare bene in condizioni di mercato impreviste. Cerberus ti consente di impostare un valore minimo della equity e (opzionalmente) un valore massimo, se uno di questi valori viene raggiunto,
Take a Break MT5
Eric Emmrich
4.75 (16)
The most advanced news filter and drawdown limiter on MQL market NEW: Take a Break can be backtested against your account history! Check the " What's new " tab for details. Take a Break has evolved from a once simple news filter to a full-fledged account protection tool. It pauses any other EA during potentially unfavorable market conditions and will continue trading when the noise is over. Typical use cases: Stop trading during news/high volatility (+ close my trades before). Stop trading when
DrawDown Limiter
Haidar, Lionel Haj Ali
5 (18)
Drawdown Limiter EA You are in the right place if you were searching for Drawdown control, Drawdown limiter, Balance protection, Equity Protection or Daily Drawdown Limit related to Prop Firm, FTMO, or Funded account trading, or if you want to protect your trading account. Have you suffered from controlling your drawdown when trading funded accounts? This EA is meant for you. Prop firms usually set a rule called “Trader Daily Drawdown”, and if it is not respected, you are disqualified.  I am an
MT5 To Telegram Copier
Levi Dane Benjamin
5 (1)
Invia segnali completamente personalizzabili da MT5 a Telegram e diventa un fornitore di segnali! Questo prodotto è presentato in un'interfaccia grafica facile da usare e visivamente attraente. Personalizza le tue impostazioni e inizia a utilizzare il prodotto in pochi minuti! Guida dell'utente + Demo  | Versione MT4  | Versione Discord Se desideri provare una demo, consulta la Guida dell'utente. Il mittente di MT5 a Telegram NON funziona nel tester di strategia. Funzionalità di MT5 a Telegr
HINN Lazy Trader
Georg Vahi
5 (1)
Set price targets, and leave everything else to HINN Lazy Trader! This tool is designed for automatic position sizing from specified levels to designated targets. Using a VPS is recommended (*). The demo version   limited in functionality, be sure to watch this video before using -->  https://youtu.be/geLQ6dUzAr8 A community for users, product discussion, update news, and first line of support are organized in a free Discord: https://discord.gg/zFhEZc7QDQ Use Webmoney For payments in cryptocu
Hedge Ninja
Robert Mathias Bernt Larsson
3 (2)
Make sure to join our Discord community over at www.Robertsfx.com , you can also buy the EA at robertsfx.com WIN NO MATTER IN WHICH DIRECTION THE PRICE MOVES This robot wins no matter in which direction the price moves by following changing direction depending on in which direction price moves. This is the most free way of trading to this date. So you win no matter which direction it moves (when price moves to either of the red lines as seen on the screenshot, it wins with the profit target yo
The top-selling EAs on the market cost a lot and one day they are suddenly gone. This is because one strategy will not work in the forex market all the time. Our product is unique from all others in the MQL Marketplace because our EA comes with 34+ built-in indicators that allow develop strategies every time.  You build your strategy and keep updating it. If one strategy does not work, simply build another all using only one EA. This is All-In-One EA   in this market place. You can use as trade
RiskGuard Management
MONTORIO MICHELE
5 (14)
ATTENZIONE l'expert non funziona in strategy tester, per una versione di prova visita il mio profilo. Manuale per il Download del journal automatico visita il mio profilo RiskGuard Management   RiskGuard management nasce con l’idea di aiutare i trader dal proprio percorso iniziale fino ad essere dei trader esperti e consapevoli. Compatibile con qualsiasi sistema operativo che sia Mac o Windows. Il pannello per le operazioni è integrato nel grafico dando la possibilità di scegliere dimensioni e
Grid Manual MT5
Alfiya Fazylova
4.88 (16)
Grid Manual è un pannello di trading per lavorare con una griglia di ordini. L'utilità è universale, ha impostazioni flessibili e un'interfaccia intuitiva. Funziona con una griglia di ordini non solo nella direzione delle perdite, ma anche nella direzione dell'aumento dei profitti. Il trader non ha bisogno di creare e mantenere una griglia di ordini, lo farà l'utilità. È sufficiente aprire un ordine e il manuale di Grid creerà automaticamente una griglia di ordini per esso e lo accompagnerà fino
Il MT5 to Discord Signal Provider è uno strumento facile da usare e completamente personalizzabile, progettato per inviare segnali di trading direttamente a Discord. Questo strumento trasforma il tuo account di trading in un efficiente fornitore di segnali. Personalizza i formati dei messaggi secondo il tuo stile! Per facilitarne l'uso, seleziona tra i modelli pre-progettati e scegli quali elementi del messaggio includere o escludere. [ Demo ] [ Manuale ] [ Versione MT4 ] [ Versione Telegram ]
Risk Manager Pro MT5
Roman Zhitnik
5 (2)
The Expert Advisor is a risk manager helping users to control their trading. In the settings, it is possible to specify the parameters at which the risk manager force closes the opened trades and closes the terminal as well, if it is needed to prevent opening trades on emotions, which do not correspond to the trading strategy. Risk Manager settings Check limit to close   - check the equity limit Limit to close   - equity limit that is taken into account Check day limit to close   - check the
Profit or Loss Pad
Vladislav Andruschenko
4.5 (10)
Chiusura delle posizioni in MetaTrader 5 al raggiungimento del profitto/perdita totale con la funzione di trailing del profitto.   CloseIfProfitorLoss con Trailing Puoi abilitare le   fermate virtuali (ordine separato)   , calcolo e chiusura per le posizioni   ACQUISTA e VENDI separatamente (Separate BUY SELL)   , chiudendo e calcolando   tutti i simboli o solo il simbolo corrente (Tutti i simboli)   , abilita il trailing for profit (   Trailing   Profit) Le posizioni vengono chiuse in base a u
Price Action Trade Panel EA MT5
Juvenille Emperor Limited
5 (4)
Price Action Trade Panel MT5   calcola il saldo del livello della forza di acquisto/vendita di qualsiasi simbolo/strumento, sulla base dei dati puri sull'azione del prezzo delle candele passate specificate (8 per impostazione predefinita). Questo ti darà il sentimento di mercato più vicino possibile monitorando l'azione del prezzo di 32 simboli/strumenti disponibili sul pannello dell'indicatore. Un livello di forza di acquisto/vendita superiore al 60% fornisce un livello abbastanza solido per l
Altri dall’autore
This product can be used to synchronize multiple Charts, and each Chart can be set to a different sync mode. With this product you can better view and manipulate charts: different time frames for a single Symbol, the same time frame for multiple Symbols... and more. PS: The link below is the FreeDemo product, you can use it on EURUSD/XUAUSD/USDCNH symbol: https://www.mql5.com/en/market/product/38557 Feature: Chart settings  can be synchronized, including : background, indentation, size, etc.
Do you think it's a bit cumbersome when you need to switch symbols or timeframes with mouse click? 1. What is this? This is a program that can switch symbols and timeframes with direction keys. Fast switching, very convenient, no mouse click required. For traders, one symbol with multi-timeframe charts are usually added,  you can change symbol on those charts easily. For multi-currency traders, different symbol charts are usually added, you can also change those timeframes easily. I wrote this p
1. What is this         Rising volatility and falling volatility are not the same, whether it is academic research or actual testing has shown this point.         The original ATR indicator is calculated by putting up and down fluctuations together. This indicator is to calculate separately the upward volatility and the downward volatility, which can better help you study the market. 2. Indicator description          There are two modes for the calculation of this indicator, as shown in the f
Have you ever take a long time to watch a Symbol when the network link is not good ? Have you ever wait for a long time when you switch chart between different Symbols or different TimeFrames ? If you do long-term backtesting , Have you ever to be downloaded datas for a long time ? Yes, If there is no data in the system, those will happen.  1. What is this: Download all the Symbol data in Market Watch to the system. PS: This is not outputting data to Files. This Link go to Demo version: https:
This product can be used to synchronize multiple Charts, and each Chart can be set to a different sync mode. With this product you can better view and manipulate charts: different time frames for a single Symbol, the same time frame for multiple Symbols, system indicators for single/multiple Symbols... and more. Feature: Chart settings can be synchronized, including : background, indentation, size, etc. Multiple Chart window start times  or end times can be synchronized. Multiple Chart time f
I see that many tools in the market deal with Position and Order in the form of operation panels. Which is loaded into a Chart in the form of an EA. However, once the operator panel EA is loaded, no other EAs can be loaded. So, I wrote the one-click operation of Position and Order as a script, so you can load other EAs and easily complete one-click operation of Trade. 1. What is this: This is a one-click script to close position order. Now you can close position tickets at high speed, for examp
I see that many tools in the market deal with Position and Order in the form of operation panels. Which is loaded into a Chart in the form of an EA. However, once the operator panel EA is loaded, no other EAs can be loaded. So, I wrote the one-click operation of Position and Order as a script, so you can load other EAs and easily complete one-click operation of Trade. 1. What is this: This is a one-click script to delete the pending order . Now you can delete pending tickets at high speed, for
According to trading experience: Some symbols are easy to reverse on certain days, such as Monday, or afternoon, and so on. So comparing the current price with the corresponding historical moment price is valuable. If the price coordinate system uses a logarithmic price, you will get a lot of valuable information. 1. What is this? This program can convert the symbol price and add it to your Chart. You can compare it with your major chart. The DEMO version Link: https://www.mql5.com/en/market/p
What is this: Violent trading: means sending a large number of orders to your brokerage server,  it can conduct a stress test of the trading. In this program you can run a variety of trading tests.  Now you can trade at high speed, For example 1000 orders in an instant. The Demo version's link:  https://www.mql5.com/en/market/product/38431/ Why to use: Whether manual trading or EA trading,  the status of the broker server is very important. So it is beneficial to conduct a trading stress test on
1. Why did I develop this series of indicators I found that most traders need to use multiple time frame indicators. They usually switch time frame to see indicators. However, once the timeframe is switched, you cannot see the  corresponding relationship  between  the price in the smaller timeframe  and  the indicator in the larger timeframe . For example: if your price chart is in H1 timeframe, you can see H4, D1 and W1 indicators in H1 timeframe Chart. This is more helpful for you to find t
Filtro:
[Eliminato] 2019.02.21 09:31 
 

L'utente non ha lasciato alcun commento sulla valutazione.

[Eliminato] 2019.02.21 09:29 
 

L'utente non ha lasciato alcun commento sulla valutazione.

Rispondi alla recensione
Versione 1.6 2020.06.06
recompiled for MT5 update.
Versione 1.5 2020.02.18
A large update, now you can change other chart.
//The following options are used to change other open charts:
input bool OtherOpenChart_Symbol = false; //Change symbol on other open chart?
input bool OtherOpenChart_TimeFrame = false; //Change timeframe on other open chart?
input int PermitCount = 0; //Just change the count of initially opened chart. 0 means all.

PS:
I must tell you, When switching between multi charts, the system will download the data, If your system doesn't have data, it will download the data and sometime will cause slowdowns. That is the limited of MT5/MT4 client.
Versione 1.4 2020.02.14
Change TurnOn parameter to :
bool TurnOn_UpDown=true; // Turn on the UP/DOWN key function to change Symbol.
bool TurnOn_LeftRight=true; // Turn on the LEFT/RIGHT key function to change TimeFrame.
Now, you can choose the change mode.
Versione 1.3 2020.01.31
add the parameter to turn on/off the directional key funcion.
Versione 1.2 2019.10.28
If you add this indicator more than once, the system will alert you.
Versione 1.1 2019.10.24
Hide the text, and move it to program description.