EMA Separation
- 지표
- Libertas LLC
- 버전: 1.2
- 업데이트됨: 1 12월 2021
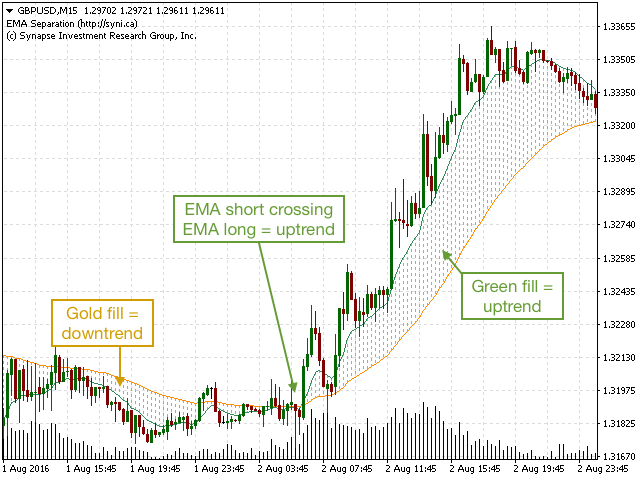
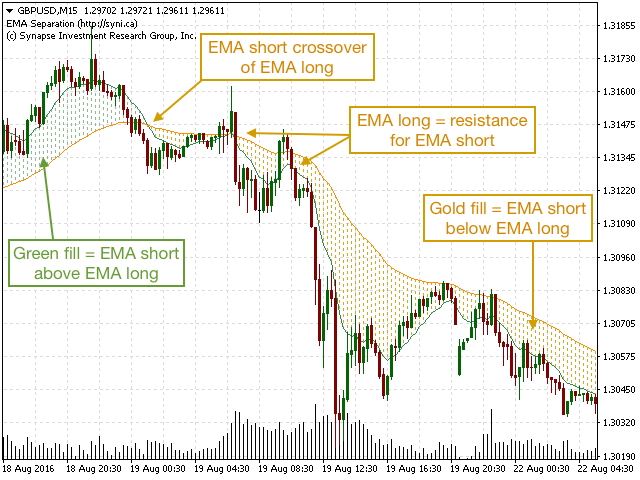
EMA Separation plots 2 exponential moving averages, and a fill between them. The fill is colored differently according to an uptrend (short period EMA above long period EMA), or a downtrend (short period EMA below long period EMA). This is a small tool to help visualize the difference between long and short period averages. We hope you enjoy!
EMA Separation can also be paired with our free EMA Separation Coefficient
Parameters
- Short period (Default=10): # bars used to calculate short period EMA
- Long period (Default=50): # bars used to calculate long period EMA

1 Star (20%) = Bad
2 Star (40%) = Undecided
3 Star (60%) = Acceptable
4 Star (80%) = Good
5 Star (100%) = Excellente!