• Información general
  • Comentarios (2)
  • Discusión (13)
  • Novedades

EMA Separation

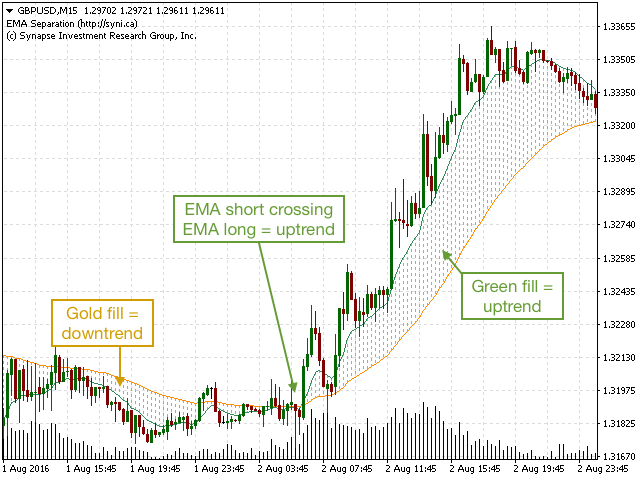
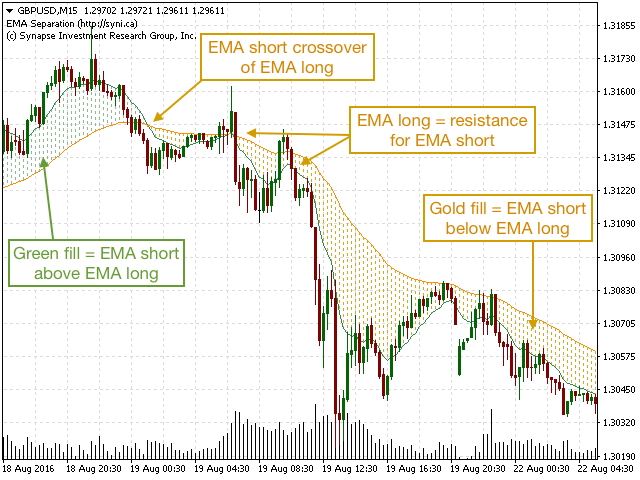
EMA Separation plots 2 exponential moving averages, and a fill between them. The fill is colored differently according to an uptrend (short period EMA above long period EMA), or a downtrend (short period EMA below long period EMA). This is a small tool to help visualize the difference between long and short period averages. We hope you enjoy!

EMA Separation can also be paired with our free EMA Separation Coefficient


Parameters

  • Short period (Default=10): # bars used to calculate short period EMA
  • Long period (Default=50): # bars used to calculate long period EMA
Productos recomendados
SMAconfirm
Muhammad Robith
This indicator helps you to comfirm SMAs' crossovers by draw a signal line that determines SMA movement direction. when Short SMA cross above Long SMA and Close price is above the signal several bars later, then uptrend is expected. when Short SMA cross below Long SMA and Close price is below the signal several bars later, then downtrend is expected. Input Description :  MA_Period_short: Short-term SMA's period. Used for short-term PriceX. Must be higher than 1.  MA_Period_long: Long-term SMA'
FREE
This indicator is producing accurate signal based on distances between crossection     point of 571 period moving average with 632 period bollinger band and 17 moving average and 171 moving average.     You can also use this signal with expert advisor with below code      double v1= 0 ;     v1= GlobalVariableGet ( Symbol ()+ string ( Period ())+ "HSKPASHAVO1" );      if (v1== 0 )   return ( 0 ); // No Signals      if (v1== 1 )        {        //Send BUY Order...        GlobalVariableSet ( Symbo
The Mono Waves indicator is designed to display the wave behavior of the market on a chart. Its appearance is presented on slide 1.   This indicator uses the PPPC (Point-Percent Price Channel) indicator, which can be downloaded for free from the Market .             When the market moves up, the upper border of the price channel is built on High candlestick prices (for more details, see the description of the PPPC indicator at the link given above). The higher the High prices rise, t
FREE
ADX Crosses Signals
Nedyalka Zhelyazkova
The indicator provides buy and sell signals on the charts every time ADX DI- and DI+ crosses each other. Blue arrow for uptrend (DI+>DI-). Red arrow for downtrend (DI->DI+). This technical analysis tool can be applied to various trading strategies.  The   ADX Crosses Signals Indicator   is based on the Average Directional Index Metatrader Indicator. The ADX is a lagging indicator, meaning that a trend must already be established before the index can generate its signal. Inputs PERIOD; AlertOn
FREE
[La desviación de cada indicador MT4] es una colección de 18 indicadores, y uno de ellos puede seleccionarse arbitrariamente para participar en el cálculo. Puede calcular la forma de desviación de cada indicador y puede provocar una alarma. Descripción del ajuste de parámetros: [indicadores] es elegir uno de los 18 indicadores para participar en el cálculo (este parámetro es muy importante) . [período] es un ciclo común para cada indicador. [Método] es el modo MA de algunos indicadores
FREE
TwoMA Crosses
Nedyalka Zhelyazkova
TwoMA Crosses indicator displays arrows based on whether the short term moving average crosses above or below the long term moving average. A moving average doesn't predict price direction. Instead, it defines the current direction. Despite this, investors use moving averages to filter out the noise. Traders and investors tend to use the EMA indicator, especially in a highly volatile market because it’s more sensitive to price changes than the SMA. Download for FREE  TwoMA Crosses  EA from th
FREE
TIbors Timer
Tibor Hartmut Sturm
Indikator zur klaren Anzeige im Metatrader Dieser Indikator wurde von mir Entwickelt damit die Anzeige der relevanten Parameter klar und deutlich im Chart auf einen Blick zu sehen ist.  Er dient zur Information und ist ohne Gewähr.  Folgende Parameter werden angezeigt: -   Der  Aktuelle Kurs - Das Aktuelle Handelspaar - Die Restzeit zur nächsten Kerzenbildung / Zum Abschluss der Aktuellen Kerze - Die Kontonummer des Handelskontos - Die Frei Verfügbare Margin - Die Margin auf 1 Lot - Der Akt
FREE
Special Trend Oscillator is an indicator designed to detect trend change points and measure the power of the current trend. This indicator is a different model of the MACD indicator. The indicator has two channels. The blue channel is the upper line of the upward trend. The red channel line is the underscore of the downward trend. Buy when the trend line reaches the red line. Sell when the trend line reaches the blue line. Our Popular Products Super Oscillator HC Cross Signal Super Cross Trend S
FREE
Growing Bands Sh
Nikolay Likhovid
3 (2)
Do you use dynamic ranges (like Bollinger Bands or Envelopes) in your trading? A fixed period is usually used for such calculations. But is such approach relevant to the very nature of the market? In fact, the price chart consists of a series of successive processes - trends and flats. In this case, we can talk about the internal development logic inside a single process only. Therefore, the nature of the market is better described by dynamic ranges designed for the processes occurring "here and
FREE
This indicator allows to hide Ichimoku Kinko Hyo (on all MT4 timeframes) from a date define by the user, with a vertical line (Alone) or a panel (with "Hidden Candles"). Indicator Inputs: Tenkan-sen Kijun-sen  Senkou Span B Information on "Ichimoku Kinko Hyo" indicator is available here:   https://www.metatrader4.com/en/trading-platform/help/analytics/tech_indicators/ichimoku ************************************************************* Hey traders!!  Give me your feeds!  We are a community here
FREE
FxSProMT
Sergiy Podolyak
5 (1)
The FxSProMT indicator shows the current market trend and trend change. Indicator Parameters Ind_Period - the number of previous bars used to calculate actual values. Number_Bars - the number of bars to display the indicator.. Too many bars may significantly slow down the operation of the trading terminal. Signal_Sound - sound alert to notify of trend change. The sound can be played multiple times until the signal is confirmed (the bar closes). Default is disabled. Signal_Alert - an alert to n
FREE
Italo Trend Indicator
Italo Santana Gomes
4.75 (32)
BUY INDICATOR AND GET EA FOR FREE AS A BONUS + SOME OTHER GIFTS! ITALO TREND INDICATOR  is the best trend indicator on the market, the Indicator works on all time-frames and assets, indicator built after 7 years of experience on forex and many other markets. You know many trend indicators around the internet are not complete, does not help, and it's difficult to trade, but the Italo Trend Indicator is different , the Italo Trend Indicator shows the signal to buy or sell, to confirm the signal t
This is a regression tree indicator for MT4/MT5. This indicator classificate nodes on the time period so that the deviation becomes smaller, and displays regression line and channel for each node. It's free! Attached CartDemo.ex4 and CartDemo.ex5 is a Demo version and has the following limitations: Method is RandomForest only Maximum number of bars is 200 Maximum number of trees is 2 Maximum tree depth is 2 Calculated waste lines are shown Not display correlation coefficients Fu
FREE
The range indicator means the average daily price movement. For convenience, it is visually displayed on the charts, but with the H4 timeframe and below. The indicator is redrawn daily and the gaps are included in the calculation. An additional dotted line means 80% of the daily movement passed. An important tool in the arsenal of a professional trader or someone who wants to become one. PrimeTools is a series of products designed for correct and professional trading. [ PrimeTools Levels | Prim
FREE
WindFlow HTF
Carmine Pinto
5 (1)
WindFlow HTF is a useful tool suited to use in conjunction together with my WindFlow indicator. This indicator will give you a background vision about the price action trend on a higher timeframe, so when it runs with the WindFlow indicator you have an almost complete trading solution. At this point, you only need some support/resistance analysis and a bit of focus to become a consistent trader. The metaphorical "wind's ballet" Professional traders know that every timeframe is governed by its
FREE
Heikin Ashi Premium
Frederick Langemark
5 (10)
Heikin Ashi is Japanese for "average bar", and may make it easier for you to identify trends. Our version of this popular indicator adjusts the size of the candles based on the zoom level of your chart, making it appear more naturally just like the traditional candlesticks. The colors are selected based on the color scheme you use on your charts, but can be customized anyway you would like. You may also choose whether to display only the Heikin Ashi candles, or show the other selected chart as w
FREE
MA Crosses Show
Faran Ataeiraveshti
Hello.  Another free indicator from Sepehr! ;) You can determine the trend with this tool. Using crosses of two Moving averages, you can say that the trend is going to be bullish or bearish; A fast-moving average and a slow one. When the fast-moving crosses up the slow-moving, it's going to be an uptrend and when it crosses down the slow-moving, it means that you are going to have a downtrend. That's easy ;) Hope to enjoy it Sepehr(Faran)
FREE
Day Bar Info
Nikolay Frolov
4.67 (30)
The indicator 'draws' a daily, weekly or monthly candlestick on the current chart. Shows in points the sizes of the upper and lower shadows, the body and the entire candlestick. Real time work. Works in the strategy tester. Indicator parameters: How_much_to_show - how many blocks to show. Block_period - block period (day / week / month) Shift - shift from the edge of the chart in bars. language - language selection.
FREE
This indicator prepared by using 1311,2840 days moving average and Calculates the Envelopes.    This system can be used for 15M time frame.     This system is for Long term and profitable.    Signals are shown as arrows. as an optional,    you can set a voice alarm or email notification    You can fins our other products from link : https://www.mql5.com/en/users/drbastem/seller    Also, you can ask all your questins from email : haskayafx@gmail.com or mobile : +90 530 867 5076 or @MehmetBastem
MA MTF Overlay Chart   is software that allows you to overlay the candlestick chart of a financial instrument with a second candlestick chart of the same one, or of another, financial instrument, by setting a different timeframe from that of the basic chart. The software is very simple to use and the input parameters are listed below. Input parameters: Overlay chart set-up Financial instrument :   financial instrument that you want to overlay on the base chart Time period :   secondary instrum
FREE
CYCLE WAVE OSCILLATOR indicator is an indicator based on cyclical price fluctuations. This indicator can help you determine overbought and oversold levels, and help you predict price trends within the cycle. MT5 Version here!  You can combine it with our indicators below to make your trading decisions more accurate: Supply Demand Ribbon MT4 Basic Feature: - Three Trend Types: + Zero + Basic + Advanced
FREE
MA Dev Chanel
Alexandr Gladkiy
Индикатор показывает максимальное отклонение от скользящей средней за заданный период. Границы канала могут послужить своего рода зонами перекупленности/перепроданности, от которых может произойти откат цены к центру канала. За этими уровнями и стоит искать дополнительные сигналы для входа в сделку.  В настройках индикатора всего 2 параметра -  период, за который будет расчитываться индикатор и метод усреднения скользящей средней.
FREE
Power Trend Free
Yurij Kozhevnikov
5 (2)
Power Trend Free - the indicator shows the trend strength in the selected period. Input Parameters The indicator has three input parameters: Period - a positive number greater than one, it shows the number of candlesticks used for calculations. If you enter one or zero, there will be no error, but the indicator will not be drawn. Applied Price - the standard "Apply to:" set meaning data used for the indicator calculation: Close - Close prices; Open - Open prices; High - High prices; Low - Low
FREE
Индикатор сглаженного DeMarker  Oscillator (xDeM) Входные параметры: Period - период усреднения Принцип работы Индикатор перерассчитывает стандартный технический индикатор DeMarker Oscillato r (дважды усредняет получаемые значения). Период усреднения индикатора соответствует двойному периоду стандартного DeMarker  Oscillato r . Например : xDeM с периодом усреднения 7 соответствует DeM c периодом 14. Индикаторный буфер не перерисовывается.
FREE
The   Heikin Ashi indicator   is our version of the Heikin Ashi chart. Unlike competitor products, this indicator offers extensive options for calculating Heikin Ashi candles. In addition, it can be displayed as a classic or smoothed version. The indicator can calculate Heikin Ashi with moving average by four methods: SMA  - Simple Moving Average SMMA  - Smoothed Moving Average EMA  - Exponential Moving Average LWMA  - Linear Weighted Moving Average Main features The indicator shows Heikin
FREE
With the MACD Multi Time Frame indicator, you can spot divergences of higher timeframes while you are searching for pinpointed entries on lower timeframes. This FREE version of the indicator works only on EURUSD and GBPUSD. The full version of the indicator can be found here: MACD Multi Time Frame This blog post gives you REAL-TIME MACD Divergence Analysis for FREE and tips how to trade the divergences: REAL-TIME MACD Divergence Analysis The MACD Multi Time Frame gives you a very good overview o
FREE
Trend Based Fibo MT4
Nguyen Tuan Son
3 (1)
The most Flexible & Reliable   Trend-Based Fibonacci indicator by Safe Trading. This indicator helps you calculate Trend-Based Fibonacci levels base on the main and retracement trends to predict future price . If you just looking for a simple Fibonacci Retracement indicator, please use  this Free indicator . ### FEATURES ### Auto-calculate up to 7 Trend-Based Fibonacci levels on adjustable frame. Adjust Fibonacci levels as your need. Adjust the start and the end of calculated frame in indicato
FREE
Acceleration/Deceleration Technical Indicator (AC) measures acceleration and deceleration of the current driving force. This indicator will change direction before any changes in the driving force, which, it its turn, will change its direction before the price. If you realize that Acceleration/Deceleration is a signal of an earlier warning, it gives you evident advantages. But, a classical AC indicator does not include any input parameter. In the source file we can see that this indicator are us
FREE
GTAS STrend
Riviera Systems
4.5 (2)
GTAS S-Trend is a momentum indicator that helps to determine trends using combination of MACD, RSI and moving averages. This indicator was created by Bernard Prats Desclaux, proprietary trader and ex-hedge fund manager, founder of E-Winvest. Description The indicator oscillates between -65 and +65 with a neutral zone between -25 and +25 around a 0 equilibrium line. S-Trend between -25 and +25 indicates congestion zones with a bullish bias between 0 and +25, and a bearish bias between 0 and -25
FREE
The resistance and support lines are the position where the price will have a change, be it a breakout to follow the trend or reverse. The price rule will go from support to resistance and Long's resistance can be Short's support and the opposite is true. Accurately identifying support and resistance lines is the key to being able to trade well and profitably. This indicator is based on the Fractals indicator, the indicator will be redrawn by 2 candles. *Great For Swing Trading *Blue is Support
Los compradores de este producto también adquieren
Gann Made Easy
Oleg Rodin
4.85 (82)
Gann Made Easy es un sistema de comercio de Forex profesional y fácil de usar que se basa en los mejores principios de comercio utilizando la teoría del Sr. W. D. Gann. El indicador proporciona señales precisas de COMPRA y VENTA, incluidos los niveles de Stop Loss y Take Profit. Puede comerciar incluso sobre la marcha utilizando notificaciones PUSH. ¡Por favor, póngase en contacto conmigo después de la compra! ¡Compartiré mis consejos comerciales con usted y excelentes indicadores de bonificació
- Real price is 80$ - 40% Discount ( It is 49$ now ) Contact me for instruction, add group and any questions! Related Product:  Bitcoin Expert , Gold Expert Introduction The breakout and retest strategy is traded support and resistance levels. it involves price breaking through a previous level.  The break and retest strategy is designed to help traders do two main things, the first is to avoid false breakouts. Many false breakouts start with a candlestick that breaks out of a level but ends wi
Atomic Analyst
Issam Kassas
5 (2)
En primer lugar, vale la pena enfatizar que este Indicador de Trading no repinta, no redibuja y no se retrasa, lo que lo hace ideal tanto para el trading manual como para el automatizado. Manual del usuario: configuraciones, entradas y estrategia. El Analista Atómico es un Indicador de Acción del Precio PA que utiliza la fuerza y el impulso del precio para encontrar una mejor ventaja en el mercado. Equipado con filtros avanzados que ayudan a eliminar ruidos y señales falsas, y aumentan el poten
Scalper Inside PRO
Alexey Minkov
4.73 (56)
An exclusive indicator that utilizes an innovative algorithm to swiftly and accurately determine the market trend. The indicator automatically calculates opening, closing, and profit levels, providing detailed trading statistics. With these features, you can choose the most appropriate trading instrument for the current market conditions. Additionally, you can easily integrate your own arrow indicators into Scalper Inside Pro to quickly evaluate their statistics and profitability. Scalper Inside
Gold Stuff
Vasiliy Strukov
4.89 (239)
Gold Stuff: un indicador de tendencia diseñado específicamente para el oro, también se puede usar en cualquier instrumento financiero. El indicador no se vuelve a dibujar ni se retrasa. El marco de tiempo recomendado es H1. Este indicador está escrito por EA Gold Stuff Advisor, puede encontrarlo en mi perfil.  Puede obtener una copia gratuita de nuestro indicador Strong Support y Trend Scanner, por favor envíe un mensaje privado. ¡a mí! IMPORTANTE! Póngase en contacto conmigo inmediatamente d
¡Actualmente 20% OFF ! ¡La mejor solución para cualquier novato o trader experto! Este software funciona con 28 pares de divisas. Se basa en 2 de nuestros principales indicadores (Advanced Currency Strength 28 y Advanced Currency Impulse). Proporciona una gran visión general de todo el mercado de divisas. Muestra los valores de Advanced Currency Strength, la velocidad de movimiento de las divisas y las señales para 28 pares de divisas en todos los (9) marcos temporales. Imagine cómo mejorar
Enigmera
Ivan Stefanov
5 (3)
ENIGMERA: El núcleo del mercado https://www.enigmera.com Introducción Este indicador y sistema de negociación es un enfoque extraordinario de los mercados financieros. ENIGMERA utiliza los ciclos fractales para calcular con precisión los niveles de soporte y resistencia. Muestra la auténtica fase de acumulación y proporciona dirección y objetivos.  Un sistema que funciona tanto si estamos en una tendencia como en una corrección.  ¿Cómo funciona? ENIGMERA consta de tres líneas: la línea de s
TPSproTREND PrO
Roman Podpora
4.79 (19)
TPSpro TREND PRO   es un indicador de tendencia que analiza automáticamente el mercado y proporciona información sobre la tendencia y cada uno de sus cambios, además de dar señales para ingresar operaciones sin volver a dibujar. El indicador utiliza cada vela, analizándolas por separado. refiriéndose a diferentes impulsos: impulso hacia arriba o hacia abajo. ¡Puntos de entrada exactos a transacciones de divisas, criptomonedas, metales, acciones e índices! Versión MT5                   DESCRIPCI
Dynamic Forex28 Navigator: la herramienta de trading de Forex de última generación. ACTUALMENTE CON UN 49 % DE DESCUENTO. Dynamic Forex28 Navigator es la evolución de nuestros indicadores populares de larga data, que combina el poder de tres en uno: Indicador avanzado Currency Strength28 (695 reseñas) + Indicador avanzado Currency IMPULSE con ALERT (520 reseñas) + Señales combinadas CS28 (bonificación). Detalles sobre el indicador https://www.mql5.com/en/blogs/post/758844 ¿Qué ofrece el i
Trend Punch
Mohamed Hassan
4.95 (19)
This indicator is unstoppable when combined with our other indicator called  Support & Resistance . After purchase, send us a message and you will get it   for  FREE as a BONUS! Introducing Trend Punch , the revolutionary forex trend indicator that will transform the way you trade! Trend Punch is uniquely designed to provide precise buy and sell arrows during strong market trends, making your trading decisions clearer and more confident. Whether you're trading major currency pairs or exotic sym
Trend Screener
STE S.S.COMPANY
4.8 (87)
Indicador de tendencia, solución única e innovadora para el comercio y filtrado de tendencias con todas las funciones de tendencias importantes integradas en una sola herramienta. Es un indicador 100% sin repintar de marcos temporales y monedas múltiples que se puede usar en todos los símbolos/instrumentos: divisas, materias primas, criptomonedas, índices y acciones. OFERTA POR TIEMPO LIMITADO: El indicador de detección de soporte y resistencia está disponible por solo 50$ y de por vida. (Precio
FX Volume
Daniel Stein
4.58 (33)
Obtenga su actualización diaria del mercado con detalles y capturas de pantalla a través de nuestro Morning Briefing aquí en mql5 y en Telegram ! FX Volume es el PRIMER y ÚNICO indicador de volumen que proporciona una visión REAL del sentimiento del mercado desde el punto de vista de un bróker. Proporciona una visión impresionante de cómo los participantes institucionales del mercado, como los brokers, están posicionados en el mercado Forex, mucho más rápido que los informes COT. Ver esta info
TPSpro RFI Levels
Roman Podpora
4.82 (22)
INSTRUCCIONES      RUSO  -  ING     Se recomienda utilizar con un indicador.   -    TPSpro   TENDENCIA PRO -   Versión MT5 Un elemento clave en el trading son las zonas o niveles desde los que se toman las decisiones de compra o venta de un instrumento de trading. A pesar de los intentos de los principales actores de ocultar su presencia en el mercado, inevitablemente dejan rastros. Nuestra tarea era aprender a identificar estos rastros e interpretarlos correctamente. Funciones principales: ¡Mo
FX Power MT4 NG
Daniel Stein
5 (13)
Obtenga su actualización diaria del mercado con detalles y capturas de pantalla a través de nuestro Morning Briefing aquí en mql5 y en Telegram ! FX Power MT4 NG es la nueva generación de nuestro popular medidor de fuerza de divisas, FX Power. ¿Y qué ofrece este medidor de fuerza de nueva generación? Todo lo que le encantaba del FX Power original PLUS Análisis de fuerza de ORO/XAU Resultados de cálculo aún más precisos Períodos de análisis configurables individualmente Límite de cálculo persona
Ante todo, vale la pena enfatizar que esta Herramienta de Trading es un Indicador No Repintado, No Redibujado y No Retrasado, lo que la hace ideal para el trading profesional. Curso en línea, manual del usuario y demostración. El Indicador de Conceptos de Acción del Precio Inteligente es una herramienta muy potente tanto para traders nuevos como experimentados. Combina más de 20 indicadores útiles en uno solo, combinando ideas avanzadas de trading como el Análisis del Trader del Círculo Interio
Ultimate Gold Advisor para MetaTrader 4 El Ultimate Gold Advisor es una herramienta tecnológica avanzada diseñada para optimizar la experiencia de trading en MetaTrader 4. Creada para satisfacer las necesidades de los traders más experimentados, este indicador combina precisión, análisis sofisticado y funcionalidad versátil, ofreciendo soporte para tomar decisiones de trading informadas. Ideal para el trading de oro, pero también aplicable a una amplia gama de activos, el Ultimate Gold Advisor p
Stratos Pali
Michela Russo
5 (1)
Stratos Pali Indicator   is a revolutionary tool designed to enhance your trading strategy by accurately identifying market trends. This sophisticated indicator uses a unique algorithm to generate a complete histogram, which records when the trend is Long or Short. When a trend reversal occurs, an arrow appears, indicating the new direction of the trend. Important Information Revealed Leave a review and contact me via mql5 message to receive My Top 5 set files for Stratos Pali at no cost! D
Legacy of Gann
Pavel Zamoshnikov
4.83 (12)
The indicator very accurately determines the levels of the possible end of the trend and profit fixing. The method of determining levels is based on the ideas of W.D.Gann, using an algorithm developed by his follower Kirill Borovsky. Extremely high reliability of reaching levels (according to K. Borovsky  - 80-90%) Indispensable for any trading strategy – every trader needs to determine the exit point from the market! Precisely determines targets on any timeframes and any instruments (forex, met
Gold Channel is a volatility-based indicator, developed with a specific timing algorithm for the XAUUSD pair, which consists of finding possible corrections in the market. This indicator shows two outer lines, an inner line (retracement line) and an arrow sign, where the theory of the channel is to help identify overbought and oversold conditions in the market. The market price will generally fall between the boundaries of the channel. If prices touch or move outside the channel it is a tra
Currency Strength Wizard es un indicador muy poderoso que le proporciona una solución todo en uno para operar con éxito. El indicador calcula el poder de este o aquel par de divisas utilizando los datos de todas las monedas en múltiples marcos de tiempo. Estos datos se representan en forma de índice de moneda fácil de usar y líneas eléctricas de moneda que puede usar para ver el poder de esta o aquella moneda. Todo lo que necesita es adjuntar el indicador al gráfico que desea operar y el indicad
GOLD Impulse with Alert
Bernhard Schweigert
4.56 (9)
Este indicador es una super combinación de nuestros 2 productos Advanced Currency IMPULSE with ALERT  +   Currency Strength Exotics . ¡Funciona para todos los marcos de tiempo y muestra gráficamente el impulso de fuerza o debilidad para las 8 divisas principales más un Símbolo! Este Indicador está especializado en mostrar la aceleración de la fuerza de la divisa para cualquier símbolo como Oro, Pares Exóticos, Materias Primas, Índices o Futuros. Es el primero de su clase, cualquier símbol
Scalper Vault
Oleg Rodin
5 (27)
Scalper Vault es un sistema profesional de reventa que le brinda todo lo que necesita para una reventa exitosa. Este indicador es un sistema comercial completo que puede ser utilizado por operadores de divisas y opciones binarias. El marco de tiempo recomendado es M5. El sistema le proporciona señales de flecha precisas en la dirección de la tendencia. También le proporciona señales superiores e inferiores y niveles de mercado de Gann. Los indicadores proporcionan todo tipo de alertas, incluidas
Market Structure
Reza Aghajanpour
4.85 (26)
** All Symbols x All Timeframes scan just by pressing scanner button ** *** Contact me  to send you instruction and add you in "Market Structure group" for sharing or seeing experiences with other users. Introduction: Market structure is important for both new and professional traders since it can influence the liquidity and price action of a market (Breakout and Retest). It’s also one of the most commonly used techniques to understand trends, identify potential reversal points, and get a feel f
Matrix Arrow Indicator MT4
Juvenille Emperor Limited
5 (3)
Matrix Arrow Indicator MT4 es una tendencia única 10 en 1 que sigue un indicador 100% sin repintado de marcos temporales múltiples que se puede usar en todos los símbolos/instrumentos: divisas, materias primas, criptomonedas, índices, acciones.  Matrix Arrow Indicator MT4 determinará la tendencia actual en sus primeras etapas, recopilando información y datos de hasta 10 indicadores estándar, que son: Índice de movimiento direccional promedio (ADX) Índice de canales de productos básicos (CCI) Ve
IX Power MT4
Daniel Stein
5 (5)
IX Power lleva por fin la insuperable precisión de FX Power a los símbolos que no son de Forex. Determina con exactitud la intensidad de las tendencias a corto, medio y largo plazo de tus índices, acciones, materias primas, ETF e incluso criptodivisas favoritas. Puede analizar todo lo que su terminal le ofrece. Pruébalo y experimenta cómo tu timing mejora significativamente a la hora de operar. Características principales de IX Power Resultados de cálculo 100% precisos y sin repintado -
ACTUALMENTE 31% DE DESCUENTO Este indicador es una herramienta de transacción única, de alta calidad y asequible porque hemos incorporado una serie de características propias y una fórmula secreta. Con solo un gráfico, da Alertas para los 28 pares de divisas. ¡Imagina cómo mejorarás porque puedes identificar el punto de activación exacto de una nueva tendencia u oportunidad de crecimiento! Basado en nuevos algoritmos subyacentes , hace que sea aún más fácil identificar y confirmar operaciones po
Deja un comentario después de la compra para recibir 4 indicadores de alta calidad como bono. El indicador Chart Patterns All-in-One ayuda a los traders a visualizar varios patrones de gráficos comúnmente utilizados en el análisis técnico. Este indicador apoya la identificación de posibles comportamientos del mercado, pero no garantiza rentabilidad. Se recomienda probar el indicador en modo demo antes de comprar. Oferta actual : Descuento del 50% en el indicador "Chart Patterns All in One". Patr
Conviértase en un Breaker Trader y obtenga beneficios de los cambios en la estructura del mercado a medida que se invierte el precio. El indicador de ruptura de bloque de órdenes identifica cuándo una tendencia o movimiento de precio se acerca al agotamiento y está listo para revertirse. Le alerta sobre cambios en la estructura del mercado que generalmente ocurren cuando una reversión o un retroceso importante están a punto de suceder. El indicador utiliza un cálculo patentado que identific
Blahtech Supply Demand
Blahtech Limited
4.61 (33)
Was: $299  Now: $99   Supply Demand uses previous price action to identify potential imbalances between buyers and sellers. The key is to identify the better odds zones, not just the untouched ones. Blahtech Supply Demand indicator delivers functionality previously unavailable on any trading platform. This 4-in-1 indicator not only highlights the higher probability zones using a multi-criteria strength engine, but also combines it with multi-timeframe trend analysis, previously confirmed swings
Otros productos de este autor
Laguerre SuperTrend Clouds adds an Adaptive Laguerre averaging algorithm and alerts to the widely popular SuperTrend indicator. As the name suggests, Laguerre SuperTrend Clouds (LSC) is a trending indicator which works best in trendy (not choppy) markets. The SuperTrend is an extremely popular indicator for intraday and daily trading, and can be used on any timeframe. Incorporating Laguerre's equation to this can facilitate more robust trend detection and smoother filters. The LSC uses the impro
"The Squeeze indicator attempts to identify periods of consolidation in a market. In general the market is either in a period of quiet consolidation or vertical price discovery. By identifying these calm periods, we have a better opportunity of getting into trades with the potential for larger moves. Once a market enters into a "squeeze," we watch the overall market momentum to help forecast the market direction and await a release of market energy." Modified TTM Squeeze Indicator is a modifica
The Relative Momentum Index (RMI) was developed by Roger Altman, and introduced in his Feb 1993 article in Technical Analysis of Stocks & Commodities magazine. As its name suggests, Relative Momentum Index adds a momentum component to the traditional RSI, designed to increase reliability by decreasing spurious oscillations between defined overbought and oversold levels. This Relative Momentum Index indicator has 2 components. A change in RMI line color provides a warning signal for an upward or
Two Period RSI + Alerts compares long-term and short-term RSI lines, and plots a fill between them for improved visualization. Fill is colored differently according to an uptrend (short period RSI above long period RSI) or a downtrend (short period RSI below long period RSI). Short-term RSI crossing long-term RSI adds a more robust trend confirmation signal than using single period RSI alone. This is a tool to help visualize and confirm RSI trends. We hope you enjoy! Alerts Email, message, and
Catch major price movements, early in the trend. Alerts you to enter at the likely beginning of a trend, and if it's incorrect, quickly alerts you to exit to limit any loss. Designed to capture large, profitable price movements, with early entrance to maximize your returns. As shown in screenshots, typical behavior is  several quick entrance/exists with small loss , and then  capture of a large trend with high profits .  The   Instantaneous Trend  indicator is a lag-reduced method to detect pri
Detect strength for uptrends and downtrends by tracking Buy Power and Sell Power. Stay on the right side of the market by being able to determine whether the market is in a bull or bear trend and how strong the trend is. Free download for a limited time! We hope you enjoy, with our very best wishes during this pandemic! Trend Trigger Factor  aims to ride out sideways movement, while positioning the trader in the correct side of the market to capture big trends when they occur. It was   orig
FREE
Two Period RSI
Libertas LLC
5 (4)
Two Period RSI compares long-term and short-term RSI lines, and plots a fill between them for improved visualization. Fill is colored differently according to an uptrend (short period RSI above long period RSI) or a downtrend (short period RSI below long period RSI). Short-term RSI crossing long-term RSI adds a more robust trend confirmation signal than using single period RSI alone. This is a small tool to help visualize and confirm RSI trends. We hope you enjoy! Looking for RSI alerts? You can
FREE
Whether trading stocks, futures, options, or FX, traders confront the single most important question: to trade trend or range? This tool helps you identify ranges to either trade within, or, wait for breakouts signaling trend onset. Free download for a limited time! We hope you enjoy, with our very best wishes during this pandemic! The issue with identifying ranges is some ranges and patterns are easy to miss, and subject to human error when calculated on the fly. The Automatic Range Identi
FREE
Trendiness Index
Libertas LLC
5 (3)
"The trend is your friend" is one of the best known sayings in investing, because capturing large trendy price movements can be extremely profitable. However, trading with the trend is often easier said than done, because many indicators are based on price reversals not trends. These aren't very effective at identifying trendy periods, or predicting whether trends will continue. We developed the Trendiness Index to help address this problem by indicating the strength and direction of price trend
"Capture the sleeping and waking alligator." Detect trend entrance/exit conditions - this indicator can also be tuned according to your trading style. You can adjust a confidence parameter to reduce false positives (but capture less of the trend). This is based on a modification of the Alligator indicator by Bill Williams, an early pioneer of market psychology.  2 main strategies: either the " conservative"  approach to more frequently make profitable trades (at a lower profit), or the " high r
FREE
ATR Volatility Alerts
Libertas LLC
4.33 (3)
ATR Volatility plots the ATR-based volatility, and triggers alerts when it crosses user-defined upper and lower thresholds (purple and tan lines, please see screenshots). Circles are painted when ATR volatility crosses either above the upper threshold, or below the lower threshold. This is a small tool custom-built by our group, by specific request of one of our customers. We hope you enjoy! Do you have an indicator you would like to see designed? Feel free to send us a message! Click here for m
FREE
Two Period RSI + Alerts compares long-term and short-term RSI lines, and plots a fill between them for improved visualization. Fill is colored differently according to an uptrend (short period RSI above long period RSI) or a downtrend (short period RSI below long period RSI). Short-term RSI crossing long-term RSI adds a more robust trend confirmation signal than using single period RSI alone. This is a tool to help visualize and confirm RSI trends. We hope you enjoy! Alerts Email, message, and
Laguerre SuperTrend Clouds   adds an Adaptive Laguerre averaging algorithm and alerts to the widely popular SuperTrend indicator. As the name suggests,   Laguerre SuperTrend Clouds (LSC)   is a trending indicator which works best in trendy (not choppy) markets. The SuperTrend is an extremely popular indicator for intraday and daily trading, and can be used on any timeframe. Incorporating Laguerre's equation to this can facilitate more robust trend detection and smoother filters. The LSC uses the
EMA Separation Coefficient reflects the separation between short-term and long-term exponential moving average trend resistance, as well as the direction of the current movement. Pay attention to potential crossover points when the coefficient approaches zero, this may indicate an upcoming breakout or reversal. Wait for confirmation of the trend before entering the trade, and exit when the coefficient forms a max (for calls) or a min (for puts). This is a small tool to help visualize the differe
FREE
"Wouldn't we all love to reliably know when a stock is starting to trend, and when it is in flat territory? An indicator that would somehow tell you to ignore the head fakes and shakeouts, and focus only on the move that counts?" The Choppiness Index is a non-directional indicator designed to determine if the market is choppy (trading sideways) or not choppy (trading within a trend in either direction). It is an oscillating indicator between -50 (very trendy) and +50 (very choppy). There are man
Choppiness Index
Libertas LLC
5 (1)
"Wouldn't we all love to reliably know when a stock is starting to trend, and when it is in flat territory? An indicator that would somehow tell you to ignore the head fakes and shakeouts, and focus only on the move that counts?" The Choppiness Index is a non-directional indicator designed to determine if the market is choppy (trading sideways) or not choppy (trading within a trend in either direction). It is an oscillating indicator between -50 (very trendy) and +50 (very choppy). There are man
Automate your charting with the All-In-One SRES channel indicator. This is a complete package designed to address 3 questions: (1) when to enter a trade, (2) what is a good exit point, and (3) what is the probabilistic likelihood of success of the trade. Longevity and Flexibility : The All-In-One SRES calculates and charts S upport, R esistance, E xpected range, and a S queeze channel, and is enormously flexible for many trading strategies. Each option is customizable to fit your strategy, and c
"Battles between bulls and bears continue to influence price development long after the combat has ended, leaving behind a messy field that observant technicians can use to manage risk and find opportunities. Apply "trend mirror" analysis to examine these volatile areas, looking for past action to impact the current trend when price turns and crosses those boundaries." - Investopedia.com RSI Mirrors and Reflections is a robust technique using multiple RSI periods, mirrors and reflections based o
Fano Factor is a measure of the dispersion of the probability distribution of Fano noise, named after Ugo Fano, an Italian-American Physicist. Fans has applications in Particle Detection and Neuroscience for describing variability in complex multivariate data. In trading, we have discovered Fano can be used as a 'signal to noise' ratio, and can indicate the strength of price movements (i.e., price movement is greater than predicted by purely statistical measures). Like standard deviation, Fano F
"The Squeeze indicator attempts to identify periods of consolidation in a market. In general the market is either in a period of quiet consolidation or vertical price discovery. By identifying these calm periods, we have a better opportunity of getting into trades with the potential for larger moves. Once a market enters into a "squeeze," we watch the overall market momentum to help forecast the market direction and await a release of market energy." The StdATR Squeeze Channel combines standard
SuperTrend Alerts
Libertas LLC
3 (4)
SuperTrend Alerts adds alerts to the widely popular SuperTrend indicator. As the name suggests, SuperTrend is a trending indicator which works best in trendy (not choppy) markets. SuperTrend is extremely popular for intraday and daily trading, and can be used on any timeframe. Place a call when the price closes above the SuperTrend line, and place a put when the price closes below the SuperTrend line. These crossovers are highlighted by non-repainting up/down arrows. Alerts Email, message and
True Choppiness Direction determines if the market is choppy (trading sideways) or if it is trending, as well as the trend direction and strength (green=up, red=down, grey=no trend) . The underlying algorithm is designed to detect trend movements even in the presence of noisy market data, please see screenshots. Trend strength is indicated by taller or shorter red/green fill. Choppiness index is range-bound between -50 (very trendy) and +50 (very choppy). This is a custom algorithm designed by u
"The VIX Fix is a powerful indicator that detects market bottoms for any asset " The VIX (volatility index) is a ticker symbol of implied volatility of the S&P 500, calculated by the Chicago Board Options Exchange. VIX is a popular measure of market risk, and is one of the best measures of market bottoms that currently exists. Unfortunately, it only exists for the S&P 500... The VIX Fix was published by Larry Williams in 2007, and it synthesizes a VIX volatility index for any asset (not just the
WaveTrend Momentum Oscillator is an upgrade to the popular and easy-to-use WaveTrend Oscillator. The WaveTrend Momentum Oscillator adds a momentum component to the original WaveTrend calculation, in order to provide faster and more accurate entry points during trendy market conditions. Do you prefer the original WaveTrend Oscillator? The WaveTrend Momentum Oscillator allows you to switch between momentum and original WT versions. Both provide valuable information depending on the market conditio
The  Laguerre VIX Trend Extrema   (LVTE)  indicator detects market tops and bottoms. As its name suggests, LVTE is a percentage price oscillator that identifies extreme ranges in market price. How to use:   Buy   when the indicator was in the lower "blue" range for more than 2 candles, and then moves up into grey.   Sell   when the indicator was in the upper "red" range, and then moves down into orange. Please see screenshots for examples! To make it simple, the indicator can show this by paint
Looking for strong trend entrance and exit points of trends? This incorporates volume into price calculations for a fast entry/exit, showing how supply and demand factors are influencing price, and  giving you more insights than the average trader uses. The   Volume Accumulation Trend   indicator is a cumulative indicator that uses both   volume  and   price  to investigate whether an asset is growing or falling. It identifies differences between the price and the volume flow, which lets us kno
"Battles between bulls and bears continue to influence price development long after the combat has ended, leaving behind a messy field that observant technicians can use to manage risk and find opportunities. Apply "trend mirror" analysis to examine these volatile areas, looking for past action to impact the current trend when price turns and crosses those boundaries." RSI Mirrors and Reflections is a robust technique using multiple RSI periods, mirrors and reflections based on RSI values to ind
"The Squeeze indicator attempts to identify periods of consolidation in a market. In general the market is either in a period of quiet consolidation or vertical price discovery. By identifying these calm periods, we have a better opportunity of getting into trades with the potential for larger moves. Once a market enters into a "squeeze," we watch the overall market momentum to help forecast the market direction and await a release of market energy." The Modified TTM Squeeze Indicator is a modi
The  Laguerre VIX Trend Extrema   (LVTE)  indicator detects market tops and bottoms. As its name suggests, LVTE is a percentage price oscillator that identifies extreme ranges in market price. How to use: Buy when the indicator was in the lower "blue" range for more than 2 candles, and then moves up into grey. Sell when the indicator was in the upper "red" range, and then moves down into orange. Please see screenshots for examples! To make it simple, the indicator can show this by painting "dots
Catch major price movements, early in the trend. Alerts you to enter at the likely beginning of a trend, and if it's incorrect, quickly alerts you to exit to limit any loss. Designed to capture large, profitable price movements, with early entrance to maximize your returns. As shown in screenshots, typical behavior is several quick entrance/exists with small loss , and then capture of a large trend with high profits .  The Instantaneous Trend  indicator is a lag-reduced method to detect price t
Filtro:
Matthew Todorovski
12938
Matthew Todorovski 2018.06.30 14:32 
 

El usuario no ha dejado ningún comentario para su valoración

Tim Eubanks
5762
Tim Eubanks 2018.03.19 08:38 
 

El usuario no ha dejado ningún comentario para su valoración

Respuesta al comentario
Versión 1.2 2021.12.01
Upgraded for new MT4 version compatibility
Versión 1.1 2017.01.11
V1.1 Improvements:
- Fixed bug in which colors revert to original when changing timeframes