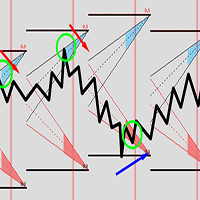
DmRO
- 지표
- Justin Ray Martin
- 버전: 1.0
- 활성화: 5
I greatly appreciate your interest in my product and this document will serve as an explanation and guide to my indicator. (DmRO indicator) This is a visual indicator that spots potential incoming trends/continuations. Like any other indicator/strategy, nothing plays out 100 percent all the time. But this tool offers high probability outcomes and is something that is useful to have no matter what your strategy is.
The levels are really specific to a time and condition that proved to be pretty consistent in both backtesting and forward testing. Overall when rules are met, bias is set based on historical patterns. When long conditions are met it’s safe to assume that there is a higher likelihood of upside to come. How much upside? Could be little. Could be a lot. Either way, that’s information that any trader would like to have.It also depends on the volatility as well. This tool gives a good read on the market and should be used alongside your analysis.
What/Who it’s for: This indicator isn’t meant for everyday day trading. These signals can take weeks/months to set up depending on the pair. They are bound to happen a handful of times throughout the year for every major and minor pair and when it sets up, it will be obvious. Therefore this is built for Swing/Positional traders. The default settings are fitted to only major and minor pairs. The good news is that the parameters can be adjusted to indices, metals, etc. I believe that the more people can experiment and make adjustments freely, the more opportunities can be discovered. As of now, it’s only available for MT5.
Indicator: DmRO (Diametrical Range Oscillator)
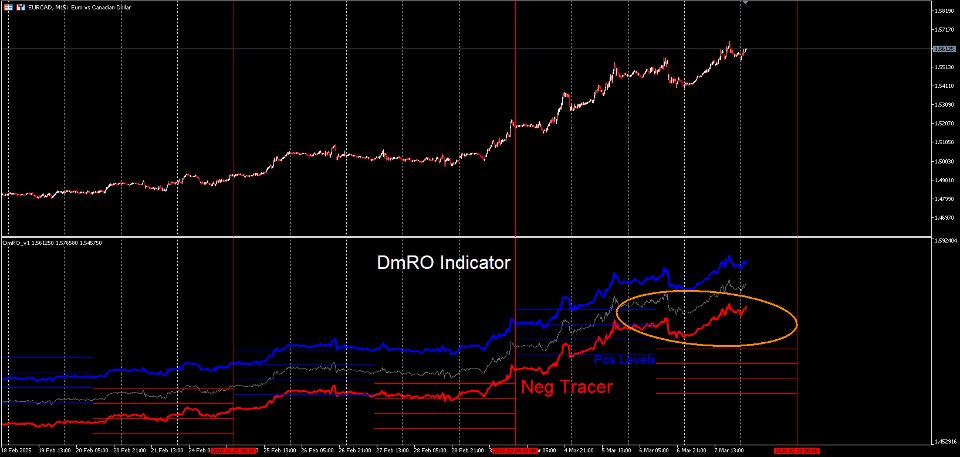
This indicator displays 5 things.
Positive Tracer: X amount of pips above price and default as blue
Negative Tracer: X amount of pips below price and default as red
Price line
Positive levels:4(0-3) levels Default as blue
Negative levels:4(0-(-)3) levels Default as red
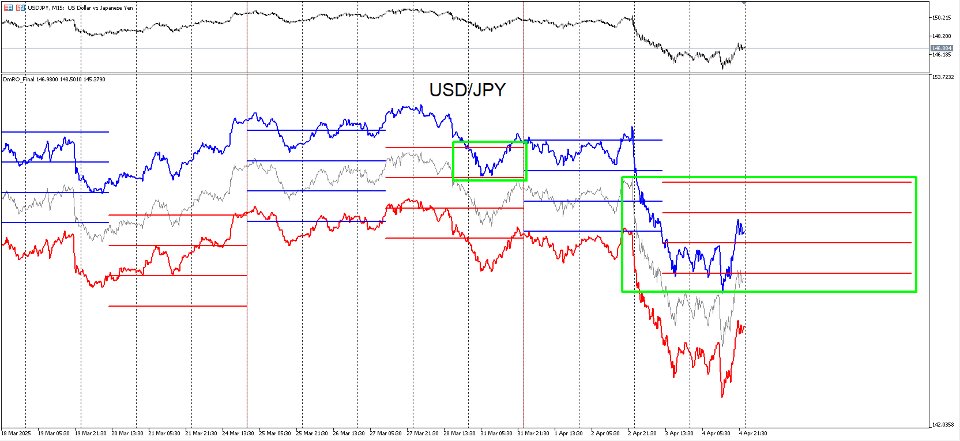
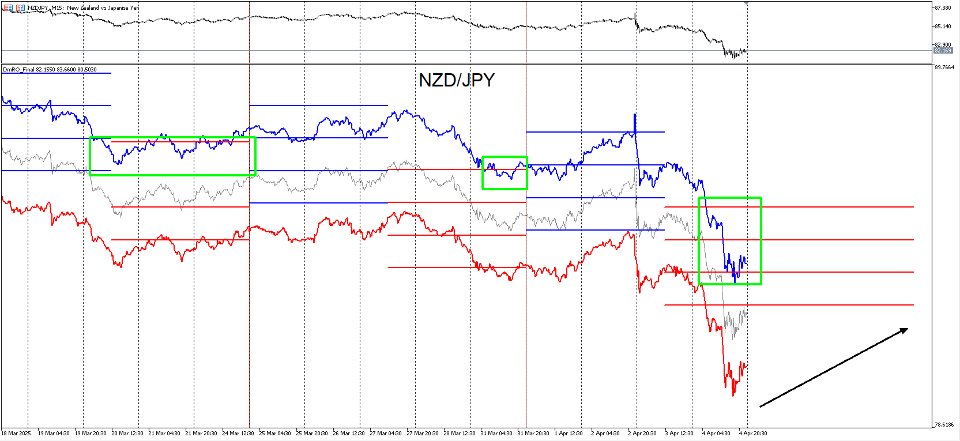
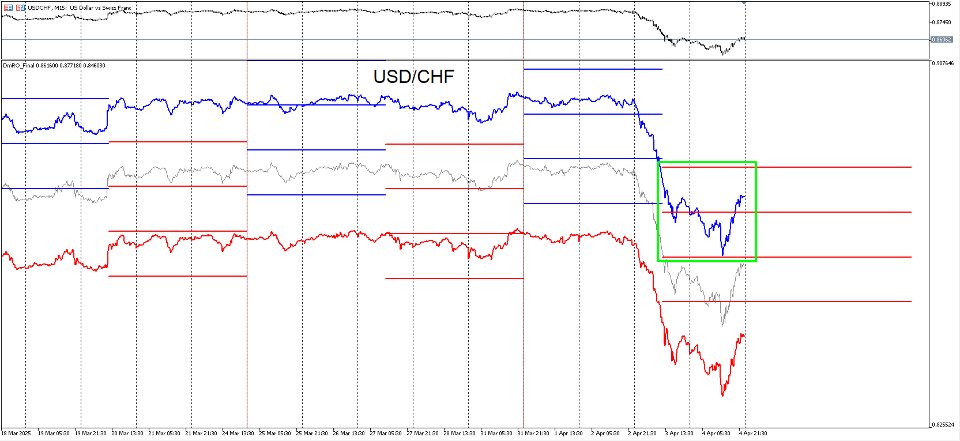
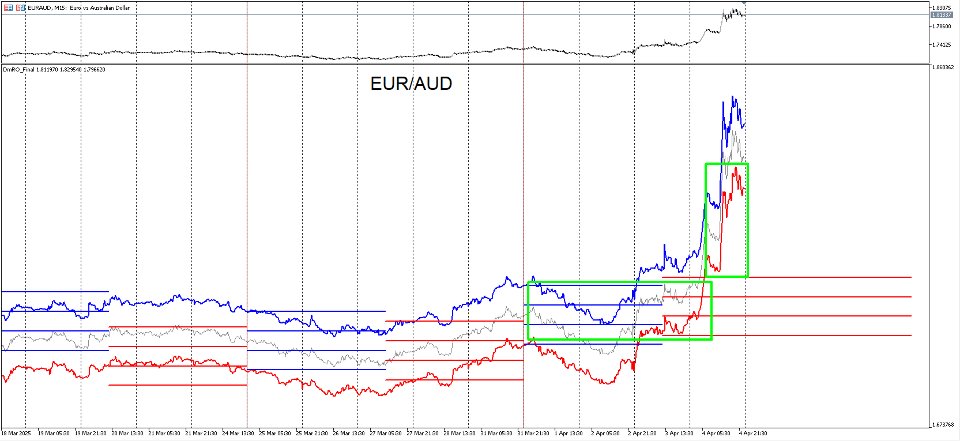
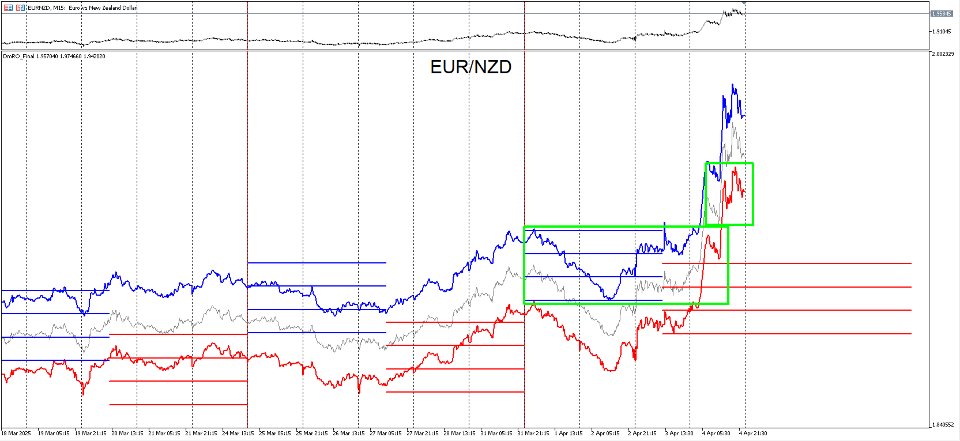
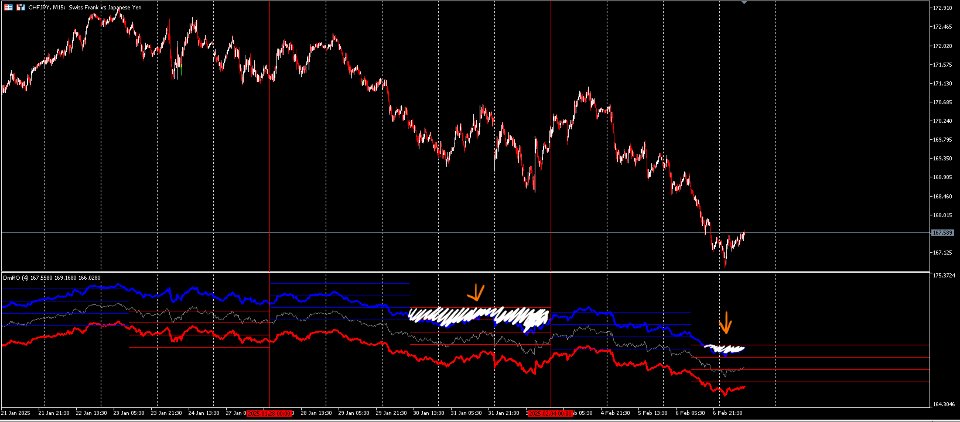
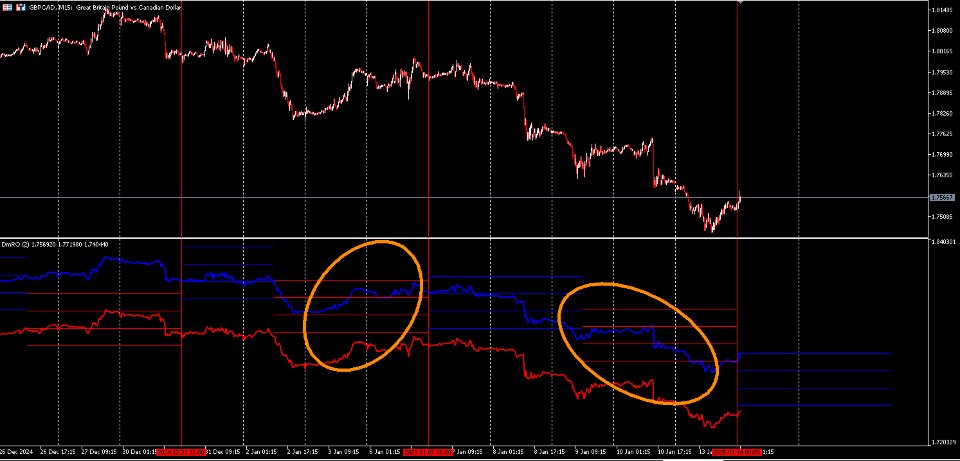
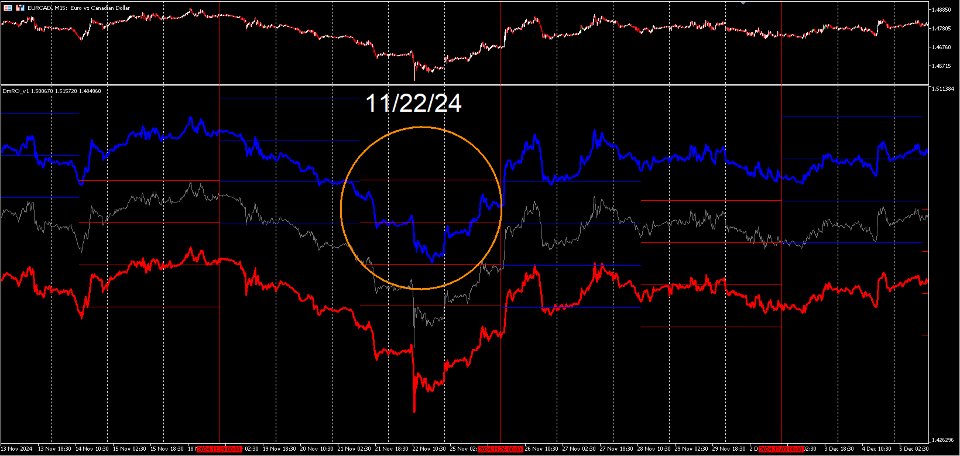
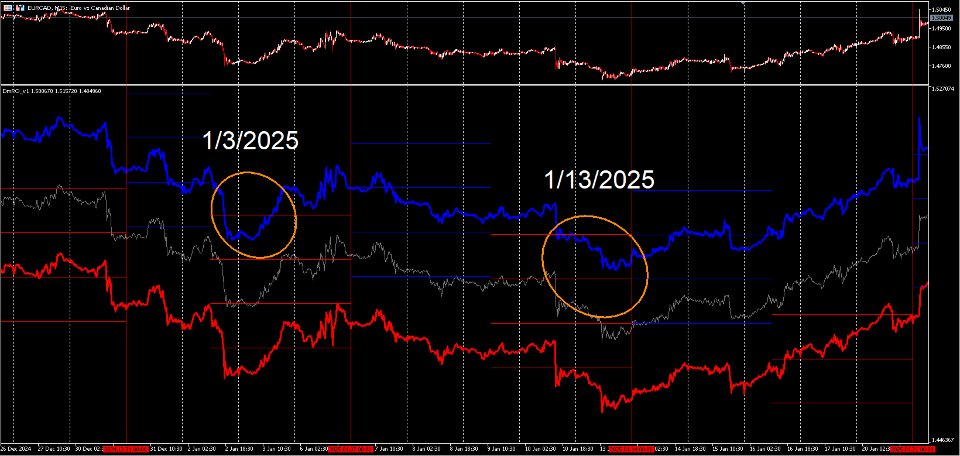
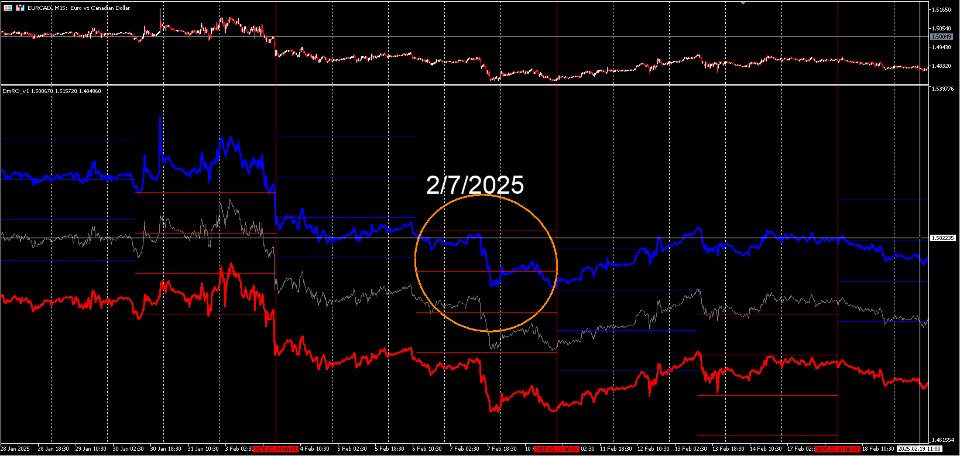
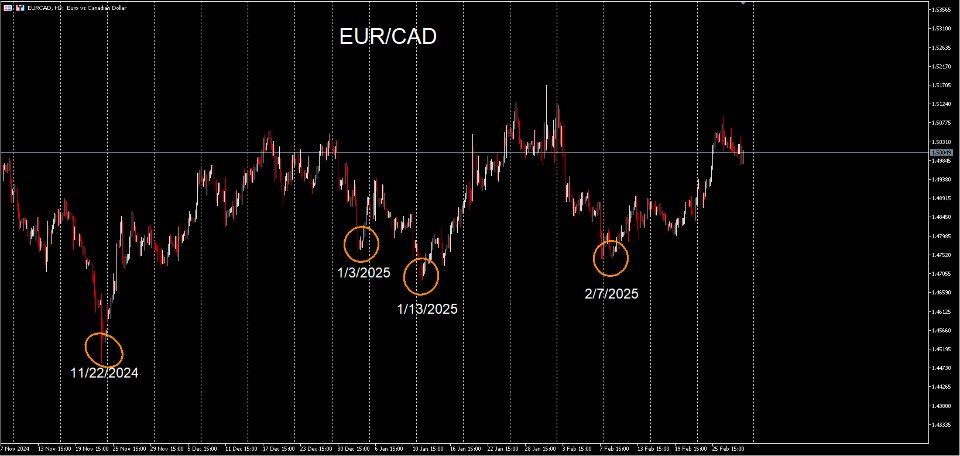
What to look for: When positive tracer enter into negative levels, price is likely to turn up. When negative tracer enter into positive levels, price is likely to turn down. The more aggressive the tracer enters the opposite level, the more likelihood for a reversal becomes much stronger. An example would be if the positive tracer extends well below level 2 and 3 of the negative levels, price is likely to turn up. Vice versa for when negative tracer extends well beyond positive levels of 2 and 3. Trader is only interested when the opposite tracer enters opposite levels and how aggressively it does so..Blue tracer in Blue levels means nothing. Red tracer in Red levels mean nothing.

