• Información general
  • Comentarios
  • Discusión

DmRO

I greatly appreciate your interest in my product and this document will serve as an explanation and guide to my indicator. (DmRO indicator) This is a visual indicator that spots potential incoming trends/continuations. Like any other indicator/strategy, nothing plays out 100 percent all the time. But this tool offers high probability outcomes and is something that is useful to have no matter what your strategy is.

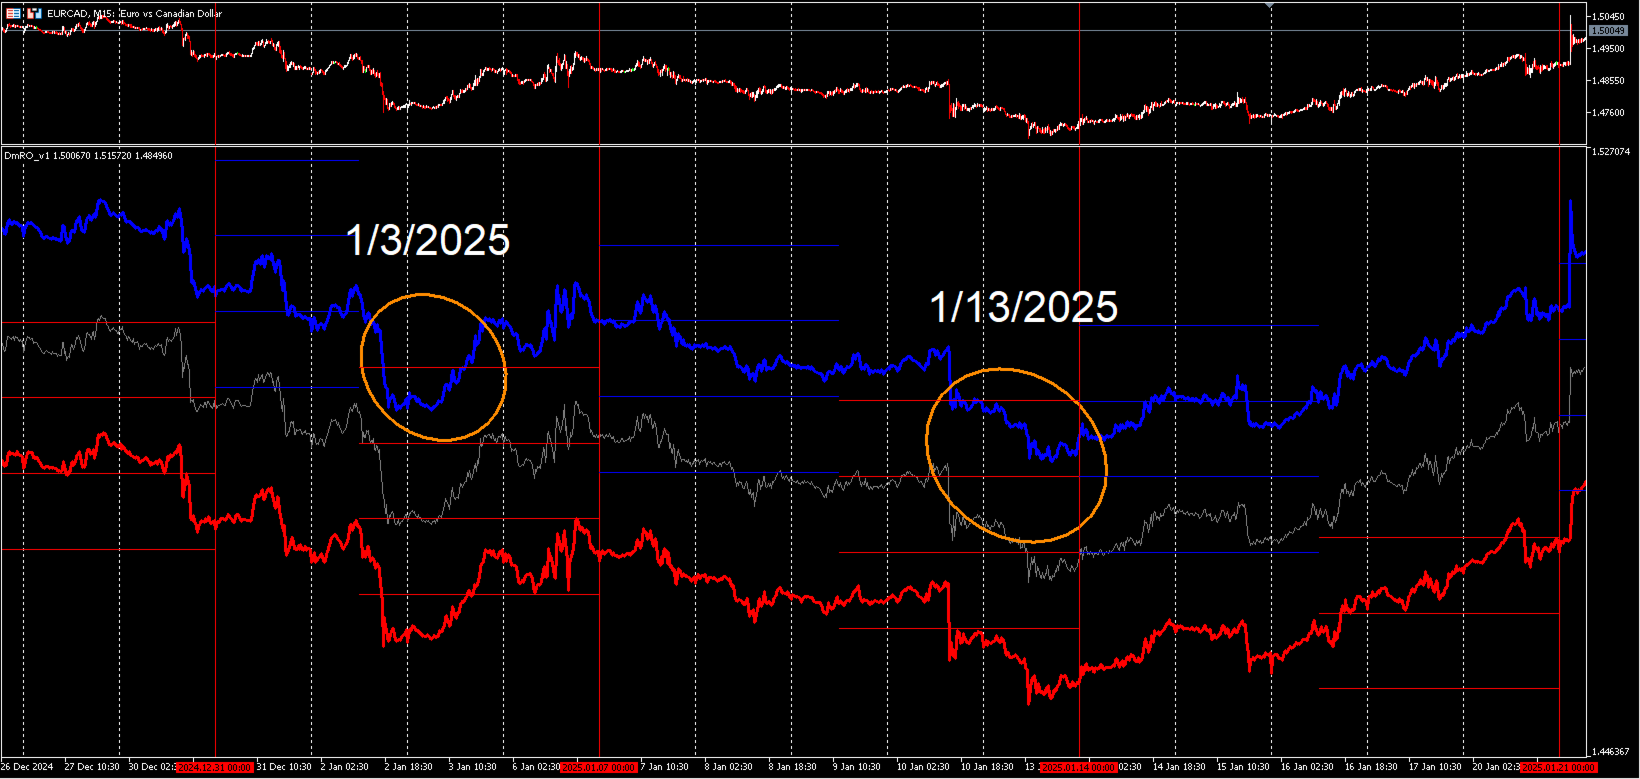
The levels are really specific to a time and condition that proved to be pretty consistent in both backtesting and forward testing. Overall when rules are met, bias is set based on historical patterns. When long conditions are met it’s safe to assume that there is a higher likelihood of upside to come. How much upside? Could be little. Could be a lot. Either way, that’s information that any trader would like to have.It also depends on the volatility as well. This tool gives a good read on the market and should be used alongside your analysis.

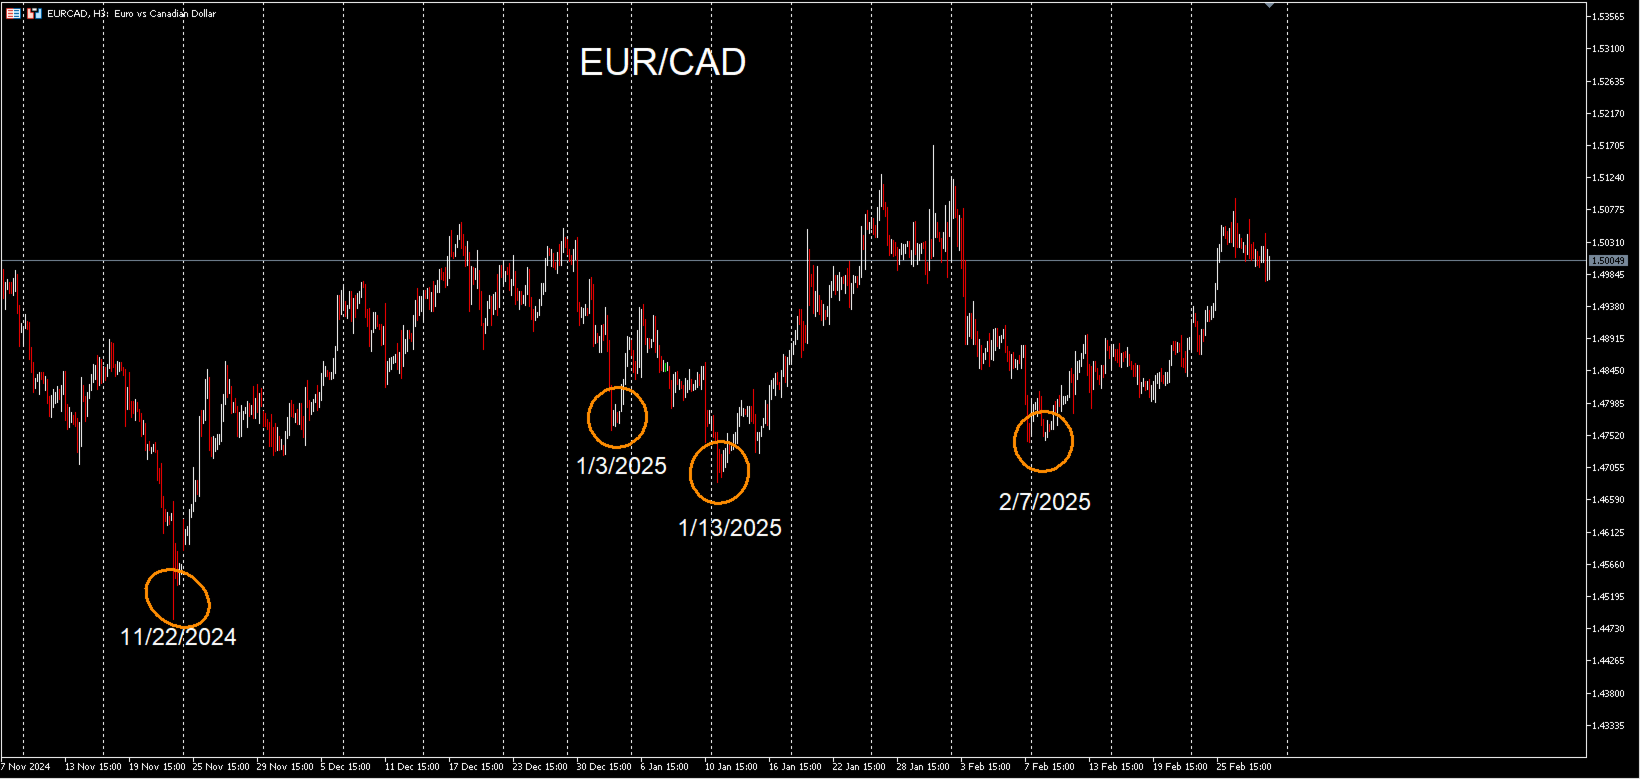
What/Who it’s for: This indicator isn’t meant for everyday day trading. These signals can take weeks/months to set up depending on the pair. They are bound to happen a handful of times throughout the year for every major and minor pair and when it sets up, it will be obvious. Therefore this is built for Swing/Positional traders. The default settings are fitted to only major and minor pairs. The good news is that the parameters can be adjusted to indices, metals, etc. I believe that the more people can experiment and make adjustments freely, the more opportunities can be discovered. As of now, it’s only available for MT5. 


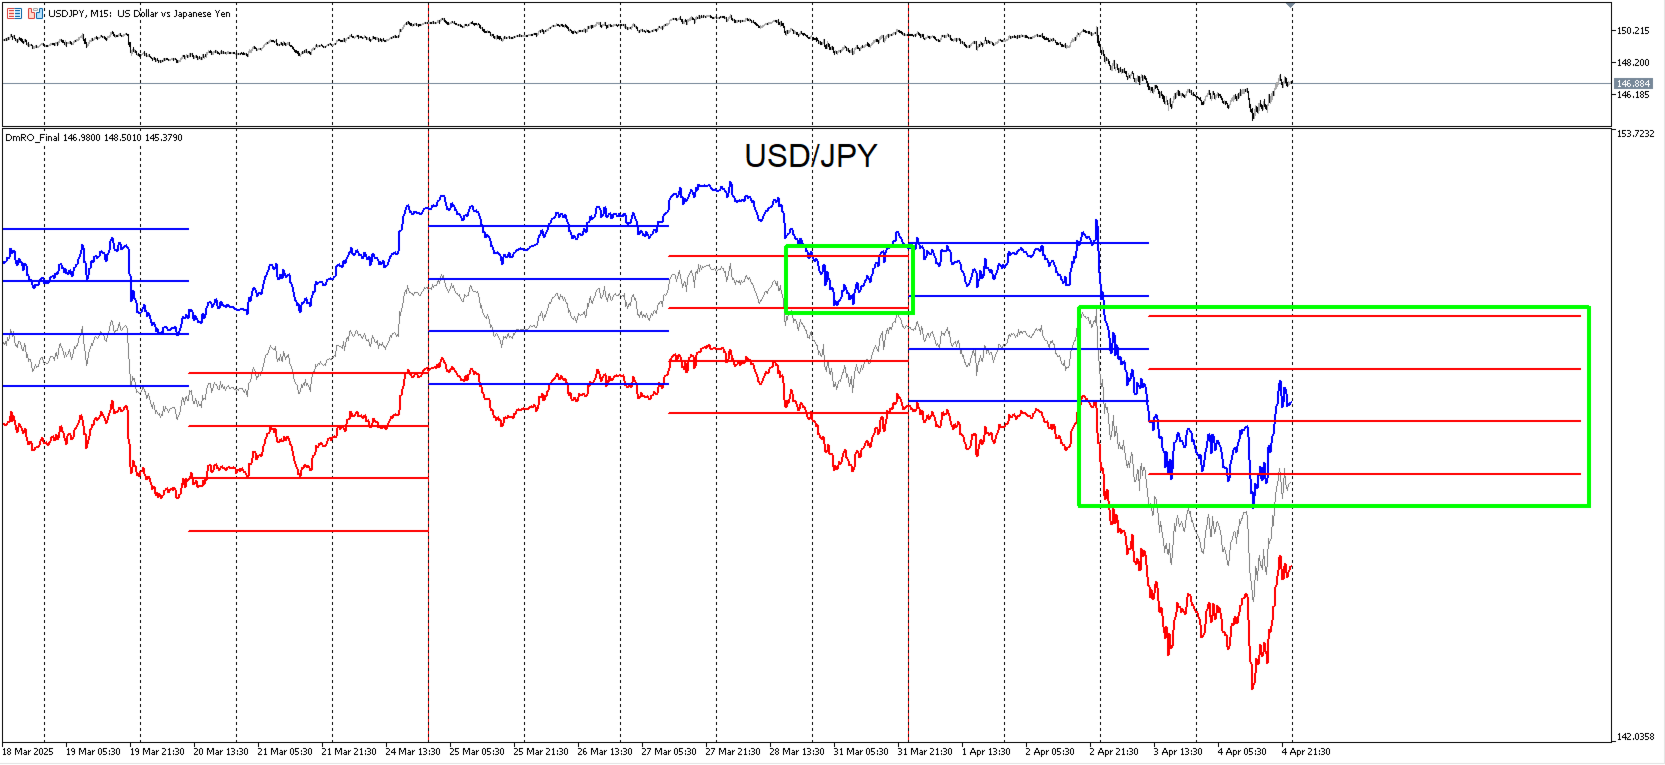
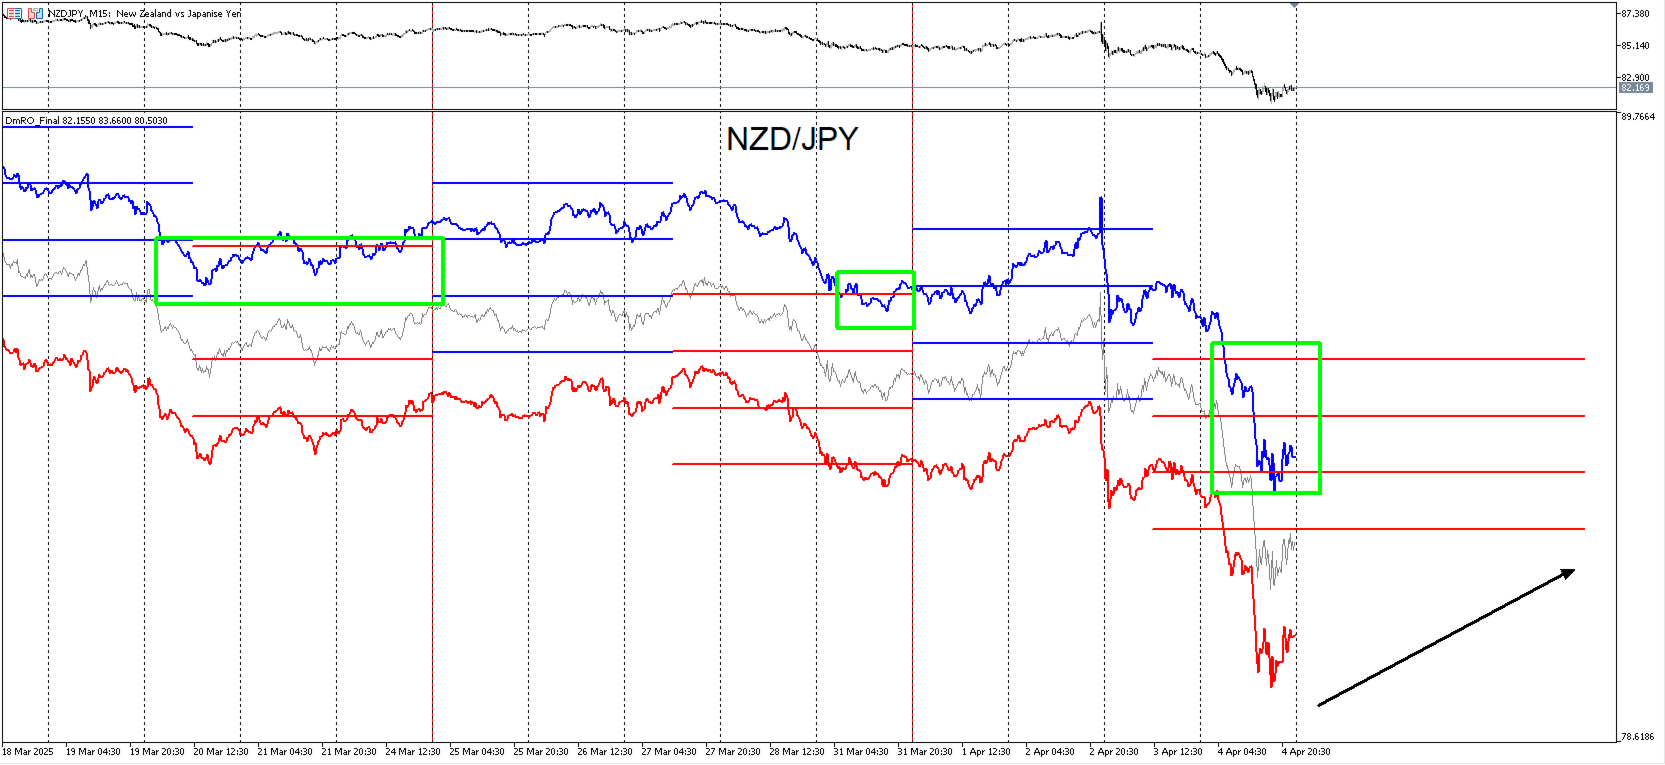
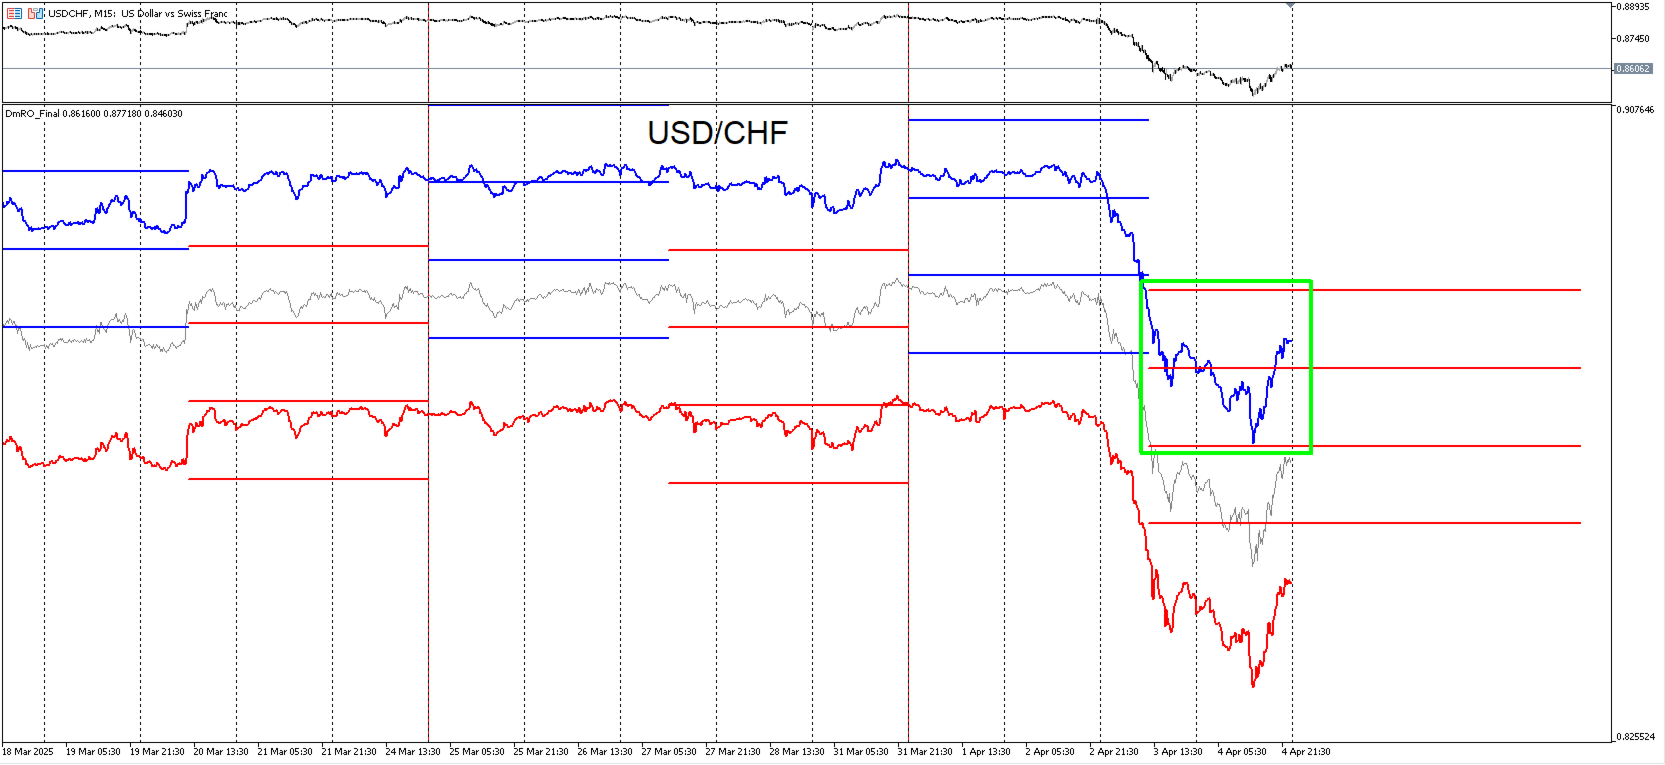
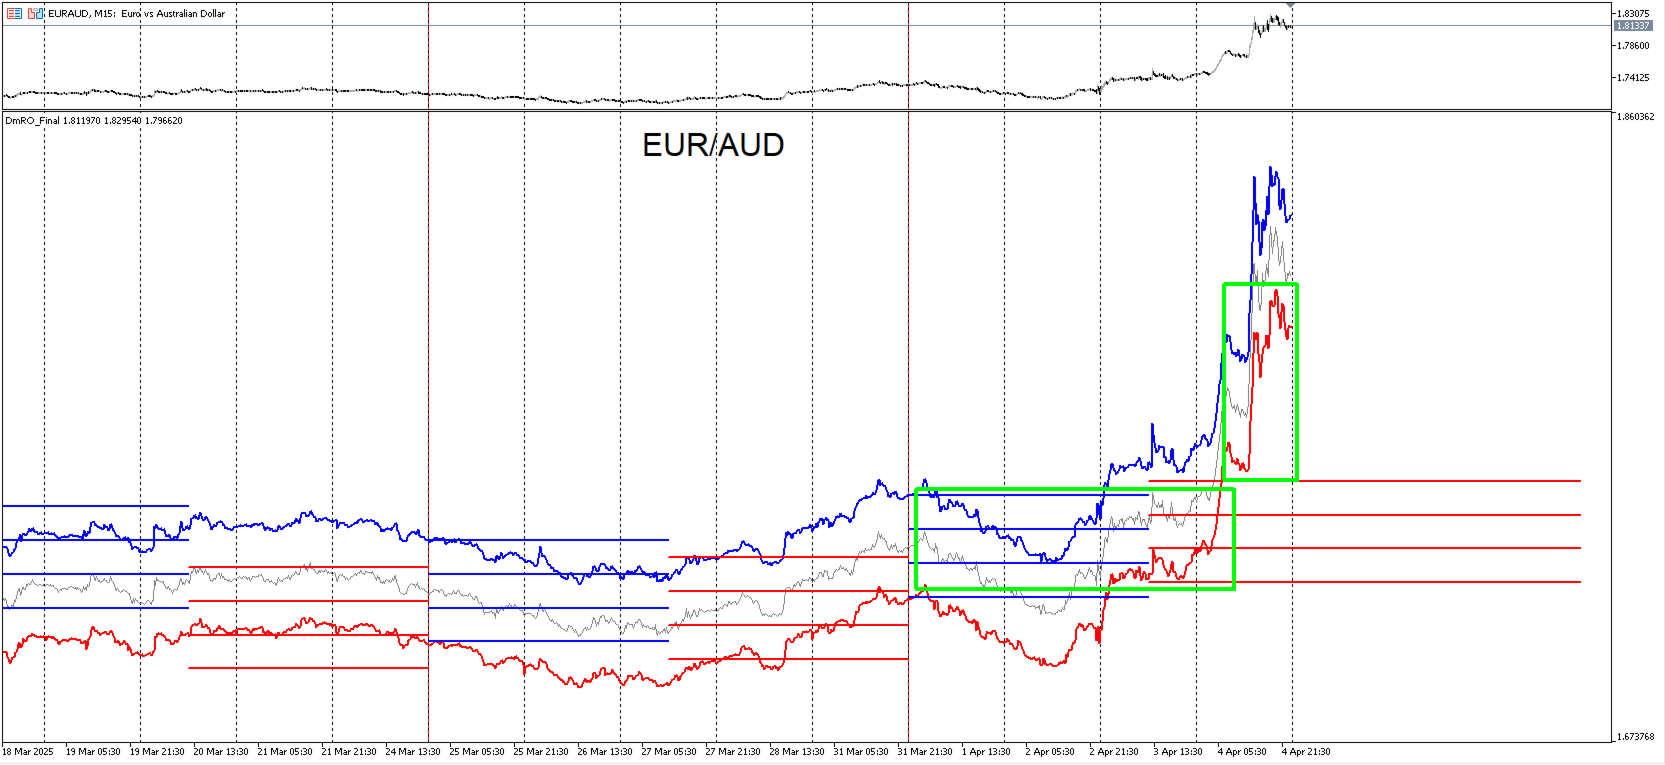
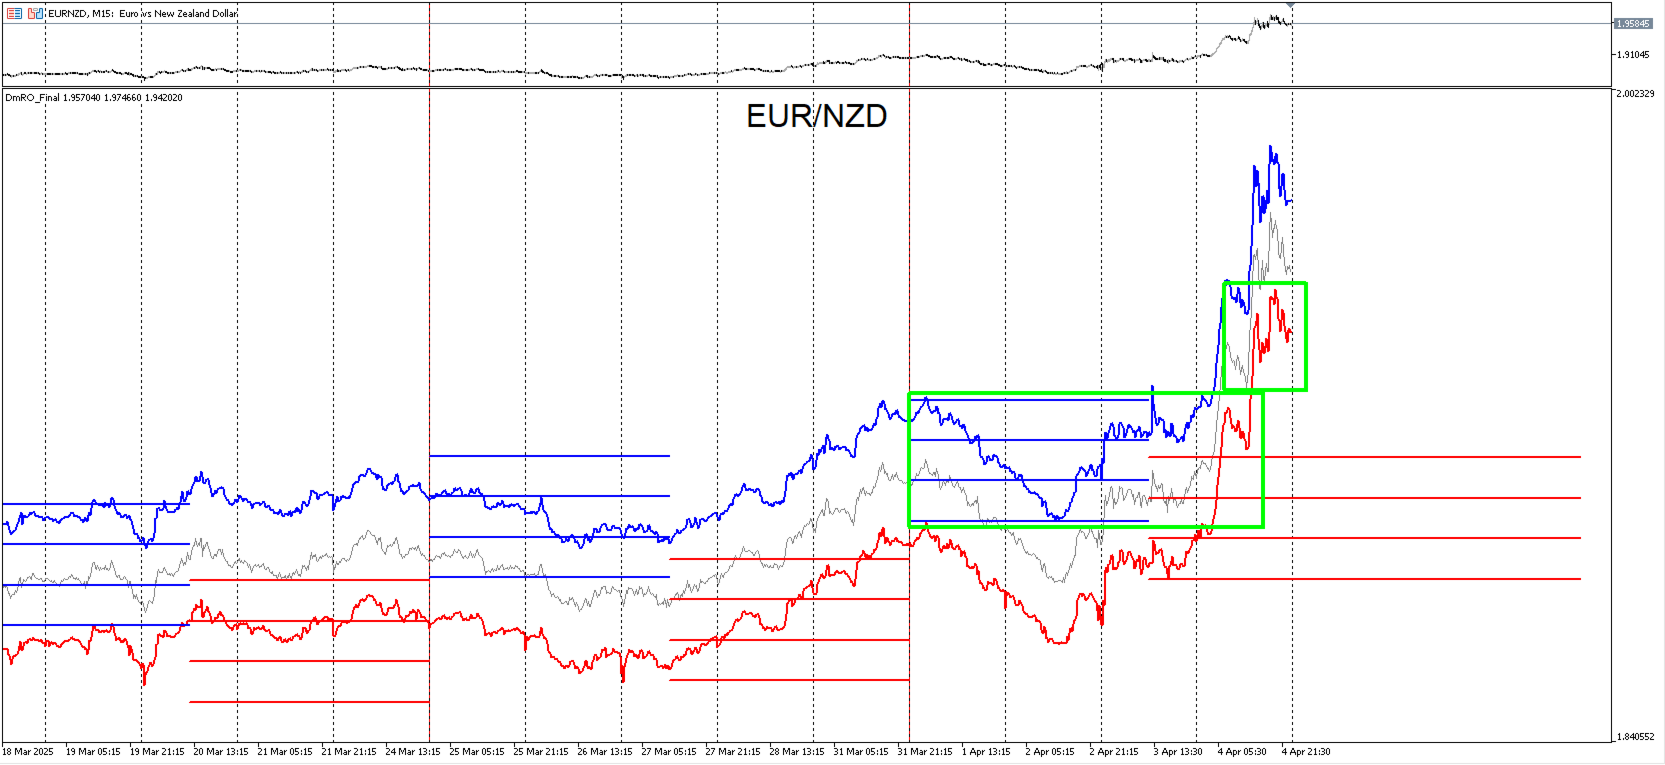
Indicator: DmRO (Diametrical Range Oscillator)

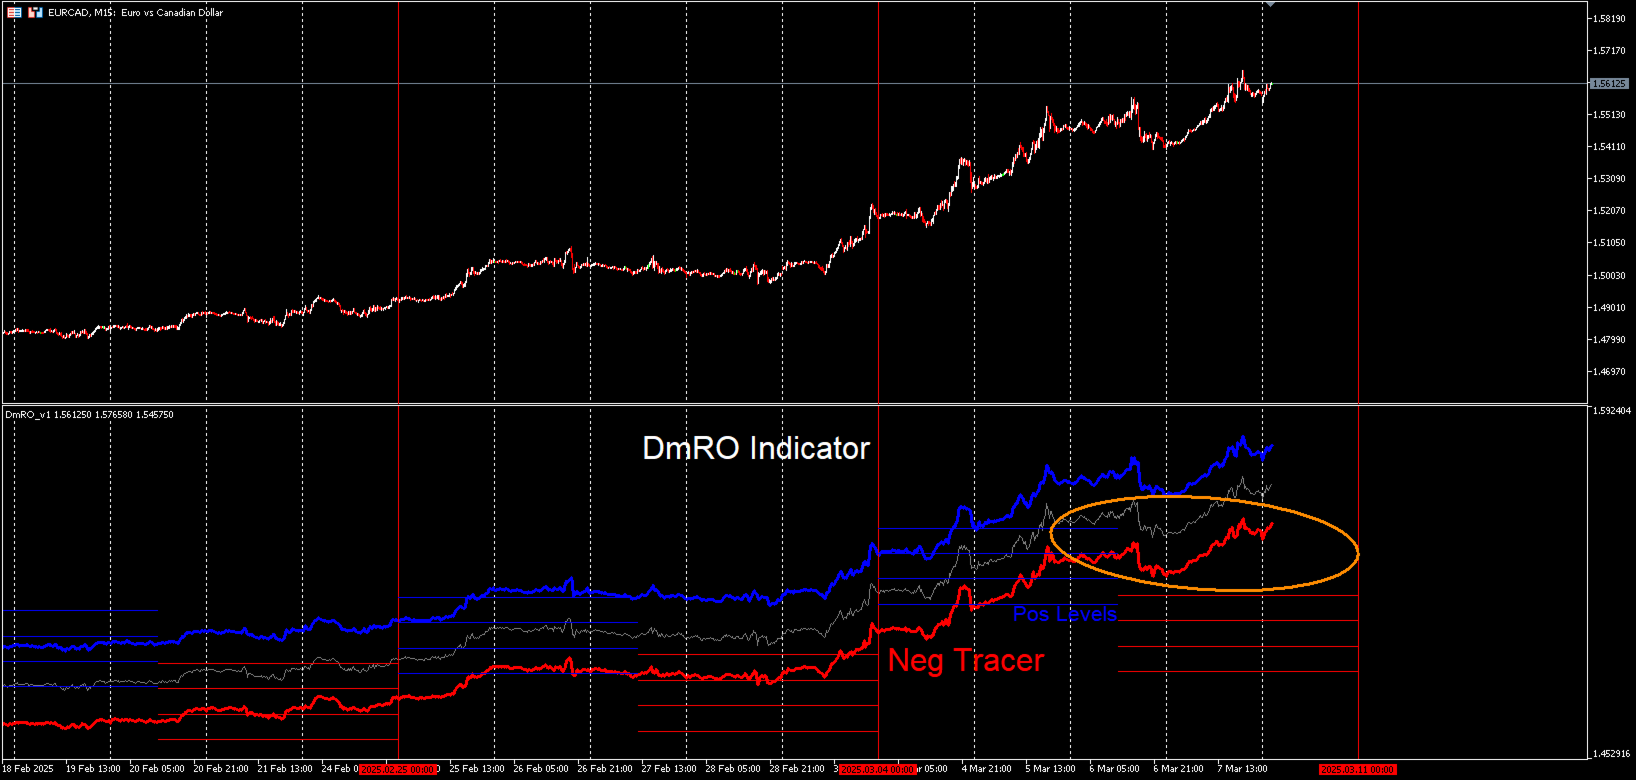
This indicator displays 5 things. 

Positive Tracer: X amount of pips above price and default as blue

Negative Tracer: X amount of pips below price and default as red

Price line

Positive levels:4(0-3) levels Default as blue

Negative levels:4(0-(-)3) levels Default as red


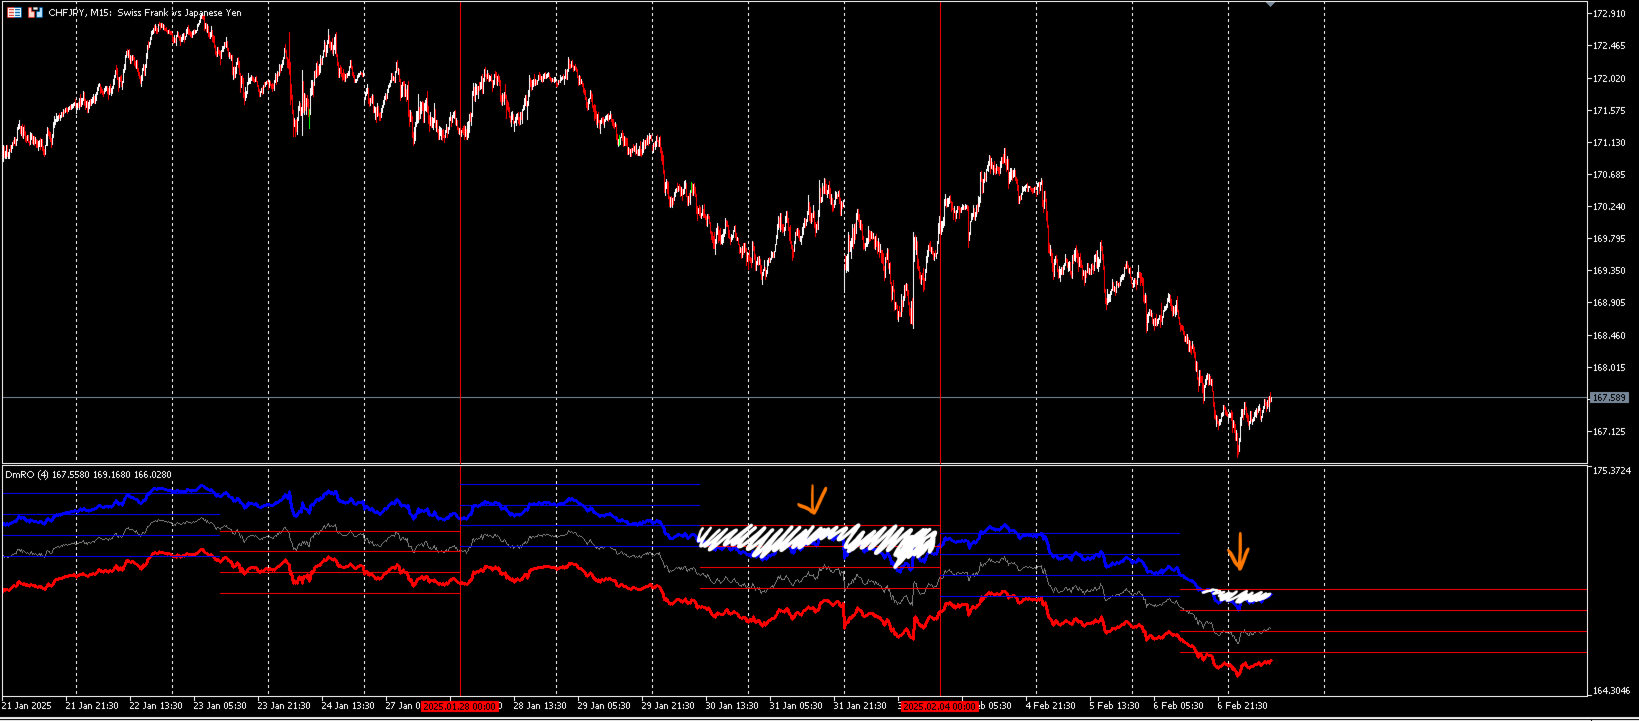
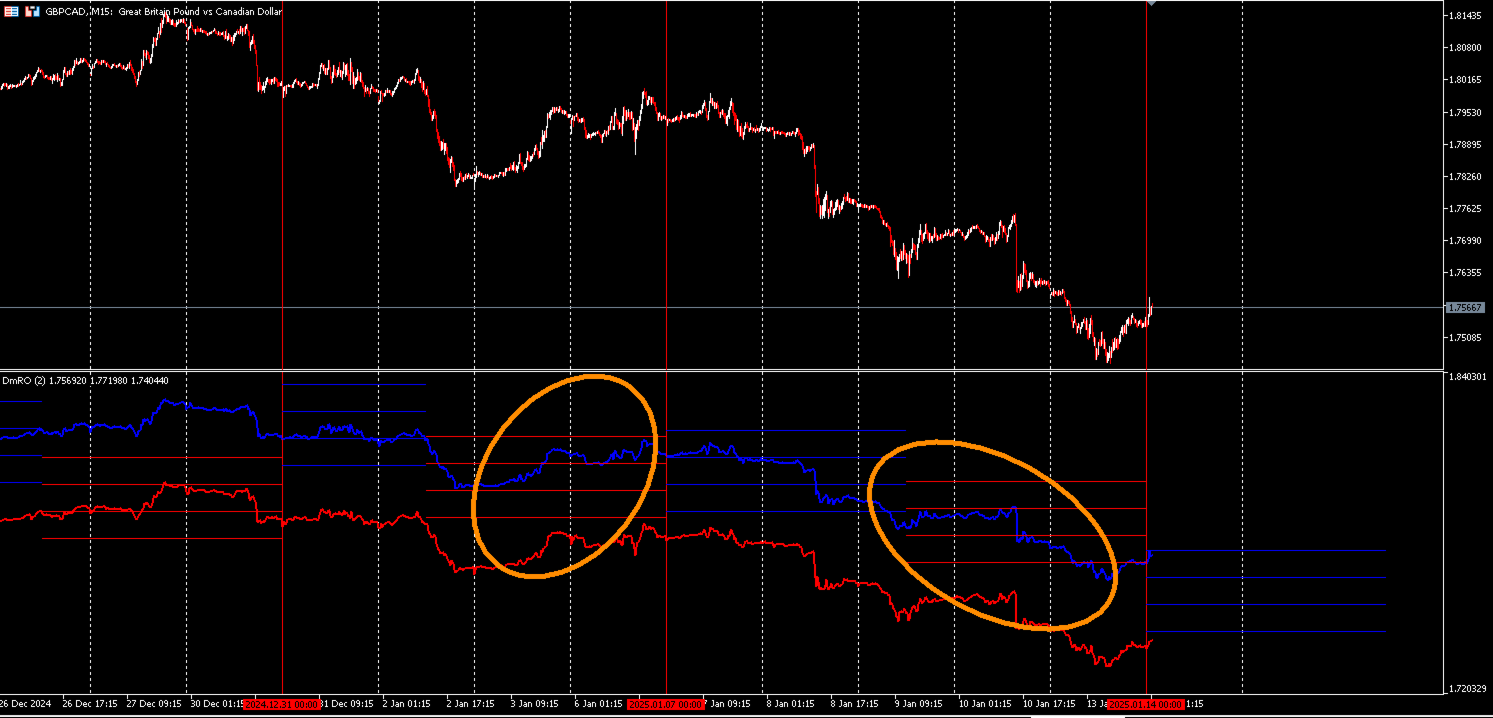
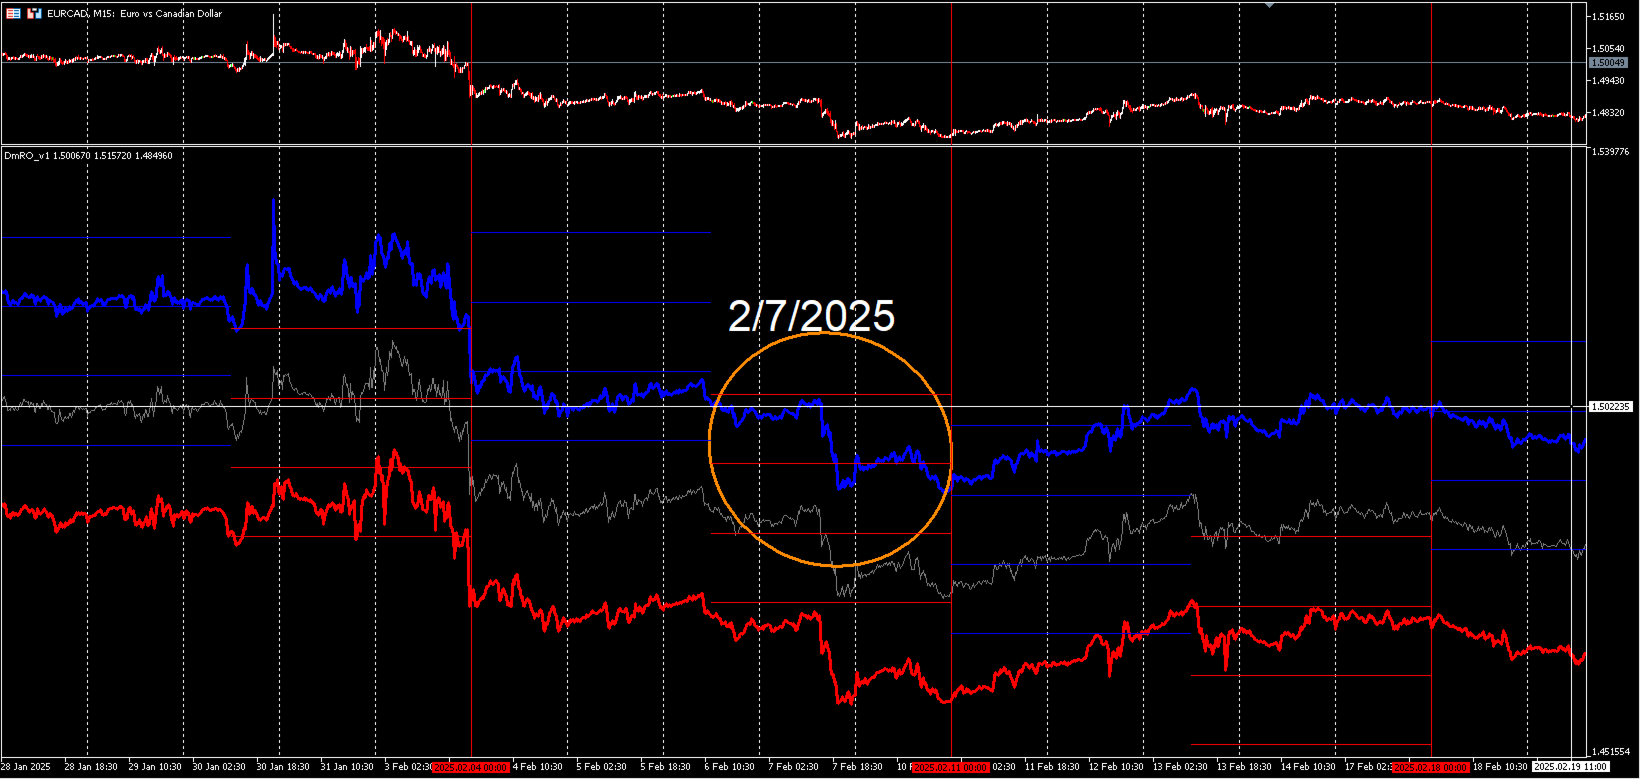
What to look for: When positive tracer enter into negative levels, price is likely to turn up. When negative tracer enter into positive levels, price is likely to turn down. The more aggressive the tracer enters the opposite level, the more likelihood for a reversal becomes much stronger. An example would be if the positive tracer extends well below level 2 and 3 of the negative levels, price is likely to turn up. Vice versa for when negative tracer extends well beyond positive levels of 2 and 3. Trader is only interested when the opposite tracer enters opposite levels and how aggressively it does so..Blue tracer in Blue levels means nothing. Red tracer in Red levels mean nothing. 


Productos recomendados
Golden Spike Premium
Kwaku Bondzie Ghartey
Golden Spikes Detector Acknowledgement and Dedications:  The name of this indicator was Inspired by an Original; Mr Grant Koopman; a Knowledgeable and experienced Synthetics trader. I dedicate this indicator to Mr Grant.  Overview:   The Golden Spikes Premium is a groundbreaking trading indicator meticulously crafted for the Boom and Crash indices on the Deriv market. Tailored to meet the needs of discerning traders, this powerful tool operates exclusively on the one-minute timeframe, providing
Owl Smart Levels MT5
Sergey Ermolov
4 (29)
Versión MT4  |  FAQ El Indicador Owl Smart Levels es un sistema comercial completo dentro de un indicador que incluye herramientas de análisis de mercado tan populares como los fractales avanzados de Bill Williams , Valable ZigZag que construye la estructura de onda correcta del mercado y los niveles de Fibonacci que marcan los niveles exactos de entrada. en el mercado y lugares para tomar ganancias. Descripción detallada de la estrategia Instrucciones para trabajar con el indicador Asesor de c
PipFinite Trend PRO MT5
Karlo Wilson Vendiola
4.84 (551)
Breakthrough Solution For Trend Trading And Filtering With All Important Features Built Inside One Tool! Trend PRO's smart algorithm detects the trend, filters out market noise and gives entry signals with exit levels. The new features with enhanced rules for statistical calculation improved the overall performance of this indicator. Important Information Revealed Maximize the potential of Trend Pro, please visit www.mql5.com/en/blogs/post/713938 The Powerful Expert Advisor Version Automatin
Description : Rainbow EA MT5 is a simple Expert advisor based on   Rainbow MT5 indicator witch is based on Moving average with period 34. The indicator is incorporated in the EA, therefore, it is not required for the EA to operate, but if you wish, you can download it from   my product page . The Expert Advisor settings are as follows : Suitable for Timeframes up to H1 The parameters below can be set according to your trading rules. StopLoss ( Stop Loss in pips) TakeProfit ( Take Profit in pips
¡El nivel Premium es un indicador único con más del 80% de precisión de predicciones correctas! ¡Este indicador ha sido probado por los mejores especialistas en comercio durante más de dos meses! ¡El indicador del autor no lo encontrarás en ningún otro lugar! ¡A partir de las capturas de pantalla, puede ver por sí mismo la precisión de esta herramienta! 1 es ideal para operar con opciones binarias con un tiempo de vencimiento de 1 vela. 2 funciona en todos los pares de divisas, acciones, m
Noize Absorption Index - is the manual trading system that measures the difference of pressure between bears forces and bulls forces. Green line - is a noize free index that showing curent situation. Zero value of index shows totally choppy/flat market.Values above zero level shows how powerfull bullish wave is and values below zero measures bearish forces.Up arrow appears on bearish market when it's ready to reverse, dn arrow appears on weak bullish market, as a result of reverse expectation.
STRICTLY FOR BOOM INDEX ONLY!!!!! Here I bring the Maximum Trend Arrows OT1.0 MT5 indicator. This indicator is made up of a combination of different trend indicators for entries and exits, for entries an orange arrow will paint on the chart below the current market and a red flag for closing of trades and it produces buy arrows only. When the orange arrow appears, it will appear along with it's sound to notify you. The 1H timeframe is recommended, don't use it anywhere else than on the 1H timefr
Ichimoku Aiko MTF
Michael Jonah Randriamampionontsoa
Ichimoku Aiko MTF is a collection of technical indicators that show support and resistance levels, as well as momentum and trend direction. It is a multi-timeframe indicator so you don't need to change the chart timeframe when you want to see the ichimoku clouds on a higher timeframe.  eg. The chart timeframe is M15 and you want to see on the M15 timeframe chart the H1 ichimoku indicators (the ichimoku in Metatrader can't do that) that's why you need to use Ichimoku Aiko MTF.
Trend Monitor MT5
Pavel Zamoshnikov
4.5 (2)
The indicator generates early signals basing on ADX reading data combined with elements of price patterns. Works on all symbols and timeframes. The indicator does not redraw its signals. You see the same things on history and in real time. For better visual perception signals are displayed as arrows (in order not to overload the chart). Features The best results are obtained when the indicator works on two timeframes. For example: M30 – the indicator shows the main trend; M5 – the indicator gen
SlopeChannelB MT5
MIKHAIL VINOGRADOV
SlopeChannelB – una herramienta de análisis técnico que construye un canal de movimiento de precios inclinado, ofreciendo oportunidades únicas para evaluar la situación actual del mercado y encontrar señales de trading. Características principales del indicador: Canal de movimiento de precios inclinado : El indicador ayuda a visualizar los niveles de soporte y resistencia, que pueden indicar puntos potenciales de reversión o continuación de la tendencia. Varios colores de líneas y resaltado
Atomic Analyst MT5
Issam Kassas
4.32 (19)
En primer lugar, vale la pena enfatizar que este Indicador de Trading no repinta, no redibuja y no se retrasa, lo que lo hace ideal tanto para el trading manual como para el automatizado. Manual del usuario: configuraciones, entradas y estrategia. El Analista Atómico es un Indicador de Acción del Precio PA que utiliza la fuerza y el impulso del precio para encontrar una mejor ventaja en el mercado. Equipado con filtros avanzados que ayudan a eliminar ruidos y señales falsas, y aumentan el poten
Advanced Trading Chaos  The main purpose of the indicator is to help the trader detect the signals described by Bill Williams in his books to make a quick and correct trading decision. 1)Bullish/Bearish Reversal Bar(BDB) 2) Divergent Bar(DB) 3) Second Sage Signal — the third consecutive Awesome Oscillator bar  4) Working fractals (Fractals that worked above/below the red forehead  5) Three bar coloring modes 5.1) Coloring of bars according to the AO indicator (Including the squatting bar) 5.2
Renko Gold
Ignacio Agustin Mene Franco
Renko Gold !  indica clara mente los pisos y techos donde va de 4 lineas ,  la linea de abajo que marca el piso en color verde confirmando con la linea mas fina aclara la entrada en compra ,  lo mismo es para la venta , la linea de arriba marca el techo y la mas fina de color  rojo marca la venta ,  este indicador sirve para todas las temporalidades !  Para los mercados de Forex y Indices sinteticos ! Tambien sirve para los mercados de crypto !  Buen Profit! World Inversor. 
Heiken Ashi Smoothed Strategy is a very simple but powerful system to get forex market trend direction. This indicator is actually 2 indicators in 1 pack, Heiken Ashi and Heiken Ashi Smoothed Moving Average both included. Because HA (Heiken Ashi) and HAS (Heiken Ashi Smoothed) are calculated in the same one system event with necessary buffers and loop only, so it is the FAST, OPTIMIZED and EFFICIENT HA having the combined indicator of MetaTrader 5. You can choose to display HA and HAS in the sam
Fractal 358 Plus
Renato Fridschtein
Fractal 358 Plus is a predictive indicator that provides the clearest sight of price movements. Identifying graphic patterns such as Caixote (Crate), Pivot and Inside Candle , it shows entries and exits spots, as well as threats to your trades in the markets. It comes ready to use with B3 Mini Index (WIN$ series) and can be adjusted to use with any asset and timeframe. Fractal 358 unravels price movement Based on the Fibonacci sequence, Fractal 358 is a new and different way of reading and und
Statistical Arbitrage Spread Generator for Cointegration [MT5] What is Pair Trading? Pair trading is a market-neutral strategy that looks to exploit the relative price movement between two correlated assets — instead of betting on the direction of the market. The idea? When two assets that usually move together diverge beyond a statistically significant threshold, one is likely mispriced. You sell the expensive one, buy the cheap one , and profit when they converge again. It’s a statistica
FREE
Mine Farm is one of the most classic and time-tested scalping strategies based on the breakdown of strong price levels. Mine Farm is the author's modification of the system for determining entry and exit points into the market... Mine Farm - is the combination of great potential with reliability and safety. Why Mine Farm?! - each order has a short dynamic Stop Loss - the advisor does not use any risky methods (averaging, martingale, grid, locking, etc.) - the advisor tries to get the most
Terra Infinity is a flat indicator. This improved version of the CalcFlat indicator has three additional lines that significantly increase its effectiveness. Unlike its predecessor with two static levels, Terra Infinity adds three dynamic lines above the main histogram, which are interpreted as follows: base signal line, minimum signal line, maximum signal line. These lines are formed using the additional parameter Avg, which is the average value of the histogram. Averaging produces a line cl
Supertrend   indicator uses a combination of a moving average and average true range to detect the trend of a trading instrument. Supertrend indicator for MetaTrader 5 easily shows the trend as a line following the price. You can use the second my indicator: You will see 3 supertrends and EMA 200 lines on the screen. Working with my product : https://www.mql5.com/en/market/product/80692
Advanced 4xZeovo MT5 Indicator (MetaTrader 5)   Product Description  4xZeovo is a powerful trading indicator system monitoring 24/7 financial markets. Metatrader5 tool designed to find the best buying/selling opportunities and notifies the user.    Making life easy for traders in helping with the two most difficult decisions with the use of advanced innovate trading indicators aiming to encourage users to hold the winning positions and take profit at the best times.    Equipped with a unique tra
The indicator displays a matrix of indicators across multiple timeframes with a sum total and optional alert. Custom indicators can also be added to the matrix, in a highly configurable way. The alert threshold can be set to say what percentage of indicators need to be in agreement for an alert to happen. The alerts can turned on/off via on chart tick boxes and can be set to notify to mobile or sent to email, in addition to pop-up. The product offers a great way to create an alert when multiple
The standard Bollinger Bands indicator has been improved by integrating additional indications from the Standard Deviation indicator (StdDev), which gives an additional filter for confirming trading signals. In addition, the color of the indicator's lines shows the beginning of a trend, its development and exhaustion. This indicator has a signal block that notifies the trader of the beginning of the trend on any time frame to which it is attached. Settings Type of messages - select the type of
Stratos Pali mt5
Michela Russo
4.43 (7)
Stratos Pali Indicator is a revolutionary tool designed to enhance your trading strategy by accurately identifying market trends. This sophisticated indicator uses a unique algorithm to generate a complete histogram, which records when the trend is Long or Short. When a trend reversal occurs, an arrow appears, indicating the new direction of the trend. Important Information Revealed Leave a review and contact me via mql5 message to receive My Top 5 set files for Stratos Pali at no cost ! Down
Your Trend Friend
Luigi Nunes Labigalini
5 (1)
The trend is your friend! Look at the color of the indicator and trade on that direction. It does not  repaint. After each candle is closed, that's the color of the trend. You can focus on shorter faster trends or major trends, just test what's most suitable for the symbol and timeframe you trade. Simply change the "Length" parameter and the indicator will automatically adapt. You can also change the color, thickness and style of the lines. Download and give it a try! There are big movements w
Daily Pivots Multi Indicator Daily Pivots Multi is an exclusive indicator to draw your pivots levels and much more. Most indicators draw daily pivots for the day. Daily Pivots Multi is able to draw levels for different days. The indicator can do the calculation for unlimited number of days backward. It means that you can draw the levels for today but also for the past days. This is very useful if you want to study a strategy with Pivots levels over a period of time. Another problem is that e
El indicador SMC Venom Model BPR es una herramienta profesional para operadores que trabajan con el concepto de Dinero Inteligente (SMC). Identifica automáticamente dos patrones clave en el gráfico de precios: FVG   (Fair Value Gap) es una combinación de tres velas, con un gap entre la primera y la tercera. Forma una zona entre niveles donde no hay soporte de volumen, lo que suele provocar una corrección del precio. BPR   (Balanced Price Range) es una combinación de dos patrones FVG que forman
Introduction to the Manual Backtesting Indicator on MQL5 The MetaTrader platform provides an excellent backtesting tool for evaluating Expert Advisors (EAs). However, when it comes to manually backtesting a strategy to assess its effectiveness, this tool has some limitations: You cannot manually draw zones or trend lines while in backtesting mode. You cannot switch timeframes to check time alignment. For example, if my strategy requires additional confirmation from a higher timeframe (HTF), this
Rigonstructor
Mark Lapukha
5 (1)
Este es un constructor. Es decir, el creador de estrategias. Y no sólo. Este es un indicador de señal para la mayoría de los indicadores estándar integrados en MetaTrader 5. Combine sus indicadores en una flecha de señal. Por ejemplo, tienes una estrategia y necesitas conocer su rentabilidad, incluir los elementos necesarios en el menú y obtener estadísticas. Y si no tiene una estrategia, búsquela en Internet o cree la suya propia. Rigonstruktor te ayudará con todo esto. El kit incluye estrategi
SolarTrade Suite Financial Indicator: Jupiter Market Indicator - ¡Su guía confiable en el mundo de los mercados financieros! Este es un indicador de tendencia que utiliza algoritmos especiales innovadores y avanzados para calcular su valor, y también tiene un diseño agradable a la vista. Es muy fácil entender las lecturas de este indicador: color azul - compra, rojo - venta. Vea nuestros otros productos de la serie SolarTrade Suite en la parte inferior de la descripción. ¿Quiere navegar con
Acerca del Indicador Este indicador se basa en simulaciones de Monte Carlo sobre los precios de cierre de un instrumento financiero. Por definición, Monte Carlo es una técnica estadística utilizada para modelar la probabilidad de diferentes resultados en un proceso que implica números aleatorios basados en resultados observados previamente. ¿Cómo Funciona? Este indicador genera múltiples escenarios de precios para un valor, modelando cambios de precios aleatorios a lo largo del tiempo basados e
Los compradores de este producto también adquieren
Golden Trend Indicator MT5
Noha Mohamed Fathy Younes Badr
4.89 (18)
Golden Trend indicator  is The best indicator for predicting trend movement this indicator never lags and never repaints and never back paints    and give  arrow buy and sell    before the candle appear  and it will help you and  will make your trading decisions clearer its work on all currencies and  gold and crypto and all time frame This unique  indicator uses very secret algorithms to catch the  trends, so you can trade using this indicator and see the trend clear on charts  manual guide and
TPSpro RFI Levels MT5
Roman Podpora
4.55 (20)
Zonas de reversión / Volúmenes máximos / Zonas activas de un jugador importante =       SISTEMA TS TPSPRO INSTRUCCIONES RUS       /       INSTRUCCIONES       ESP       /           Versión MT4        Cada comprador de este indicador recibe adicionalmente GRATIS: 3 meses de acceso a señales comerciales del servicio RFI SIGNALS: puntos de entrada listos para usar según el algoritmo TPSproSYSTEM. Materiales de formación con actualizaciones periódicas: sumérgete en la estrategia y haz crecer tu niv
TPSproTREND PrO MT5
Roman Podpora
4.72 (18)
VERSION MT4        —        ИНСТРУКЦИЯ RUS           —        INSTRUCTIONS  ENG Funciones principales: Señales de entrada precisas ¡SIN RENDERIZACIÓN! Si aparece una señal, ¡sigue siendo relevante! Esta es una diferencia importante con respecto a los indicadores de redibujo, que pueden proporcionar una señal y luego cambiarla, lo que puede provocar una pérdida de fondos depositados. Ahora puedes ingresar al mercado con mayor probabilidad y precisión. También existe la función de colorear las v
RelicusRoad Pro MT5
Relicus LLC
4.78 (18)
Ahora $ 147 (aumentando a $ 499 después de algunas actualizaciones) - Cuentas ilimitadas (PC o Mac) Manual de usuario de RelicusRoad + Videos de capacitación + Acceso al grupo privado de Discord + Estado VIP UNA NUEVA MANERA DE VER EL MERCADO RelicusRoad es el indicador comercial más poderoso del mundo para divisas, futuros, criptomonedas, acciones e índices, y brinda a los comerciantes toda la información y las herramientas que necesitan para mantenerse rentables. Brindamos análisis técnico
MTF Supply Demand Zones MT5
Georgios Kalomoiropoulos
5 (1)
Próxima generación de zonas de oferta y demanda automatizadas. Algoritmo nuevo e innovador que funciona en cualquier gráfico. Todas las zonas se crean dinámicamente de acuerdo con la acción del precio del mercado. DOS TIPOS DE ALERTAS --> 1)CUANDO EL PRECIO LLEGA A UNA ZONA 2)CUANDO SE FORMA UNA NUEVA ZONA No obtienes un indicador inútil más. Obtiene una estrategia comercial completa con resultados probados.     Nuevas características:     Alertas cuando el precio llega a la zona de ofert
Quantum TrendPulse
Bogdan Ion Puscasu
5 (13)
Presentamos   Quantum TrendPulse   , la herramienta de trading definitiva que combina el poder de   SuperTrend   ,   RSI   y   Stochastic   en un indicador integral para maximizar su potencial de trading. Diseñado para traders que buscan precisión y eficiencia, este indicador le ayuda a identificar tendencias del mercado, cambios de impulso y puntos de entrada y salida óptimos con confianza. Características principales: Integración con SuperTrend:   siga fácilmente la tendencia predominante del
FxaccurateLS
Shiv Raj Kumawat
WHY IS OUR FXACCCURATE LS MT5 THE PROFITABLE ? PROTECT YOUR CAPITAL WITH RISK MANAGEMENT Gives entry, stop and target levels from time to time. It finds Trading opportunities by analyzing what the price is doing during established trends. POWERFUL INDICATOR FOR A RELIABLE STRATEGIES We have made these indicators with a lot of years of hard work. It is made at a very advanced level. Established trends provide dozens of trading opportunities, but most trend indicators completely ignore them! The
Este es un genial indicador para MT5 que ofrece señales precisas para entrar en una transacción sin redibujar. Se puede aplicar a cualquier activo financiero: fórex, criptomonedas, metales, acciones, índices. Nos dará valoraciones bastante precisas y nos dirá cuándo es mejor abrir y cerra una transacción. Eche un vistazo  al vídeo  (6:22), ¡contiene un ejemplo de procesamiento de una sola señal que ha amortizado el indicador! La mayoría de los tráders mejoran sus resultados comerciales durante l
Blahtech Supply Demand MT5
Blahtech Limited
4.54 (13)
Was: $299  Now: $149  Supply Demand uses previous price action to identify potential imbalances between buyers and sellers. The key is to identify the better odds zones, not just the untouched ones. Blahtech Supply Demand indicator delivers functionality previously unavailable on any trading platform. This 4-in-1 indicator not only highlights the higher probability zones using a multi-criteria strength engine, but also combines it with multi-timeframe trend analysis, previously confirmed swings
MetaBands M5
Vahidreza Heidar Gholami
4.5 (2)
MetaBands utiliza algoritmos potentes y únicos para dibujar canales y detectar tendencias para que pueda proporcionar a los traders puntos potenciales para entrar y salir de operaciones. Es un indicador de canal junto con un potente indicador de tendencia. Incluye diferentes tipos de canales que se pueden fusionar para crear nuevos canales simplemente utilizando los parámetros de entrada. MetaBands utiliza todos los tipos de alertas para notificar a los usuarios sobre eventos del mercado. Caract
[ MT4 Version ]  [ Order Blocks ]  [ Kill Zones ]  [ SMT Divergences ] How to trade using Order Blocks :  Click here User Interface Performance:  During testing in the strategy tester, the UI may experience lag. Rest assured, this issue is specific to the testing environment and does not affect the indicator's performance in live trading. Elevate your trading strategy with the  Order Blocks ICT Multi TF  indicator, a cutting-edge tool designed to enhance your trading decisions through advanced o
[ MT4 Version ]  [ Kill Zones ]  [ SMT Divergences ] How to trade using Order Blocks:  Click here User Interface Performance:  During testing in the strategy tester, the UI may experience lag. Rest assured, this issue is specific to the testing environment and does not affect the indicator's performance in live trading. Elevate your trading strategy with the  Order Blocks ICT Multi TF  indicator, a cutting-edge tool designed to enhance your trading decisions through advanced order block analysis
[ MT4 Version ] Are you tired of spending months on demo or live accounts to test your trading strategies? The Backtesting Simulator is the ultimate tool designed to elevate your backtesting experience to new heights. Utilizing Metatrader historical symbol information, it offers an unparalleled simulation of real market conditions. Take control of your testing speed, test ideas quickly or at a slower pace, and witness remarkable improvements in your testing performance. Forget about wasting tim
IQ Gold Gann Levels a non-repainting, precision tool designed exclusively for XAUUSD/Gold intraday trading. It uses W.D. Gann’s square root method to plot real-time support and resistance levels, helping traders spot high-probability entries with confidence and clarity. William Delbert Gann (W.D. Gann) was an exceptional market analyst, whose trading technique was based on a complex blend of mathematics, geometry, astrology, and ancient mathematics which proved to be extremely accurate. Download
AT Forex Indicator MT5
Marzena Maria Szmit
5 (5)
The AT Forex Indicator MT5 is a sophisticated trading tool designed to provide traders with a comprehensive analysis of multiple currency pairs. This powerful indicator simplifies the complex nature of the forex market, making it accessible for both novice and experienced traders. AT Forex Indicator uses advanced algorithms to detect trends, patterns and is an essential tool for traders aiming to enhance their forex trading performance. With its robust features, ease of use, and reliable signal
VolumeProfile MT5
Robert Hess
4.14 (7)
Description: The Volume Profile displays detailed informations of historical trading activities at certain price levels (Market Profile). Locate the areas with the best prices in the market and get an advantage over other market participants. Features: Customizable Market Profile Shows the "fair" Value Area with 70% of all Volume Shows critical low volume zones Shows VPOC, VAL and VAH Points integrated resource management to reduce the load while working with multiple charts Works on all timefr
The Naveen Dynamic Square  MT5  is one of the best known  technical analysis tools  inspired  by WD Gann along with the Gann Fan and Gann Box. It is considered a cornerstone of his trading technique that is based on time and price symmetry. The Naveen Dynamic Square MT5   is a powerful tool in finance for determining support and resistance levels based on a stock's extreme price points. It works by extrapolating probable price levels from a central value, typically an all-time or cyclical high o
Royal Scalping Indicator M5
Vahidreza Heidar Gholami
5 (6)
Royal Scalping Indicator is an advanced price adaptive indicator designed to generate high-quality trading signals. Built-in multi-timeframe and multi-currency capabilities make it even more powerful to have configurations based on different symbols and timeframes. This indicator is perfect for scalp trades as well as swing trades. Royal Scalping is not just an indicator, but a trading strategy itself. Features Price Adaptive Trend Detector Algorithm Multi-Timeframe and Multi-Currency Trend Low
Este es posiblemente el indicador de reconocimiento automático de formación de precios más completo que puede encontrar para la plataforma MetaTrader. Detecta 19 patrones diferentes, toma las proyecciones de Fibonacci tan en serio como usted, muestra la zona de reversión potencial (PRZ) y encuentra niveles adecuados de stop-loss y take-profit. [ Guía de instalación | Guía de actualización | Solución de problemas | FAQ | Todos los productos ] Detecta 19 formaciones de precios armónicos diferen
Advanced Supply Demand MT5
Bernhard Schweigert
4.5 (14)
¡Actualmente con 33% de descuento! ¡La mejor solución para cualquier tráder principiante o experto! Este indicador es una herramienta comercial única, de alta calidad y asequible, porque incorpora una serie de características patentadas y una nueva fórmula. Con esta actualización, podrá mostrar zonas de doble marco temporal. No solo podrá mostrar un marco temporal más alto, sino también mostrar ambos, el marco temporal del gráfico MÁS el marco temporal más alto: MOSTRANDO ZONAS ANIDADAS. A todos
KT Candlestick Patterns MT5
KEENBASE SOFTWARE SOLUTIONS
KT Candlestick Patterns detecta y marca en tiempo real los 24 patrones de velas japonesas más confiables. Desde el siglo XVIII, los traders japoneses han utilizado estos patrones para predecir la dirección del precio. Es cierto que no todos los patrones de velas tienen la misma fiabilidad para predecir el mercado. Sin embargo, cuando se combinan con otros métodos de análisis técnico como Soporte y Resistencia, proporcionan una visión clara del comportamiento del mercado. Este indicador incluye
CBT Quantum Maverick Sistema de Comercio de Opciones Binarias de Alta Eficiencia CBT Quantum Maverick es un sistema de opciones binarias de alto rendimiento diseñado para traders que buscan precisión, simplicidad y un enfoque disciplinado. No requiere personalización: el sistema está optimizado para resultados efectivos desde el primer momento. Simplemente sigue las señales, que se pueden dominar con un poco de práctica. Características clave: Precisión de señales: Señales basadas en la próxim
MetaForecast M5
Vahidreza Heidar Gholami
5 (3)
MetaForecast predice y visualiza el futuro de cualquier mercado basándose en las armonías de los datos de precios. Aunque el mercado no siempre es predecible, si existe un patrón en el precio, MetaForecast puede predecir el futuro con la mayor precisión posible. En comparación con otros productos similares, MetaForecast puede generar resultados más precisos al analizar las tendencias del mercado. Parámetros de entrada Past size (Tamaño del pasado) Especifica el número de barras que MetaForecast
El Oscilador de Índice de Precisión (Pi-Osc) de Roger Medcalf de Precision Trading Systems La versión 2 ha sido cuidadosamente recodificada para cargar rápidamente en su gráfico y se han incorporado algunas otras mejoras técnicas para mejorar la experiencia. El Pi-Osc fue creado para proporcionar señales precisas de temporización de operaciones diseñadas para encontrar puntos de agotamiento extremos, los puntos a los que los mercados se ven obligados a llegar solo para eliminar las órdenes de
Indicador único que implementa un enfoque profesional y cuantitativo para el comercio de reversión a la media. Aprovecha el hecho de que el precio se desvía y vuelve a la media de manera predecible y medible, lo que permite reglas claras de entrada y salida que superan ampliamente las estrategias comerciales no cuantitativas. [ Installation Guide | Update Guide | Troubleshooting | FAQ | All Products ] Señales comerciales claras Sorprendentemente fácil de operar Colores y tamaños personalizables
The   Time_Price_SQ9_Degree   indicator is based on the 9 Gann square. Using this indicator, you can identify strong time and price zones. The indicator displays the levels as a degree value. The degrees can be set in the settings. After launching, the MENU button appears. If it is highlighted, it can be moved to any point on the graph, and after double-clicking on it, it stops being highlighted and menu buttons appear. To hide the menu, just double-click on the button, it will become highlight
Volume by Price MT5
Brian Collard
3.25 (4)
Volume Profile, Footprint and Market Profile TPO (Time Price Opportunity). Volume and TPO histogram bar and line charts. Volume Footprint charts. TPO letter and block marker collapsed and split structure charts. Static, dynamic and flexible range segmentation and compositing methods with relative and absolute visualizations. Session hours filtering and segment concatenation with Market Watch and custom user specifications. Graphical layering, positioning and styling options to suit the user's a
DESCRIPCIÓN ICSM (Impulse-Correction SCOB Mapper) es el indicador que analiza el movimiento del precio e identifica impulsos válidos, correcciones y SCOBs (Single Candle Order Block). Es una herramienta poderosa que se puede utilizar con cualquier tipo de análisis técnico porque es flexible, informativa, fácil de usar y mejora sustancialmente la conciencia del trader sobre las zonas de interés más líquidas. CONFIGURACIÓN General | Visuales Tema de color — define el tema de color del ICSM.
Was: $249  Now: $149   Market Profile defines a number of day types that can help the trader to determine market behaviour. A key feature is the Value Area, representing the range of price action where 70% of trading took place. Understanding the Value Area can give traders valuable insight into market direction and establish the higher odds trade. It is an excellent addition to any system you may be using. Inspired by Jim Dalton’s book “Mind Over Markets”, this indicator is designed to suit the
Berma Bands
Muhammad Elbermawi
5 (3)
El indicador de bandas de Berma (BB) es una herramienta valiosa para los operadores que buscan identificar y aprovechar las tendencias del mercado. Al analizar la relación entre el precio y las bandas de Berma, los operadores pueden discernir si un mercado se encuentra en una fase de tendencia o de rango. Visita el [ Blog de Berma Home ] para saber más. Las bandas de Berma se componen de tres líneas distintas: la banda de Berma superior, la banda de Berma media y la banda de Berma inferior. Esta
Otros productos de este autor
Reversal Area
Justin Ray Martin
The Reversal Area EA is designed to identify likely price ranges for price to turn from. This EA is used in conjunction with other EA's that I developed and serves as filtering tool to keep from entering too early. The overall idea is to be a buyer below the green line. A seller above the green line for the sell version. The second thing to keep in mind is time. When price fluctuate over the course of a few days and move further below this zone (long bias) it offers greater likelihood of settin
FREE
The Reversal Area EA is designed to identify likely price ranges for price to turn from. This EA is used in conjunction with other EA's that I developed and serves as filtering tool to keep from entering too early. The overall idea is to be a seller above the green line. A buyer below the green line for the buy version. The second thing to keep in mind is time. When price fluctuate over the course of a few days and move further below this zone (long bias) it offers greater likelihood of setting
FREE
Ribbon Zones
Justin Ray Martin
This Ribbon graphical template helps to identify potential turning points. Statistically, it's rare for price to push down and continue before the red buy zone or push up and continue before reaching the top blue sell zone. These zones serves as potential entry areas. Even if price does intend to go lower, it's usually some upside first. Vice versa for selling. Even if price does hit 2-3 consecutive zones in a row, the likelihood of price turning becomes much stronger. A great way of filtering o
Filtro:
No hay comentarios
Respuesta al comentario