• 미리보기
  • 리뷰
  • 코멘트 (2)
  • 새 소식

NTickChart

NtickChart-BVcandle

Features

This is a free version with limited functionality.

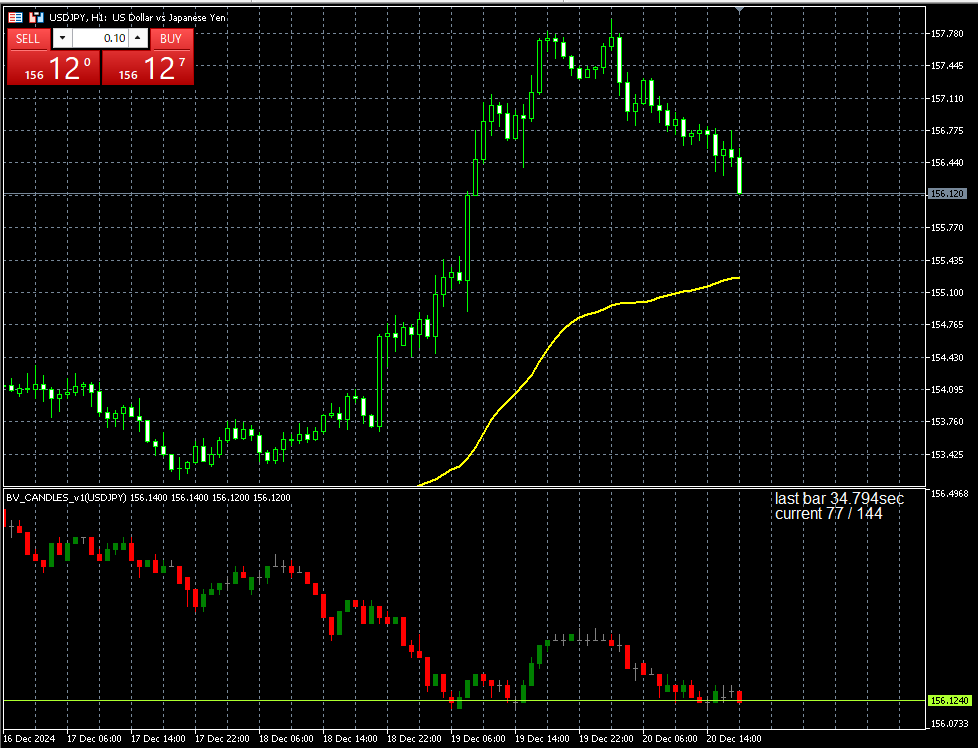
This is a tick chart indicator that displays in a sub-window.
Inspired by Bob Volman's (BV) scalping method, it is designed as a tool for achieving simple and effective trading. It is a tick chart specifically for day trading and scalping, focusing even on 1 pipette changes. Instead of time-based candle bars, it generates candle bars for a specified number of ticks (ticks_in_candle). This allows for a more detailed observation of short-term price fluctuations.
This indicator is particularly suitable for scalping in highly liquid currency pairs like EUR/USD, in environments with low spreads.
  •  Capture sudden market movements and aim for short-term profits.
  •  Quickly identify trend reversals and breakout points.
  •  Trade with a simple chart structure, avoiding distractions from unnecessary information.

Available Features:
  • Tick count can be adjusted. BV recommends 70, but in today's high-volume trading environment, I recommend 144.
  • The current price line can display Bid, Ask, or Mid (the midpoint between Ask and Bid) prices individually.
  • Candlestick price values can be displayed in raw form (Nop) or rounded using one of the following methods: Round, Up, or Down.
  • Colors can be customized.
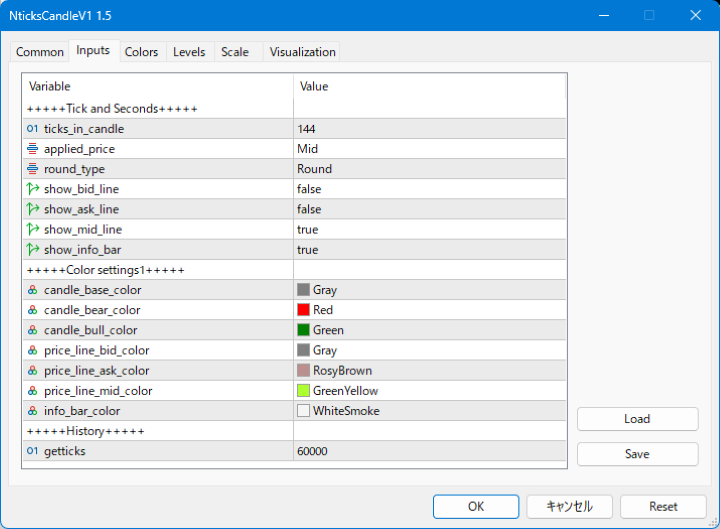
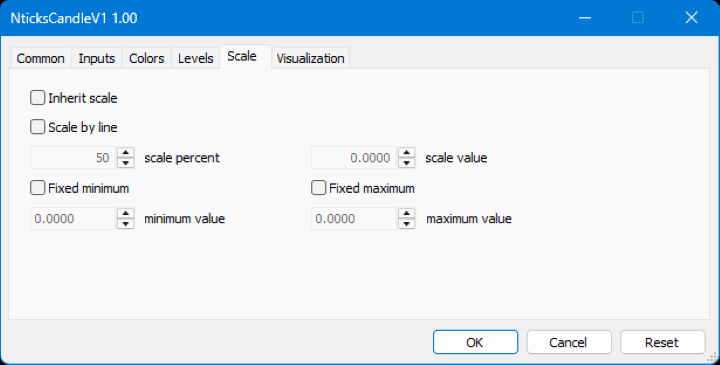
Default Settings

//--- input parameters

input group "+++++Tick and Seconds+++++";
input uint ticks_in_candle = 144; // Number of ticks per bar
input Eprice_types applied_price = Mid; // Price display type
input Eround_types round_type = Round; // Rounding display
input bool show_bid_line = false;
input bool show_ask_line = false;
input bool show_mid_line = true;

input group "+++++Color settings1+++++";
input color candle_base_color = clrGray;
input color candle_bear_color = clrRed;
input color candle_bull_color = clrGreen;
input color price_line_bid_color = clrGray;
input color price_line_ask_color = clrRosyBrown;
input color price_line_mid_color = clrGreenYellow;


Usage Notes (Limitations)
This indicator does not save buffer values to a file.
Other indicators cannot be overlaid on this tick chart.

How to Use
  1. Set the input parameters to your preferred values. The default settings are the creator's recommended configuration.
  2. Attach the indicator to the desired chart. There are no restrictions on currency pairs or timeframes (it is recommended to use it on timeframes below 5 minutes).
  3. Use it to assist in discretionary trading based on Bob Volman's method.


    추천 제품
    Haven Key Levels PDH PDL
    Maksim Tarutin
    5 (4)
    인디케이터   "Haven Key Levels PDH PDL"   는 트레이더가 차트에서 중요한 레벨을 시각화하는 데 도움을 줍니다. 다음 레벨들을 자동으로 표시합니다: DO (Daily Open)   — 하루 시작 레벨. NYM (New York Midnight)   — 뉴욕 자정 레벨. PDH (Previous Day High)   — 전일 최고가. PDL (Previous Day Low)   — 전일 최저가. WO (Weekly Open)   — 주간 시작 레벨. MO (Monthly Open)   — 월간 시작 레벨. PWH (Previous Week High)   — 전주 최고가. PWL (Previous Week Low)   — 전주 최저가. 기타 제품 ->  여기 도구 설정 옵션: 색상 및 선 두께 선택: 레벨의 색상 설정:   NYM, DO, WO, MO, PDH, PDL, PWH, PWL. 선 두께 조정. 레벨 표시 제어: 레벨 선 표시 온/오프:   NYM, P
    FREE
    DALA Forecast
    Grigorii Matsnev
    About the indicator: DALA Forecast is a universal tool for predicting the dynamics of time series of any nature. For prediction, modified methods of nonlinear dynamics analysis are used, on the basis of which a predictive model is built using machine learning methods.  To get the trial version of the indicator, you can contact me in private messages. How to use the indicator: Apply the indicator to your chosen financial instrument or indicator with the settings you need. The prediction will be
    FREE
    Indicator and Expert Adviser  EA Available in the comments section of this product. Download with Indicator must have indicator installed for EA to work. Mt5 indicator alerts for bollinger band and envelope extremes occurring at the same time. Buy signal alerts occur when A bullish candle has formed below both the lower bollinger band and the lower envelope  Bar must open and close below both these indicators. Sell signal occur when A bear bar is formed above the upper bollinger band and upper
    FREE
    Fibonacci Trend Indicator
    Vinoth Durairaj Durairaj
    Fibonacci Trend Indicator for MT5 Unlock the power of Fibonacci analysis on your MetaTrader 5 charts! Our   Fibonacci Trend Indicator   automatically plots dynamic support and resistance levels so you can spot trends, reversals, and breakout opportunities at a glance. Features & Advantages Automatic Fibonacci Levels Instantly displays seven key Fibonacci retracement levels based on the highest and lowest prices from your chosen lookback period — no manual work required. Dynamic Trend Adaptatio
    FREE
    ROMAN5 Time Breakout Indicator automatically draws the boxes for daily support and resistance breakouts. It helps the user identifying whether to buy or sell. It comes with an alert that will sound whenever a new signal appears. It also features an email facility. Your email address and SMTP Server settings should be specified in the settings window of the "Mailbox" tab in your MetaTrader 5. Blue arrow up = Buy. Red arrow down = Sell. You can use one of my Trailing Stop products that automatical
    FREE
    Trend Catcher with Alert MT5
    Issam Kassas
    4.67 (89)
    트렌드 캐쳐: 알림 인디케이터와 함께 하는 트렌드 캐쳐 전략은 시장 트렌드와 잠재적인 진입 및 체크 포인트를 식별하는 데 도움이 되는 다목적 기술 분석 도구입니다. 이는 시장 상황에 적응하여 트렌드 방향을 명확하게 시각적으로 표현하는 동적 트렌드 캐쳐 전략을 제공합니다. 트레이더는 선호도와 위험 허용도에 맞게 매개변수를 사용자 정의할 수 있습니다. 이 인디케이터는 트렌드 식별을 지원하고 잠재적인 반전을 신호로 제공하며 트레일링 스탑 메커니즘으로 작동하며 실시간 경고를 제공하여 신속한 시장 대응을 돕습니다. 특징: - 트렌드 식별: 상승 트렌드와 하락 트렌드를 신호합니다. - 트렌드 반전: 양봉 색상이 상승에서 하락으로 변경되거나 그 반대의 경우 잠재적인 반전을 경고합니다. - 실시간 경고: 새로운 트렌드 식별을 위한 경고를 생성합니다. 추천사항: - 통화 및 페어: EURUSD, AUDUSD, XAUUSD 등... - 시간 프레임: H1. - 계정 유형: 모든 ECN 계정
    FREE
    Order Book, known also as Market Book, market depth, Level 2, - is a dynamically updated table with current volumes of orders to buy and to sell specific financial instument at price levels near Bid and Ask. MetaTrader 5 provides the means for receiving market book from your broker, but in real time only, without access to its history. The indicator OrderBook Cumulative Indicator accumulates market book data online and visualizes them on the chart. In addition, the indicator can show the market
    Follow The Line MT5
    Oliver Gideon Amofa Appiah
    4.52 (29)
    This indicator obeys the popular maxim that: "THE TREND IS YOUR FRIEND" It paints a GREEN line for BUY and also paints a RED line for SELL. (you can change the colors). It gives alarms and alerts of all kinds. IT DOES NOT REPAINT and can be used for all currency pairs and timeframes. Yes, as easy and simple as that. Even a newbie can use it to make great and reliable trades. NB: For best results, get my other premium indicators for more powerful and reliable signals. Get them here: https://www.m
    FREE
    Tops and Bottoms Indicator
    Josue De Matos Silva
    4.67 (6)
    Tops & Bottoms Indicator FREE   Tops abd Bottoms:   An effective indicator for your trades The tops and bottoms indicator helps you to find  ascending and descending channel formations with indications of ascending and/or descending tops and bottoms. In addition, it  show possibles  opportunities with a small yellow circle when the indicator encounters an impulse formation. This indicator provide to you  more security and speed in making entry decisions. Also test our FREE advisor indicator:  
    FREE
    헤이킨 아시 MT5 인디케이터 헤이킨 아시 MT5 인디케이터는 표준 가격 데이터를 더 부드럽고 추세 중심의 캔들스틱으로 변환하여 시장 트렌드와 잠재적인 역전 지점을 더 쉽게 식별할 수 있도록 하는 강력한 도구입니다. 주요 특징: 명확한 트렌드 식별: 다른 캔들 색상으로 상승 추세와 하락 추세를 시각적으로 구분합니다. 노이즈 감소: 가격 변동을 필터링하여 시장의 주요 움직임을 더 명확하게 표시합니다. 조기 트렌드 감지: 표준 차트에서 트렌드 변화가 명확해지기 전에 잠재적인 트렌드 변화를 예측합니다. 다용도성: 독립적으로 사용하거나 다른 기술적 지표와 함께 종합적인 분석에 사용할 수 있습니다. 사용자 정의 설정: 인디케이터를 특정 거래 선호도와 전략에 맞게 조정할 수 있습니다. 장점: 트렌드를 식별하고 잠재적인 진입 및 청산 지점을 파악하는 능력을 향상시킵니다. 시장 노이즈의 영향을 줄이고 중요한 가격 변동에 집중합니다. 시장 역학에 대한 더 명확한 이해를 바탕으로 더 나은 거래 결정
    FREE
    Donchian Channel DC
    Renato Takahashi
    Donchian Channel DC is the indicator of Donchian Channels, that plots maximum and minimum values of a specific period, besides mean value line. It´s possible to configure simple period for analysis and the indicator will plot all three values. You can trade with this indicator as trend or reversal, according to each strategy. Do not let to test others indicators as soon as others expert advisors.
    WH DrawFib Pro MT5
    Wissam Hussein
    5 (8)
    차트에 수동으로 피보나치 레벨을 그리는 데 지쳤습니까? 거래에서 주요 지지선과 저항선을 식별할 수 있는 편리하고 효율적인 방법을 찾고 계십니까? 더 이상 보지 마세요!   자동   피보나치   수준   을   수행하는 최고의 MetaTrader 5 지표인 DrawFib Pro를 소개합니다.       차트에 그림을 그리고 이러한 수준이 위반되면 적시에 경고를 제공합니다. DrawFib Pro를 사용하면 거래 전략을 강화하고 시간을 절약하며 정보에 입각한 결정을 내릴 수 있습니다. 내 피보나치 기반 지표 :   Advanced Gartley Pattern MT5   ||    Price Wave Pattern MT5 주요 특징들: 자동화된   피보나치 그리기. 사용자 지정 가능한   매개변수. 정확  하고  신뢰할 수 있음. 실시간   알림. 사용자   친화적인   인터페이스. DrawFib Pro는 효율적이고 신뢰할 수 있으며 사용자 친화적인 방식으로 차트에 피보나치를 자동으로 그리
    FREE
    LT Rainbow Trend
    Thiago Duarte
    5 (1)
    Do you, like me, like to trade with the trend? Then this indicator will help you! Rainbow Trend is a trend indicator, which uses several Moving Averages on the chart. It measures different trend strenght zones for different periods: very long term, long term, mid term, short term and very short term. Each zone has its color, and it is possible to have sound alert when the prices leaves a zone and enters another. Its configuration is very simple. If you find any bug or have any suggestions, conta
    Important Lines
    Terence Gronowski
    4.86 (21)
    This indicator displays Pivot-Lines, preday high and low, preday close and the minimum and maximum of the previous hour. You just have to put this single indicator to the chart to have all these important lines, no need to setup many single indicators. Why certain lines are important Preday high and low : These are watched by traders who trade in a daily chart. Very often, if price climbs over or falls under a preday low/high there is an acceleration in buying/selling. It is a breakout out of a
    FREE
    Mitimom
    Danil Poletavkin
    The indicator is based on Robert Miner's methodology described in his book "High probability trading strategies" and displays signals along with momentum of 2 timeframes. A Stochastic oscillator is used as a momentum indicator. The settings speak for themselves period_1 is the current timeframe, 'current' period_2 is indicated - the senior timeframe is 4 or 5 times larger than the current one. For example, if the current one is 5 minutes, then the older one will be 20 minutes The rest of the s
    FREE
    Haven FVG Indicator
    Maksim Tarutin
    5 (1)
    인디케이터   Haven FVG   는 시장을 분석하는 도구로, 차트에서 비효율성 영역(Fair Value Gaps, FVG)을 식별하여 트레이더에게 가격 분석 및 거래 결정을 위한 주요 수준을 제공합니다. 다른 제품 ->  여기 주요 특징: 개별 색상 설정: 상승 FVG 색상   (Bullish FVG Color). 하락 FVG 색상   (Bearish FVG Color). 유연한 FVG 시각화: FVG를 검색할 최대 캔들 수. FVG 영역을 특정 바 수만큼 추가로 연장. FVG에 대한 채우기를 활성화할 수 있습니다. 중앙선(Middle Line): 색상 및 선 스타일 선택(예: 점선). 더 정확한 선 두께 조정. 일반 설정: FVG를 현재 바까지 확장. 채우기가 있는 역사적 FVG 제외하여 최신 데이터에 집중. 차트에서 비효율성 영역을 분석하고 근거 있는 거래 결정을 내리는 간단하고 효과적인 방법.
    FREE
    Coral Indi
    Dinh Duong Luong
    Coral trend is   a trend-following indicator that is widely popular among FOREX traders . It is usually used as a confluence with other indicators. It uses combinations of moving averages with complex smoothing formulas! It has two configurable parameters: Coefficient   - smoothing ratio (*) Applied price Calculation: Coral = (-0.064) * B6 + 0.672 * B5 - 2.352 * B4 + 2.744 * B3
    FREE
    Trendline mt5 indicator
    David Muriithi
    3 (1)
    Are you tired of drawing trendlines every time you're analyzing charts? Or perhaps you would like more consistency in your technical analysis. Then this is for you. This indicator will draw trend lines automatically when dropped on a chart. How it works Works similar to standard deviation channel found on mt4 and mt5. It has 2 parameters: 1. Starting Bar 2. Number of bars for calculation The   starting bar   is the bar which drawing of the trend lines will begin, while the   number of bars for c
    FREE
    Reversal Candles MT5
    Nguyen Thanh Cong
    5 (4)
    Introduction Reversal Candles is a cutting-edge non-repainting   forex indicator designed to predict price reversals with remarkable accuracy through a sophisticated combination of signals. Signal Buy when the last closed candle has a darker color (customizable) and an up arrow is painted below it Sell when the last closed candle has a darker color (customizable) and a down arrow is painted above it
    FREE
    Point Black
    Ignacio Agustin Mene Franco
    Black Card Pack indicator 5/1 point black It has the strategy of professional bollingers where each arrow gives you a different entry signal. It is used to operate in m1 and in d1 It is used for scalping and intraday, modified for forex markets ! suitable for all pairs modified for synthetic index markets suitable for all pairs! Ideal for volatility and jumps!
    Gino Renko
    Stephane, Andr Valette
    1 (1)
    Another renko-based indicator. It returns different usable values ​​for an EA, and is directly displayed on the main chart. Its setting is very simple: The size of the renko The number of bars taken into account The falling color The color on the rise Returned values: Buffer 0 : Value of the middle Buffer 1 : Value of the Top Buffer 2 : Value of the Bottom Buffer 3 : Direction of renko (0.0 for top ; 1.0 for bottom) Buffer 4 : Ratio of the renko, for example, if it is twice, 3 times, ro more of
    HMA Color with Alerts MT5
    Pavel Zamoshnikov
    4.74 (53)
    Hull Moving Average (HMA) is well-deservedly popular among traders because of the effective averaging of market noise and a relatively small delay. The current MetaTrader 5 version changes its color when the movement direction changes. Sound and text signals are available. It also supports sending email and push messages. It is possible to trigger a signal on the current incomplete bar, although such a signal may be canceled before completion if conditions are no longer appropriate. One of the p
    FREE
    The indicator identifies when a divergence occurs between price and an indicator or oscillator. It identifies both regular and hidden divergences. Combined with your own rules and techniques, this indicator will allow you to create (or enhance) your own powerful system. Features Can detect divergences for the following oscillators/indicators:   MACD, OsMA, Stochastics, RSI, CCI, RVI, Awesome, ADX, ATR, OBV, Composite index, MFI and Momentum. Only one oscillator/indicator can be selected. Draws
    FREE
    The indicator measures the frequency of incoming ticks to analyze the market activity. Bullish and bearish ticks are analyzed separately, informing about the currently predominant market sentiment. According to observations, an increase in the frequency of ticks (panic) indicates the beginning of strong price changes, and an increase in the frequency of ticks in a particular direction not only accompanies a price change in this direction, but also often anticipates it. The indicator is indispens
    FREE
    Bounce Zone MT5
    Nguyen Thanh Cong
    4.43 (7)
    Introduction The Bounce Zone indicator is a cutting-edge non-repainting technical tool built to identify key areas on the price chart where market sentiment is likely to cause a significant price reversal. Using advanced algorithms and historical price data analysis, this indicator pinpoints potential bounce zones. Combined with other entry signal, this indicator can help forex traders place the best trades possible Signal A possible buy signal is generated when price is in the green zone an
    FREE
    True Day
    Aurthur Musendame
    5 (1)
    True Days is a tool designed specifically for the trader who wants to catch intraday volatility in price charts.  True day makes it easier for the trader to avoid trading in the dead zone - a period in time where markets are considered dead or non volatile. The trader can concentrate on finding opportunities only during periods of profound market movements. By default the indicator gives you a true day starting at 02:00 to 19:00 hours GMT+2. You can adjust according to your Time Zone. By deafult
    FREE
    Free automatic Fibonacci is an indicator that automatically plots a Fibonacci retracement based on the number of bars you select on the BarsToScan setting in the indicator. The Fibonacci is automatically updated in real time as new highest and lowest values appears amongst the selected bars. You can select which level values to be displayed in the indicator settings. You can also select the color of the levels thus enabling the trader to be able to attach the indicator several times with differe
    FREE
    # Power Assisted Trend Following Indicator ## Overview The PowerIndicator is an implementation of the "Power Assisted Trend Following" methodology developed by Dr. Andreas A. Aigner and Walter Schrabmair. This indicator builds upon and improves J. Welles Wilder's trend following concepts by applying principles from signal analysis to financial markets. The core insight of this indicator is that successful trend following requires price movements to exceed a certain threshold (typically a mul
    FREE
    Santa Donchian
    Marco Aurelio Cestari
    4.5 (2)
    Santa Donchian Indicator  is an efficient way to detect support, resistence and break outs in any market. The Donchian channel measures the high and the low of a previously defined range.  Typically, a trader would look for a well-defined range and then wait for the price to break out to either one side for a trade entry trigger. Advantages Never repaints, never backpaints, never recalculates. Works in all symbols and all timeframes. Perfect trend filter for any strategy or expert advisor. Full
    FREE
    Forex Indicator Arrows
    Nguyen Nghiem Duy
    1 (1)
    Forex Indicator Arrows is an arrow Indicator used as an assistant tool for your trading strategy. The indicator analyzes the standard deviation of bar close for a given period and generates a buy or sell signals if the deviation increases. It good to combo with Martingale EA to follow Trend and Sellect Buy Only/Sell Only for EA work Semi-Automatic. You can use this  Indicator with any EAs in my Products.
    FREE
    이 제품의 구매자들이 또한 구매함
    Trend Screener Pro MT5
    STE S.S.COMPANY
    4.85 (82)
    트렌드 표시기, 트렌드 트레이딩 및 필터링을 위한 획기적인 고유 솔루션, 하나의 도구 안에 내장된 모든 중요한 트렌드 기능! Forex, 상품, 암호 화폐, 지수 및 주식과 같은 모든 기호/도구에 사용할 수 있는 100% 다시 칠하지 않는 다중 시간 프레임 및 다중 통화 표시기입니다. Trend Screener는 차트에 점이 있는 화살표 추세 신호를 제공하는 효율적인 지표 추세 추종 지표입니다. 추세 분석기 표시기에서 사용할 수 있는 기능: 1. 트렌드 스캐너. 2. 최대 이익 분석이 있는 추세선. 3. 추세 통화 강도 측정기. 4. 경고가 있는 추세 반전 점. 5. 경고가 있는 강력한 추세 점. 6. 추세 화살표 Trend Screener Indicator가 있는 일일 분석 예, 일일 신호 성능...등은 여기에서 찾을 수 있습니다. 여기를 클릭하십시오. LIMITED TIME OFFER : Trend Screener Indicator는 50$ 및 평생 동안만 사용할 수 있습니다.
    Divergence Bomber
    Ihor Otkydach
    5 (4)
    이 지표를 구매하신 분께는 다음과 같은 혜택이 무료로 제공됩니다: 각 거래를 자동으로 관리하고, 손절/익절 수준을 설정하며, 전략 규칙에 따라 거래를 종료하는 전용 도우미 툴 "Bomber Utility" 다양한 자산에 맞게 지표를 설정할 수 있는 셋업 파일(Set Files) "최소 위험", "균형 잡힌 위험", "관망 전략" 모드로 설정 가능한 Bomber Utility의 셋업 파일 이 전략을 빠르게 설치, 설정, 시작할 수 있도록 돕는 단계별 영상 매뉴얼 주의: 위의 모든 보너스를 받기 위해서는 MQL5 개인 메시지 시스템을 통해 판매자에게 연락해 주세요. 독창적인 커스텀 지표인 “Divergence Bomber(다이버전스 봄버)”를 소개합니다. 이 지표는 MACD 다이버전스(괴리) 전략을 기반으로 한 올인원(All-in-One) 거래 시스템입니다. 이 기술 지표의 주요 목적은 가격과 MACD 지표 간의 다이버전스를 감지하고, **향후 가격이 어느 방향으로 움직일지를 알려주는
    Golden Trend Indicator MT5
    Noha Mohamed Fathy Younes Badr
    4.89 (18)
    Golden Trend indicator  is The best indicator for predicting trend movement this indicator never lags and never repaints and never back paints    and give  arrow buy and sell    before the candle appear  and it will help you and  will make your trading decisions clearer its work on all currencies and  gold and crypto and all time frame This unique  indicator uses very secret algorithms to catch the  trends, so you can trade using this indicator and see the trend clear on charts  manual guide and
    Cycle Maestro MT5
    Stefano Frisetti
    NOTE: CYCLEMAESTRO is distributed only on this website, there are no other distributors. Demo version is for reference only and is not supported. Full versione is perfectly functional and it is supported. CYCLEMAESTRO , the first and only indicator of Cyclic Analysis, useful for giving signals of TRADING, BUY, SELL, STOP LOSS, ADDING. Created on the logic of   Serghei Istrati   and programmed by   Stefano Frisetti ;   CYCLEMAESTRO   is not an indicator like the others, the challenge was to inter
    Algo Pumping
    Ihor Otkydach
    5 (11)
    PUMPING STATION – 당신만을 위한 올인원(All-in-One) 전략 PUMPING STATION은 당신의 외환 거래를 더욱 흥미롭고 효과적으로 바꿔줄 혁신적인 인디케이터입니다. 단순한 보조 도구가 아니라, 강력한 알고리즘을 갖춘 완전한 거래 시스템으로서 보다 안정적인 트레이딩을 시작할 수 있도록 도와줍니다. 이 제품을 구매하시면 다음의 혜택을 무료로 받으실 수 있습니다: 전용 설정 파일: 자동 설정으로 최대의 퍼포먼스를 제공합니다. 단계별 동영상 가이드: PUMPING STATION 전략으로 거래하는 법을 배워보세요. Pumping Utility: PUMPING STATION과 함께 사용하도록 설계된 반자동 거래 봇으로, 거래를 더욱 쉽고 편리하게 만들어줍니다. ※ 구매 후 바로 저에게 메시지를 보내주세요. 추가 자료에 대한 접근 권한을 제공해드립니다. PUMPING STATION은 어떻게 작동하나요? 트렌드 컨트롤: 시장의 추세 방향을 즉시 파악합니다. 추세는 최고의
    MonetTrend
    Aliya Bolek
    MonetTrend — Премиум-индикатор для торговли по тренду (M30, H1, H4) MonetTrend — это мощный и визуально понятный трендовый индикатор, созданный для торговли на таймфреймах M30, H1 и H4. Он идеально подходит для работы с волатильными инструментами, такими как: • Золото (XAUUSD) • Криптовалюты (BTCUSD) • Валютные пары (EURUSD, USDJPY и др.) Ключевые особенности MonetTrend: • Автоматическое отображение Take Profit 1 (TP1) и Stop Loss (SL): После появления сигнала индикатор сразу показывает: • TP
    TPSproTREND PrO MT5
    Roman Podpora
    4.72 (18)
    VERSION MT4        —        ИНСТРУКЦИЯ RUS           —        INSTRUCTIONS  ENG 주요 기능: 렌더링 없이 정확한 입력 신호! 신호가 나타나면 관련성은 유지됩니다! 이는 신호를 제공한 후 변경하여 예금 자금 손실을 초래할 수 있는 다시 그리기 지표와의 중요한 차이점입니다. 이제 더 큰 확률과 정확도로 시장에 진입할 수 있습니다. 화살표가 나타난 후 목표에 도달(이익실현)하거나 반전 신호가 나타날 때까지 캔들을 색칠하는 기능도 있습니다. STOP LOSS / TAKE PROFIT 구역 표시 진입점 검색 시 시각적 명확성을 높이기 위해 시장 진입을 위한 최적 지점이 검색되는 BUY/SELL 영역을 초기에 표시하는 모듈을 만들었습니다. 정지 손실 수준 작업을 위한 추가 지능형 논리는 시간이 지남에 따라 크기를 줄이는 데 도움이 되므로 거래에 들어갈 때 초기 위험을 줄이는 데 도움이 됩니다(move sl). 더 높은 기간의 MIN
    RelicusRoad Pro MT5
    Relicus LLC
    4.79 (19)
    이제 $ 147 (몇 가지 업데이트 후 $ 499 증가) - 무제한 계정 (PCS 또는 MACS) RelicusRoad 사용 설명서 + 교육 비디오 + 비공개 Discord 그룹 액세스 + VIP 상태 시장을 보는 새로운 방법 RelicusRoad는 외환, 선물, 암호화폐, 주식 및 지수에 대한 세계에서 가장 강력한 거래 지표로서 거래자에게 수익성을 유지하는 데 필요한 모든 정보와 도구를 제공합니다. 우리는 초보자부터 고급까지 모든 거래자가 성공할 수 있도록 기술적 분석 및 거래 계획을 제공합니다. 미래 시장을 예측할 수 있는 충분한 정보를 제공하는 핵심 거래 지표입니다. 우리는 차트에서 말이 안 되는 여러 지표 대신 완전한 솔루션을 믿습니다. 타의 추종을 불허하는 매우 정확한 신호, 화살표 + 가격 조치 정보를 표시하는 올인원 표시기입니다. 강력한 AI를 기반으로 하는 RelicusRoad는 누락된 정보와 도구를 제공하여 교육하고 성공적인 트레이더인 트레이딩 전문가가 되도
    Support And Resistance Screener는 하나의 지표 안에 여러 도구를 제공하는 MetaTrader에 대한 하나의 레벨 지표입니다. 사용 가능한 도구는 다음과 같습니다. 1. 시장 구조 스크리너. 2. 완고한 후퇴 영역. 3. 약세 후퇴 영역. 4. 일일 피벗 포인트 5. 주간 피벗 포인트 6. 월간 피벗 포인트 7. 고조파 패턴과 볼륨에 기반한 강력한 지지와 저항. 8. 은행 수준 구역. LIMITED TIME OFFER : HV 지원 및 저항 표시기는 50 $ 및 평생 동안만 사용할 수 있습니다. ( 원래 가격 125$ ) MQL5 블로그에 액세스하면 분석 예제와 함께 모든 프리미엄 지표를 찾을 수 있습니다. 여기를 클릭하십시오. 주요 특징들 고조파 및 볼륨 알고리즘을 기반으로 하는 강력한 지원 및 저항 영역. Harmonic 및 Volume 알고리즘을 기반으로 한 강세 및 약세 풀백 영역. 시장 구조 스크리너 일간, 주간 및 월간 피벗 포인트. 실제 거래의
    Quantum TrendPulse
    Bogdan Ion Puscasu
    5 (13)
    SuperTrend   ,   RSI   ,   Stochastic   의 힘을 하나의 포괄적인 지표로 결합하여 트레이딩 잠재력을 극대화하는 궁극의 트레이딩 도구   인 Quantum TrendPulse를   소개합니다. 정밀성과 효율성을 추구하는 트레이더를 위해 설계된 이 지표는 시장 추세, 모멘텀 변화, 최적의 진입 및 종료 지점을 자신 있게 식별하는 데 도움이 됩니다. 주요 특징: SuperTrend 통합:   주요 시장 추세를 쉽게 따라가고 수익성의 물결을 타세요. RSI 정밀도:   매수 과다 및 매도 과다 수준을 감지하여 시장 반전 시점을 파악하는 데 적합하며 SuperTrend 필터로 사용 가능 확률적 정확도:   변동성이 큰 시장에서 숨겨진 기회를 찾기 위해 확률적 진동   을 활용하고 SuperTrend의 필터로 사용 다중 시간대 분석:   M5부터 H1 또는 H4까지 다양한 시간대에 걸쳐 시장을 최신 상태로 유지하세요. 맞춤형 알림:   맞춤형 거래 조건이 충족되면
    Gold Stuff mt5
    Vasiliy Strukov
    4.93 (178)
    Gold Stuff mt5는 금을 위해 특별히 설계된 추세 지표이며 모든 금융 상품에서도 사용할 수 있습니다. 표시기가 다시 그려지지 않고 지연되지 않습니다. 권장 기간 H1. 설정 및 개인 보너스를 받으려면 구매 후 즉시 저에게 연락하십시오!     강력한 지원 및 트렌드 스캐너 표시기의 무료 사본을 받으실 수 있습니다. 메시지를 보내주세요. 나!   설정 화살표 그리기 - 켜기 끄기. 차트에 화살표 그리기. 경고 - 가청 경고를 끕니다. 이메일 알림 - 켜기 끄기. 이메일 알림. Puch-notification - 켜기 끄기. 푸시 알림. 다음으로 색 영역을 조정합니다. Gold Stuff mt5는 금을 위해 특별히 설계된 추세 지표이며 모든 금융 상품에서도 사용할 수 있습니다. 표시기가 다시 그려지지 않고 지연되지 않습니다. 권장 기간 H1. 설정 및 개인 보너스를 받으려면 구매 후 즉시 저에게 연락하십시오!   설정 화살표 그리기 - 켜기 끄기. 차트에 화살표 그
    FX Power MT5 NG
    Daniel Stein
    5 (15)
    FX Power: 통화 강세 분석으로 더 스마트한 거래 결정을 개요 FX Power 는 어떤 시장 상황에서도 주요 통화와 금의 실제 강세를 이해하기 위한 필수 도구입니다. 강한 통화를 매수하고 약한 통화를 매도함으로써 FX Power 는 거래 결정을 단순화하고 높은 확률의 기회를 발견합니다. 트렌드를 따르거나 극단적인 델타 값을 사용해 반전을 예측하고자 한다면, 이 도구는 귀하의 거래 스타일에 완벽히 적응합니다. 단순히 거래하지 말고, FX Power 로 더 스마트하게 거래하세요. 1. FX Power가 거래자에게 매우 유용한 이유 통화와 금의 실시간 강세 분석 • FX Power 는 주요 통화와 금의 상대적 강세를 계산하고 표시하여 시장 역학에 대한 명확한 통찰력을 제공합니다. • 어떤 자산이 앞서고 있고 어떤 자산이 뒤처지는지 모니터링하여 보다 현명한 거래 결정을 내릴 수 있습니다. 포괄적인 멀티 타임프레임 뷰 • 단기, 중기 및 장기 타임프레임에서 통화와 금의 강세를
    TPSpro RFI Levels MT5
    Roman Podpora
    4.55 (20)
    주요 플레이어의 반전 구역 / 피크 볼륨 / 활성 구역 =       TS TPS프로시스템 지침 RUS       /       지침       영어       /           버전 MT4        이 지표를 구매한 모든 구매자는 또한 다음을 무료로 받습니다. RFI SIGNALS 서비스의 거래 신호에 6개월 동안 액세스할 수 있습니다. TPSproSYSTEM 알고리즘에 따른 즉시 사용 가능한 진입 포인트입니다. 정기적으로 업데이트되는 교육 자료 - 전략에 푹 빠져서 전문가 수준을 높여보세요. 주중 24/5 지원 및 비공개 트레이더 채팅 이용 - 시장 상황에 대한 소통, 지원 및 분석. 저자가 설정한 파일 - 별도의 노력 없이 최대 결과를 얻을 수 있도록 지표를 자동으로 설정합니다. 주요 기능: 판매자와 구매자의 활동 영역을 표시합니다! 이 지표는 매수 및 매도에 대한 모든 올바른 첫 번째 임펄스 레벨/존을 표시합니다. 진입점 검색이 시작되는 이러한 레벨/존이 활성화되면
    FX Levels MT5
    Daniel Stein
    5 (4)
    FX Levels: 모든 시장을 위한 뛰어난 정확도의 지지와 저항 간단 요약 통화쌍, 지수, 주식, 원자재 등 어떤 시장이든 믿을 만한 지지·저항 레벨을 찾고 싶나요? FX Levels 는 전통적인 “Lighthouse” 기법과 첨단 동적 접근을 결합해, 거의 보편적인 정확성을 제공합니다. 실제 브로커 경험을 반영하고, 자동화된 일별 업데이트와 실시간 업데이트를 결합함으로써 FX Levels 는 가격 반전 포인트를 파악하고, 수익 목표를 설정하며, 자신 있게 트레이드를 관리할 수 있게 돕습니다. 지금 바로 시도해 보세요—정교한 지지/저항 분석이 어떻게 여러분의 트레이딩을 한 단계 끌어올릴 수 있는지 직접 확인하세요! 1. FX Levels가 트레이더에게 매우 유용한 이유 뛰어난 정확도의 지지·저항 존 • FX Levels 는 다양한 브로커 환경에서도 거의 동일한 존을 생성하도록 설계되어, 데이터 피드나 시간 설정 차이로 인한 불일치를 해소합니다. • 즉, 어떤 브로커를 사용하
    MONEYTRON – ТВОЙ ЛИЧНЫЙ СИГНАЛ НА УСПЕХ! XAUUSD | AUDUSD | USDJPY | BTCUSD Поддержка таймфреймов: M5, M15, M30, H1 Почему трейдеры выбирают Moneytron? 82% успешных сделок — это не просто цифры, это результат продуманной логики, точного алгоритма и настоящей силы анализа. Автоматические сигналы на вход — не нужно гадать: когда покупать, когда продавать. 3 уровня Take Profit — ты сам выбираешь свой уровень прибыли: безопасный, уверенный или максимум. Четкий Stop Loss — контролируешь риск
    Atomic Analyst MT5
    Issam Kassas
    4.32 (19)
    우선적으로 언급할 점은이 거래 지표가 다시 그리지 않고 지연되지 않으며 이를 통해 수동 및 로봇 거래 모두에 이상적이라는 점입니다. 사용자 매뉴얼: 설정, 입력 및 전략. Atomic Analyst는 가격의 강도와 모멘텀을 활용하여 시장에서 더 나은 이점을 찾는 PA Price Action Indicator입니다. 고급 필터를 장착하여 잡음과 거짓 신호를 제거하고 거래 잠재력을 높이는 데 도움이 됩니다. 복잡한 지표의 다중 레이어를 사용하여 Atomic Analyst는 차트를 스캔하고 복잡한 수학적 계산을 간단한 신호와 색상으로 변환하여 초보 트레이더가 이해하고 일관된 거래 결정을 내릴 수 있도록합니다. "Atomic Analyst"는 새로운 및 경험이 풍부한 트레이더를위한 종합적인 거래 솔루션입니다. 프리미엄 지표와 최고 수준의 기능을 하나의 거래 전략에 결합하여 모든 종류의 트레이더에 대한 다재다능한 선택지가되었습니다. 인트라데이 거래 및 스캘핑 전략 : 빠르고 정확한 일일
    FX Volume MT5
    Daniel Stein
    4.82 (17)
    FX Volume: 브로커 시각에서 바라보는 진짜 시장 심리 간단 요약 트레이딩 접근 방식을 한층 더 향상시키고 싶으신가요? FX Volume 는 소매 트레이더와 브로커의 포지션을 실시간으로 파악할 수 있게 해 줍니다. 이는 COT 같은 지연된 보고서보다 훨씬 빠릅니다. 꾸준한 수익을 추구하는 분이든, 시장에서 더 깊은 우위를 원하시는 분이든, FX Volume 을 통해 대규모 불균형을 찾아내고, 돌파 여부를 확인하며 리스크 관리를 정교화할 수 있습니다. 지금 시작해 보세요! 실제 거래량 데이터가 의사결정을 어떻게 혁신할 수 있는지 직접 경험해 보시기 바랍니다. 1. 트레이더에게 FX Volume이 매우 유익한 이유 탁월한 정확도를 지닌 조기 경보 신호 • 다른 사람들보다 훨씬 앞서, 각 통화쌍을 매수·매도하는 트레이더 수를 거의 실시간으로 파악할 수 있습니다. • FX Volume 은 여러 리테일 브로커에서 추출한 실제 거래량 데이터를 종합해 명확하고 편리한 형태로 제공하는
    FourAverageMT5
    Mikhail Sergeev
    5 (2)
    포라 평균은 트렌드 탐지의 새로운 단어입니다. 정보 기술의 발전과 많은 참가자들로 인해 금융 시장은 구식 지표에 의한 분석에 덜 민감해지고 있습니다. 이동 평균이나 정작과 같은 기존의 기술적 분석 도구는 순수한 형태로 추세의 방향이나 역전 방향을 결정할 수 없습니다. 하나의 지표가 14 년의 역사를 기반으로 매개 변수를 변경하지 않고 미래 가격의 올바른 방향을 나타낼 수 있습니까? 동시에,옆으로 시장의 움직임과 적절성을 잃지 않는다? 답변:예,할 수 있습니다. 우리 팀은 변화하는 시장 상황에 적응하기 위해 상당히 강력하고 효과적인 메커니즘을 가진 지표를 개발했습니다. 2025 년에 선도적 인 추세 지표"평균"은 새로운 개발 단계에 진입하고 있습니다. 현대 암호 화폐 및 주식 시장은이 지표를 위해 만들어진 것 같습니다. 고유 한 스무딩 공식을 사용하면 통화 쌍 또는 기타 악기의 모든 기능에 대한 표시기를 조정(패턴 식별)할 수 있습니다. 지금,이익을 만들기 위해,하나의 지표는 충분하다
    *** Entry In The Zone and SMC Multi Timeframe 은 Smart Money Concept (SMC)을 기반으로 한 실시간 시장 분석 도구 입니다. 이 도구는 반전 신호 와 **다중 시간대 구조 감지(Multi-Timeframe Structure Detection)**를 통합하여 주요 반전 구역(POI)을 자동으로 식별합니다. 이를 통해 트레이더가 더 체계적이고 자신감 있게 거래 계획과 결정을 내릴 수 있도록 지원 합니다. 주요 기능: - 자동 시장 구조 감지 (BOS  CHoCH, mBOS  mCHoCH) - Order Blocks, 공급 & 수요 구역, Fair Value Gaps (FVG) 식별 - 유동성 구역, Premium  Discount 영역, Equal Highs  Equal  Lows - 주요 관심 구역 (POI) - 거래 세션 시간 분석 (도쿄, 런던, 뉴욕) - 사용자 맞춤 자동 -계산 및 하이라이팅대시보드 -  신호 재도색 없음!
    Matrix Arrow Indicator MT5
    Juvenille Emperor Limited
    5 (13)
    매트릭스 화살표 표시기 MT5 는 외환, 상품, 암호 화폐, 지수, 주식과 같은 모든 기호/도구에 사용할 수 있는 100% 다시 칠하지 않는 다중 기간 표시기를 따르는 고유한 10 in 1 추세입니다.  Matrix Arrow Indicator MT5 는 다음과 같은 최대 10개의 표준 지표에서 정보와 데이터를 수집하여 초기 단계에서 현재 추세를 결정합니다. 평균 방향 이동 지수(ADX) 상품 채널 지수(CCI) 클래식 하이켄 아시 캔들 이동 평균 이동 평균 수렴 발산(MACD) 상대 활력 지수(RVI) 상대 강도 지수(RSI) 포물선 SAR 스토캐스틱 오실레이터 윌리엄스의 백분율 범위 모든 지표가 유효한 매수 또는 매도 신호를 제공하면 강력한 상승/하락 추세를 나타내는 다음 캔들/막대가 시작될 때 해당 화살표가 차트에 인쇄됩니다. 사용자는 사용할 표시기를 선택하고 각 표시기의 매개변수를 개별적으로 조정할 수 있습니다. 매트릭스 화살표 표시기 MT5는 선택한 표시기에서만 정보를 수
    MetaForecast M5
    Vahidreza Heidar Gholami
    5 (3)
    MetaForecast는 가격 데이터의 조화를 기반으로 모든 시장의 미래를 예측하고 시각화합니다. 시장이 항상 예측 가능한 것은 아니지만 가격에 패턴이 있다면 MetaForecast는 가능한 정확하게 미래를 예측할 수 있습니다. 다른 유사한 제품과 비교했을 때, MetaForecast는 시장 동향을 분석하여 더 정확한 결과를 생성할 수 있습니다. 입력 매개변수 Past size (과거 크기) MetaForecast가 미래 예측을 생성하기 위한 모델을 만드는 데 사용하는 막대의 수를 지정합니다. 모델은 선택한 막대 위에 그려진 노란색 선으로 표시됩니다. Future size (미래 크기) 예측해야 할 미래 막대의 수를 지정합니다. 예측된 미래는 핑크색 선으로 표시되며 그 위에 파란색 회귀선이 그려집니다. Degree (차수) 이 입력은 MetaForecast가 시장에서 수행할 분석 수준을 결정합니다. Degree 설명  0 차수 0의 경우, "Past size" 입력에 모든 봉우리와
    CBT Quantum Maverick
    Arpit Sharma
    1 (1)
    CBT Quantum Maverick 고효율 바이너리 옵션 거래 시스템 CBT Quantum Maverick는 정밀하고 간단하며 체계적인 거래를 원하는 트레이더를 위해 설계된 고성능 바이너리 옵션 거래 시스템입니다. 사용자 지정이 필요 없으며, 처음부터 최적화된 결과를 제공합니다. 약간의 연습만으로 신호를 쉽게 마스터할 수 있습니다. 주요 특징: 정확한 신호 제공: 현재 봉 데이터를 기반으로 다음 캔들에 대한 신호를 생성하며, 빈번한 재도색이 없습니다. 다양한 시장에 대한 적응성: 바이너리 옵션 거래에 특화되었으며, 여러 브로커 및 자산 클래스와 호환됩니다. 호환 가능: Deriv Synthetic Charts: 모든 시간 프레임에서 사용 가능. OTC 차트: Quotex, PocketOption, Binomo, Stockity, IQOption, Exnova, OlympTrade, Deriv, Binolla, Homebroker 등의 브로커와 호환(MT5로의 무료 데이터 임
    Advanced Currency Strength28 MT5
    Bernhard Schweigert
    5 (2)
    초보자 또는 전문가 트레이더를 위한 최고의 솔루션! 이 지표는 우리가 독점 기능과 새로운 공식을 통합했기 때문에 독특하고 고품질이며 저렴한 거래 도구입니다. 단 하나의 차트로 28 Forex 쌍의 통화 강도를 읽을 수 있습니다! 새로운 추세 또는 스캘핑 기회의 정확한 트리거 포인트를 정확히 찾아낼 수 있기 때문에 거래가 어떻게 개선될지 상상해 보십시오. 사용 설명서: 여기를 클릭  https://www.mql5.com/en/blogs/post/697384 그것이 첫 번째, 원본입니다! 쓸모없는 지망생 클론을 사지 마십시오. 더 스페셜  강력한 통화 모멘텀을 보여주는 하위 창의 화살표 GAP가 거래를 안내합니다! 기본 또는 호가 통화가 과매도/과매도 영역(외부 시장 피보나치 수준)에 있을 때 개별 차트의 기본 창에 경고 표시가 나타납니다. 통화 강도가 외부 범위에서 떨어질 때 풀백/반전 경고. 교차 패턴의 특별 경고 추세를 빠르게 볼 수 있는 다중 시간 프레임 선택이 가능합
    Gold Trend 5
    Sergei Linskii
    3.5 (2)
    금 추세 - 좋은 주식 기술 지표입니다. 인디케이터 알고리즘은 자산의 가격 움직임을 분석하고 변동성과 잠재적 진입 구간을 반영합니다. 최고의 지표 신호: - 매도 = 빨간색 히스토그램 + 빨간색 숏 포인터 + 같은 방향의 노란색 신호 화살표. - 매수 = 파란색 히스토그램 + 파란색 롱 포인터 + 같은 방향의 아쿠아 신호 화살표. 인디케이터의 장점 1. 표시기는 높은 정확도로 신호를 생성합니다. 2. 확인된 화살표 신호는 추세가 바뀔 때만 다시 그릴 수 있습니다. 3. 모든 브로커의 메타트레이더 5 거래 플랫폼에서 거래할 수 있습니다. 4. 모든 자산(통화, 금속, 암호화폐, 주식, 지수 등)을 거래할 수 있습니다. 5. H1 차트주기(중기 트레이딩)에서 거래하는 것이 좋습니다. 6. 지표 설정에서 개별 매개 변수(TF, 색상 등)를 변경할 수 있으므로 각 트레이더가 지표를 쉽게 사용자 지정할 수 있습니다. 7. 이 보조지표는 독립적인 트레이딩 시스템뿐만 아니라 트레이딩
    Auto Order Block with break of structure based on ICT and Smart Money Concepts (SMC) Futures Break of Structure ( BoS )             Order block ( OB )            Higher time frame Order block / Point of Interest ( POI )    shown on current chart           Fair value Gap ( FVG ) / Imbalance   -  MTF      ( Multi Time Frame )    HH/LL/HL/LH  -  MTF      ( Multi Time Frame )  Choch  MTF      ( Multi Time Frame )  Volume Imbalance     ,  MTF          vIMB Gap’s Power of 3 Equal High / Low’s  
    Basic Harmonic Patterns Dashboard MT5
    Mehran Sepah Mansoor
    4.22 (9)
    이 대시보드는 선택한 심볼에 대해 사용 가능한 최신 고조파 패턴을 표시하므로 시간을 절약하고 더 효율적으로 사용할 수 있습니다 /   MT4 버전 . 무료 인디케이터:   Basic Harmonic Pattern 인디케이터 열 Symbol :   선택한 심볼이 나타납니다 Trend :   강세 또는 약세 Pattern :   패턴 유형(가틀리, 나비, 박쥐, 게, 상어, 사이퍼 또는 ABCD) Entry :   진입 가격 SL:   스톱로스 가격 TP1:   1차 테이크프로핏 가격 TP2:   2차 테이크프로핏 가격 TP3:   3차 테이크프로핏 가격 Current price:   현재 가격 Age (in bars):   마지막으로 그려진 패턴의 나이 주요 입력 Symbols :   "28개 주요 통화쌍" 또는 "선택한 심볼" 중에서 선택합니다. Selected Symbols :   쉼표로 구분하여 모니터링하려는 원하는 심볼("EURUSD,GBPUSD,XAUUSD")을 선택
    Black Dragon indicator mt5
    Ramil Minniakhmetov
    4.84 (61)
    추세 감지 표시기는 모든 전략을 보완하며 독립적인 도구로도 사용할 수 있습니다.   장점 사용하기 쉽고 불필요한 정보로 차트에 과부하가 걸리지 않습니다. 모든 전략에 대한 필터로 사용할 수 있습니다. 기본 제공 수준의 동적 지원 및 저항이 있어 이익을 얻고 손절매를 설정하는 데 모두 사용할 수 있습니다. 촛대가 닫힌 후에도 표시기는 색상을 변경하지 않습니다.  주식 시장, 지수, 석유, 금 및 모든 시간대에서 작동합니다. 토스트 알림, 이메일 알림, 푸시 알림 및 소리 알림 기능이 있습니다. 내 다른 개발은 여기에서 찾을 수 있습니다:   https://www.mql5.com/ko/users/mechanic/seller 입력 매개변수 Alert - 켜기/끄기. 알리다; Push Notification - 켜기/끄기. 푸시 알림; Mail - 켜기/끄기 이메일 알림; Fibo 1,2,3,4,5,6,7,11,21,31,41,51,61,71 - 동적 지원 및 저항 수준 설정.
    우선적으로, 이 거래 도구는 전문적인 거래에 이상적인 비-다시 그리기 및 지연되지 않는 지표입니다.  온라인 강좌, 사용자 매뉴얼 및 데모. 스마트 가격 액션 컨셉트 인디케이터는 신규 및 경험 많은 트레이더 모두에게 매우 강력한 도구입니다. Inner Circle Trader Analysis 및 Smart Money Concepts Trading Strategies와 같은 고급 거래 아이디어를 결합하여 20가지 이상의 유용한 지표를 하나로 결합합니다. 이 인디케이터는 스마트 머니 컨셉트에 중점을 두어 대형 기관의 거래 방식을 제공하고 이동을 예측하는 데 도움을 줍니다.  특히 유동성 분석에 뛰어나 기관이 어떻게 거래하는지 이해하는 데 도움을 줍니다. 시장 트렌드를 예측하고 가격 변동을 신중하게 분석하는 데 탁월합니다. 귀하의 거래를 기관 전략에 맞추어 시장의 동향에 대해 더 정확한 예측을 할 수 있습니다. 이 인디케이터는 시장 구조를 분석하고 중요한 주문 블록을 식별하고 다양
    MetaBands M5
    Vahidreza Heidar Gholami
    4.5 (2)
    MetaBands uses powerful and unique algorithms to draw channels and detect trends so that it can provide traders with potential points for entering and exiting trades. It’s a channel indicator plus a powerful trend indicator. It includes different types of channels which can be merged to create new channels simply by using the input parameters. MetaBands uses all types of alerts to notify users about market events. Features Supports most of the channel algorithms Powerful trend detection algorith
    소개       Quantum Breakout PRO   , 브레이크아웃 존 거래 방식을 변화시키는 획기적인 MQL5 지표! 13년 이상의 거래 경험을 가진 숙련된 트레이더 팀이 개발한       퀀텀 브레이크아웃 PRO       혁신적이고 역동적인 브레이크아웃 존 전략으로 거래 여정을 새로운 차원으로 끌어올리도록 설계되었습니다. Quantum Breakout Indicator는 5개의 이익 목표 영역이 있는 브레이크아웃 영역의 신호 화살표와 브레이크아웃 상자를 기반으로 한 손절 제안을 제공합니다. 초보자 거래자와 전문 거래자 모두에게 적합합니다. Quantum EA 채널:       여기를 클릭하세요 중요한! 구매 후 설치 매뉴얼을 받으려면 개인 메시지를 보내주십시오. 추천: 기간: M15 통화쌍: GBPJPY, EURJPY, USDJPY,NZDUSD, XAUUSD 계정 유형: 스프레드가 매우 낮은 ECN, Raw 또는 Razor 브로커 시간: GMT +3 중개인 :
    제작자의 제품 더 보기
    TickConverter
    Katsura Yamanouchi
    This script makes ticks history data for an offline chart. You can set a tick volume for a bar. This script is also measuring bar creation speed. Inputs Number of ticks within a bar Maximum bars to convert Enable ignoring spread Omit high and low value in history bars Omit digits for display adjust Enable display 1 pip-unit bar Number of bars to average their speed Enable Bar-speed label Color of speed label Refresh rate of offline chart (Millseconds) Usage Set input parameters. Attach this sc
    FREE
    필터:
    리뷰 없음
    리뷰 답변
    버전 1.5 2024.12.20
    update history data display
    버전 1.3 2024.12.17
    Bug fix
    버전 1.2 2024.12.17
    Add bar and tick information display