NTickChart
- Indicatori
- Katsura Yamanouchi
- Versione: 1.5
- Aggiornato: 20 dicembre 2024
NtickChart-BVcandle
Features
This is a free version with limited functionality.
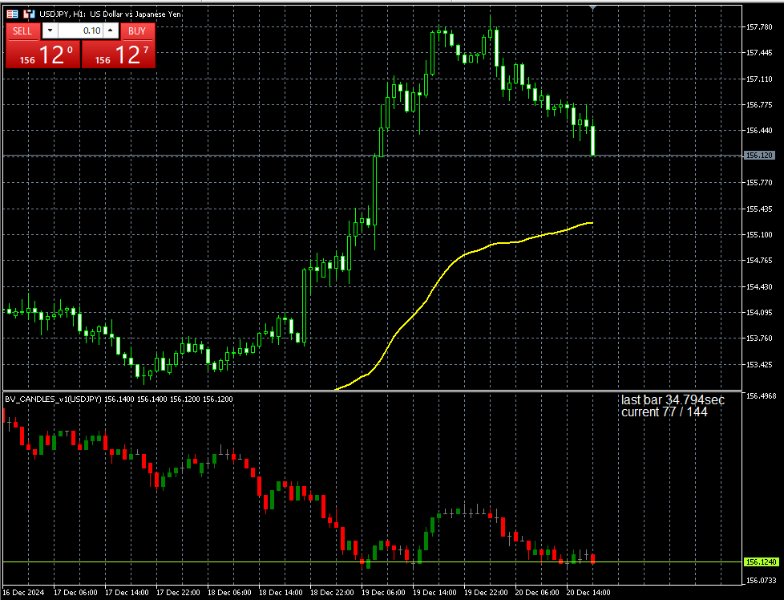
This is a tick chart indicator that displays in a sub-window.
Inspired by Bob Volman's (BV) scalping method, it is designed as a tool for achieving simple and effective trading. It is a tick chart specifically for day trading and scalping, focusing even on 1 pipette changes. Instead of time-based candle bars, it generates candle bars for a specified number of ticks (ticks_in_candle). This allows for a more detailed observation of short-term price fluctuations.
This indicator is particularly suitable for scalping in highly liquid currency pairs like EUR/USD, in environments with low spreads.
- Capture sudden market movements and aim for short-term profits.
- Quickly identify trend reversals and breakout points.
- Trade with a simple chart structure, avoiding distractions from unnecessary information.
Available Features:
- Tick count can be adjusted. BV recommends 70, but in today's high-volume trading environment, I recommend 144.
- The current price line can display Bid, Ask, or Mid (the midpoint between Ask and Bid) prices individually.
- Candlestick price values can be displayed in raw form (Nop) or rounded using one of the following methods: Round, Up, or Down.
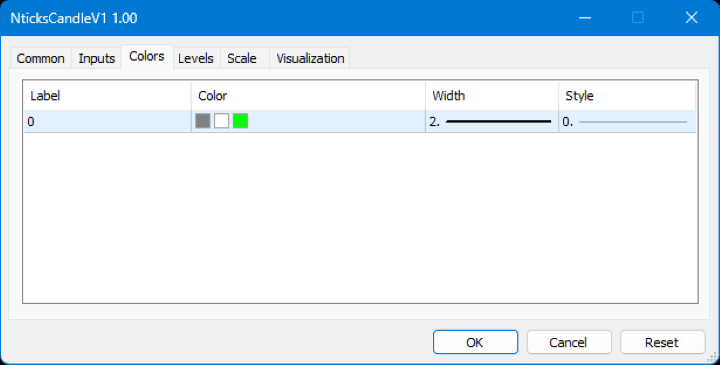
- Colors can be customized.
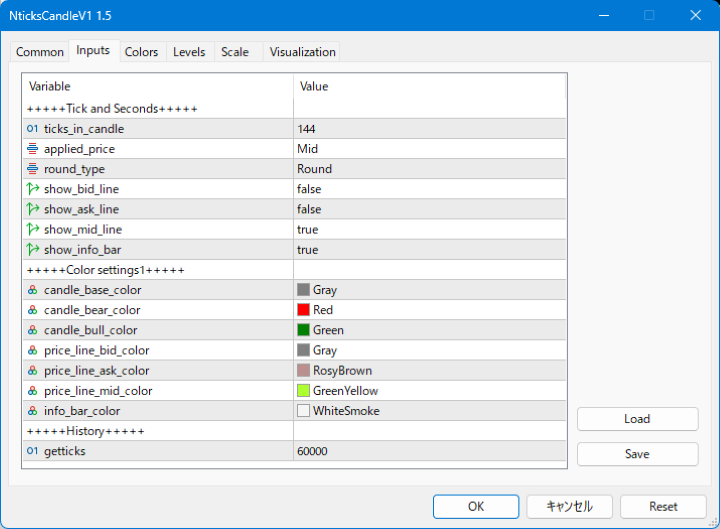
Default Settings
//--- input parameters
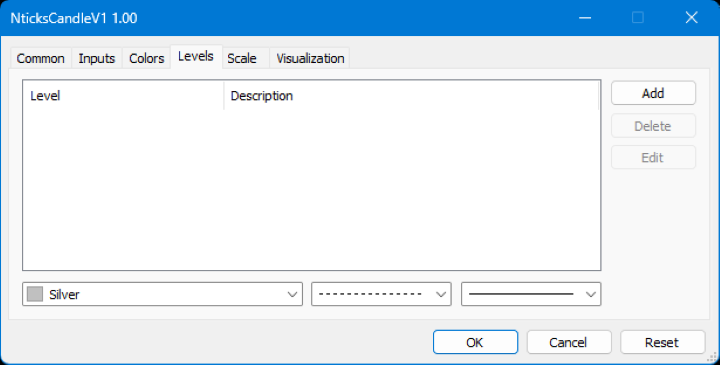
input group "+++++Tick and Seconds+++++";
input uint ticks_in_candle = 144; // Number of ticks per bar
input Eprice_types applied_price = Mid; // Price display type
input Eround_types round_type = Round; // Rounding display
input bool show_bid_line = false;
input bool show_ask_line = false;
input bool show_mid_line = true;
input group "+++++Color settings1+++++";
input color candle_base_color = clrGray;
input color candle_bear_color = clrRed;
input color candle_bull_color = clrGreen;
input color price_line_bid_color = clrGray;
input color price_line_ask_color = clrRosyBrown;
input color price_line_mid_color = clrGreenYellow;
Usage Notes (Limitations)
This indicator does not save buffer values to a file.
Other indicators cannot be overlaid on this tick chart.
How to Use
- Set the input parameters to your preferred values. The default settings are the creator's recommended configuration.
- Attach the indicator to the desired chart. There are no restrictions on currency pairs or timeframes (it is recommended to use it on timeframes below 5 minutes).
- Use it to assist in discretionary trading based on Bob Volman's method.
