• 미리보기
  • 리뷰
  • 코멘트

Hit Rate Top Bottom Signal

히트율 탑 바텀 신호

히트율 탑 바텀 신호

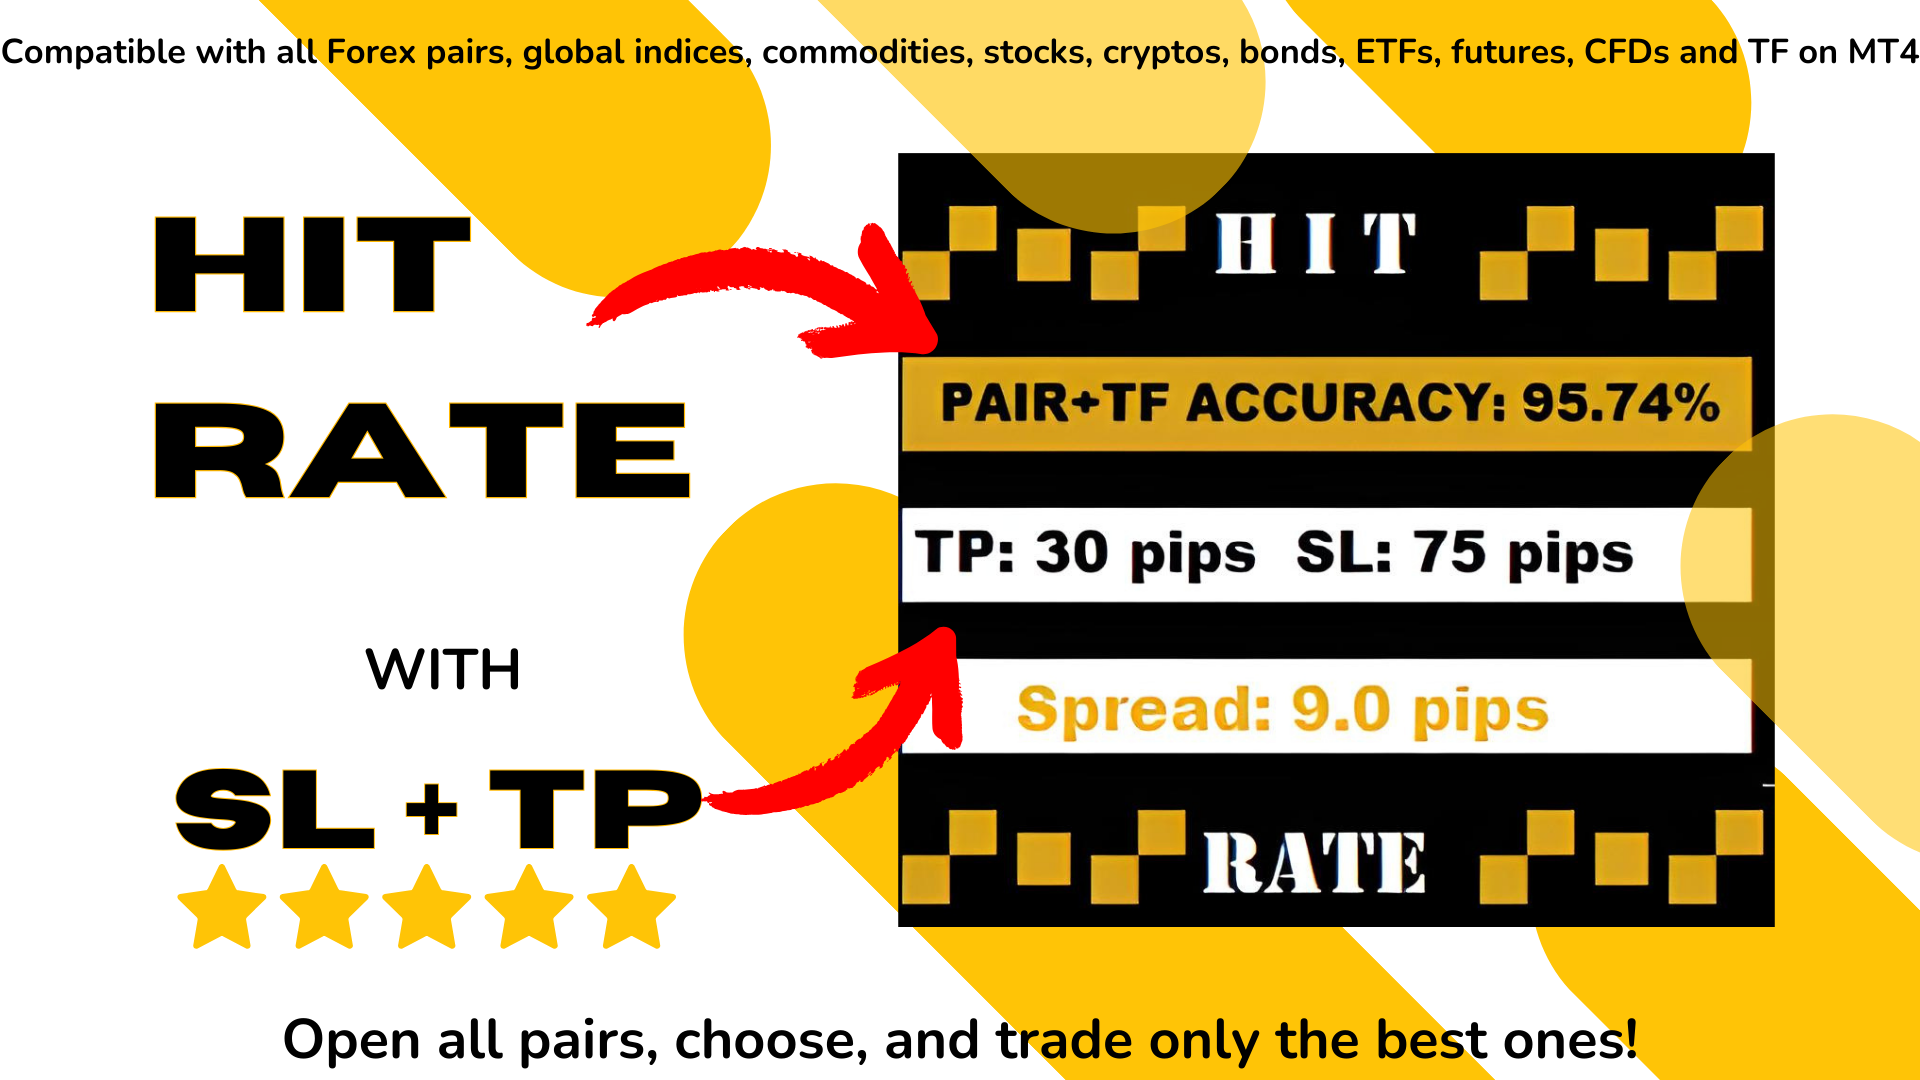
히트율 탑 바텀 신호는 완전히 혁신적인 접근 방식을 제공합니다. 특정 TP-SL과 PAIR/TF에서 어떤 성과를 내는지 미리 평가하고자 하는 분들께 이상적입니다.
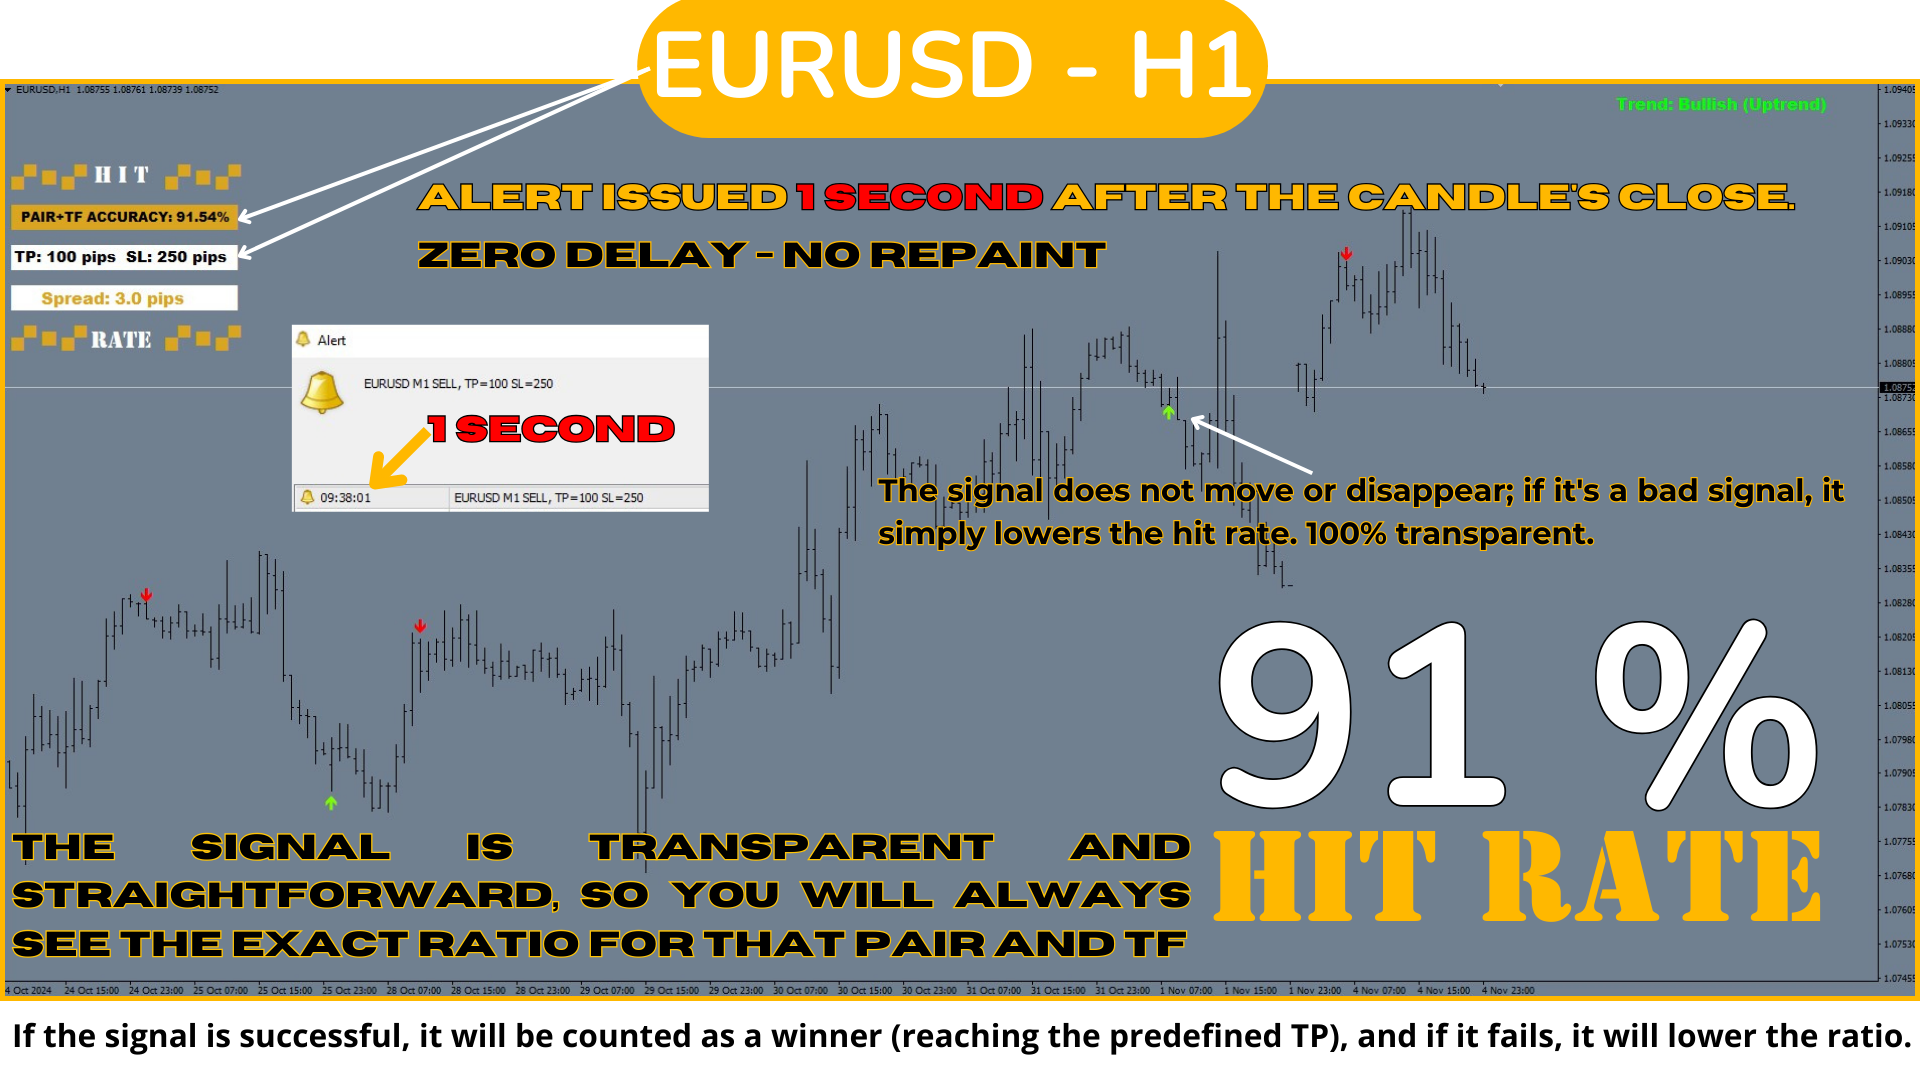
전략 히트율 탑 바텀 신호모든 트레이더와 모든 거래 유형에게 필수적인 도구입니다. 이 전략은 정확한 리페인트 없는 신호를 제공하여 언제 어떤 방향으로 거래해야 할지를 명확하게 제시할 뿐만 아니라 각 페어와 TF에 대한 상세한 성공률 기록을 제공합니다. 사전 정의된 테이크 프로핏(TP)과 스톱 로스(SL)을 통해 신호의 효율성을 미리 알 수 있습니다, 이는 효과적인 리스크 관리와 정확한 거래에 매우 중요합니다.

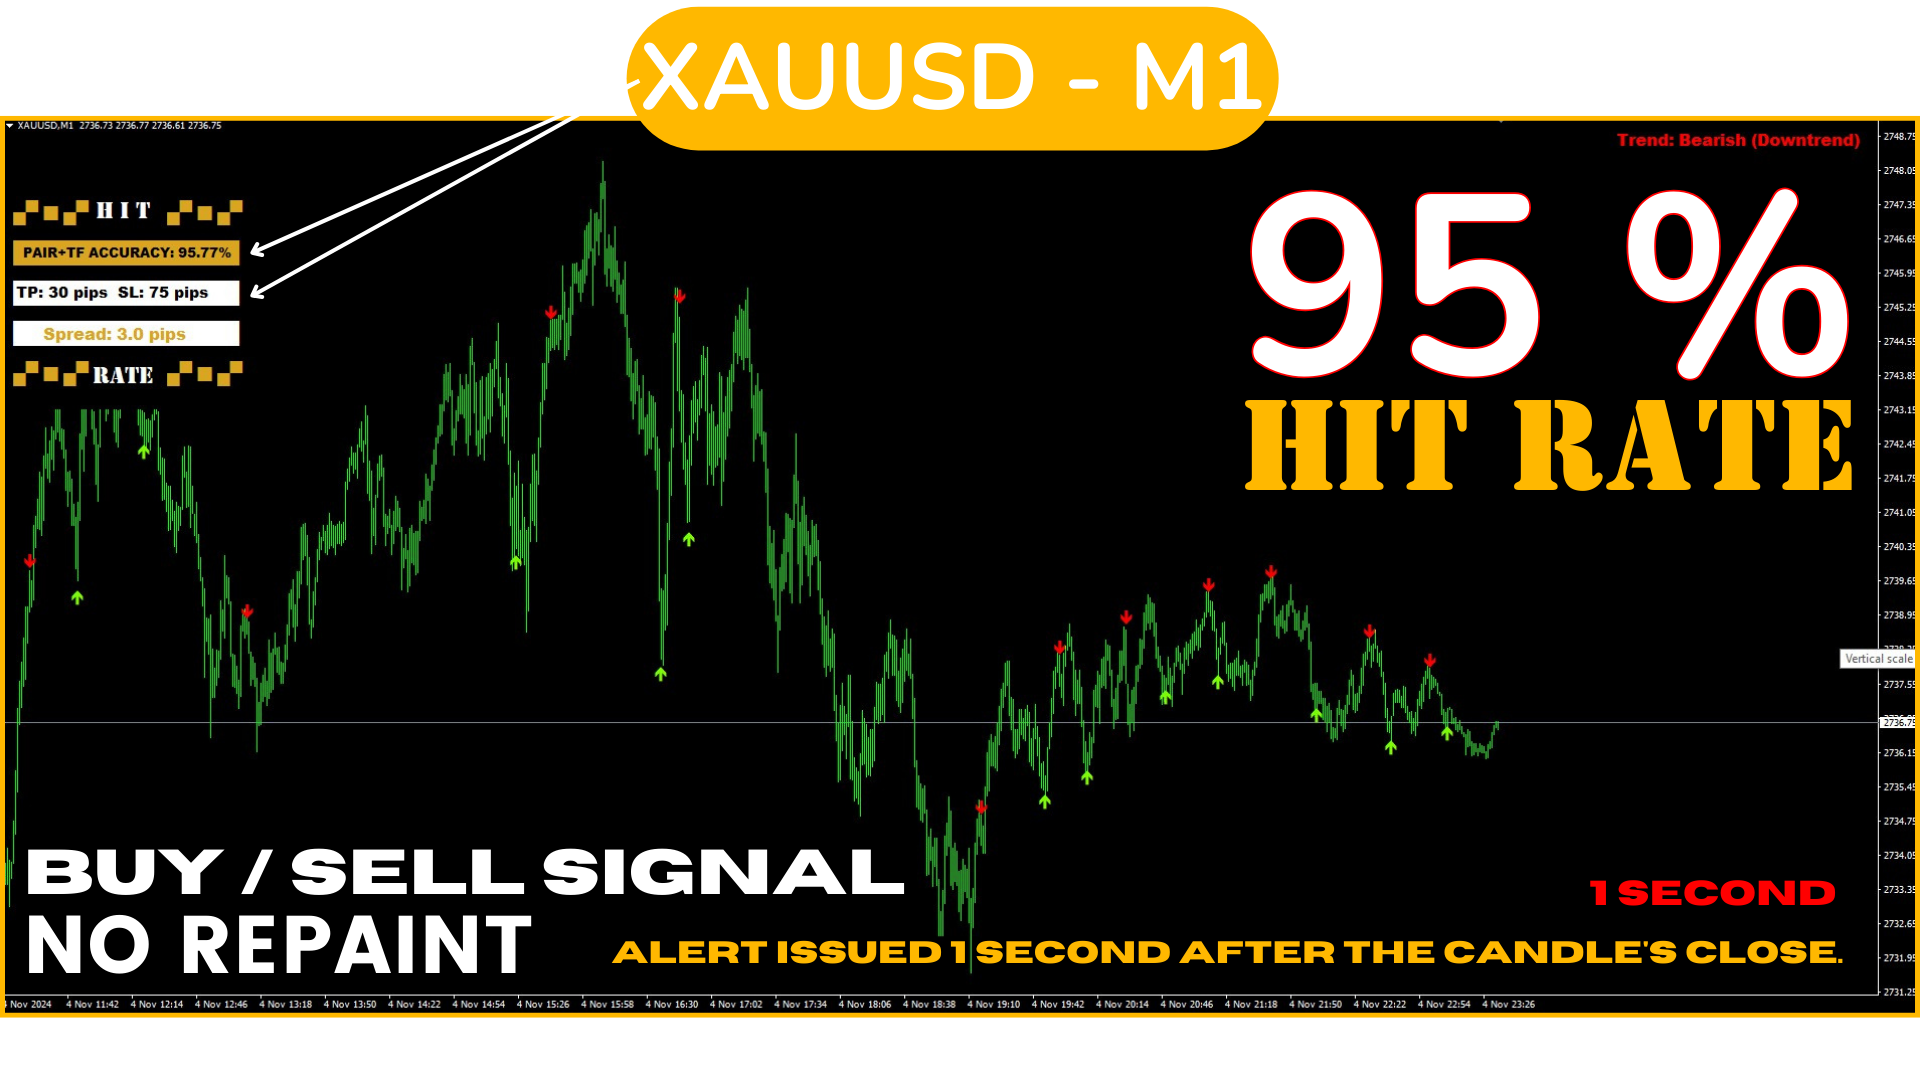
이 전략의 특징은 전체 움직임이 아닌 임펄스 내의 반전 지점을 감지하는 데 중점을 두고 있어 전통적인 탑-바텀보다 신호 발생 빈도가 높고,
시장의 주요 변동에서 핵심 순간을 포착하는 데 집중합니다.


이 전략은 SL/TP 비율과 결합된 신호의 과거 성과를 백분율로 표시하는 능력을 통해, 데이터를 기반으로 결정을 내릴 수 있게 하여 안전한 거래를 위한 최고의 선택으로 만듭니다. 명확하고 직관적인 신호를 사용하고 있으며, 신뢰할 수 있는 역사를 가지고 있는 신호를 통해 최고 수준의 전략을 사용하게 됩니다.


이 시스템으로 거래하는 방법?

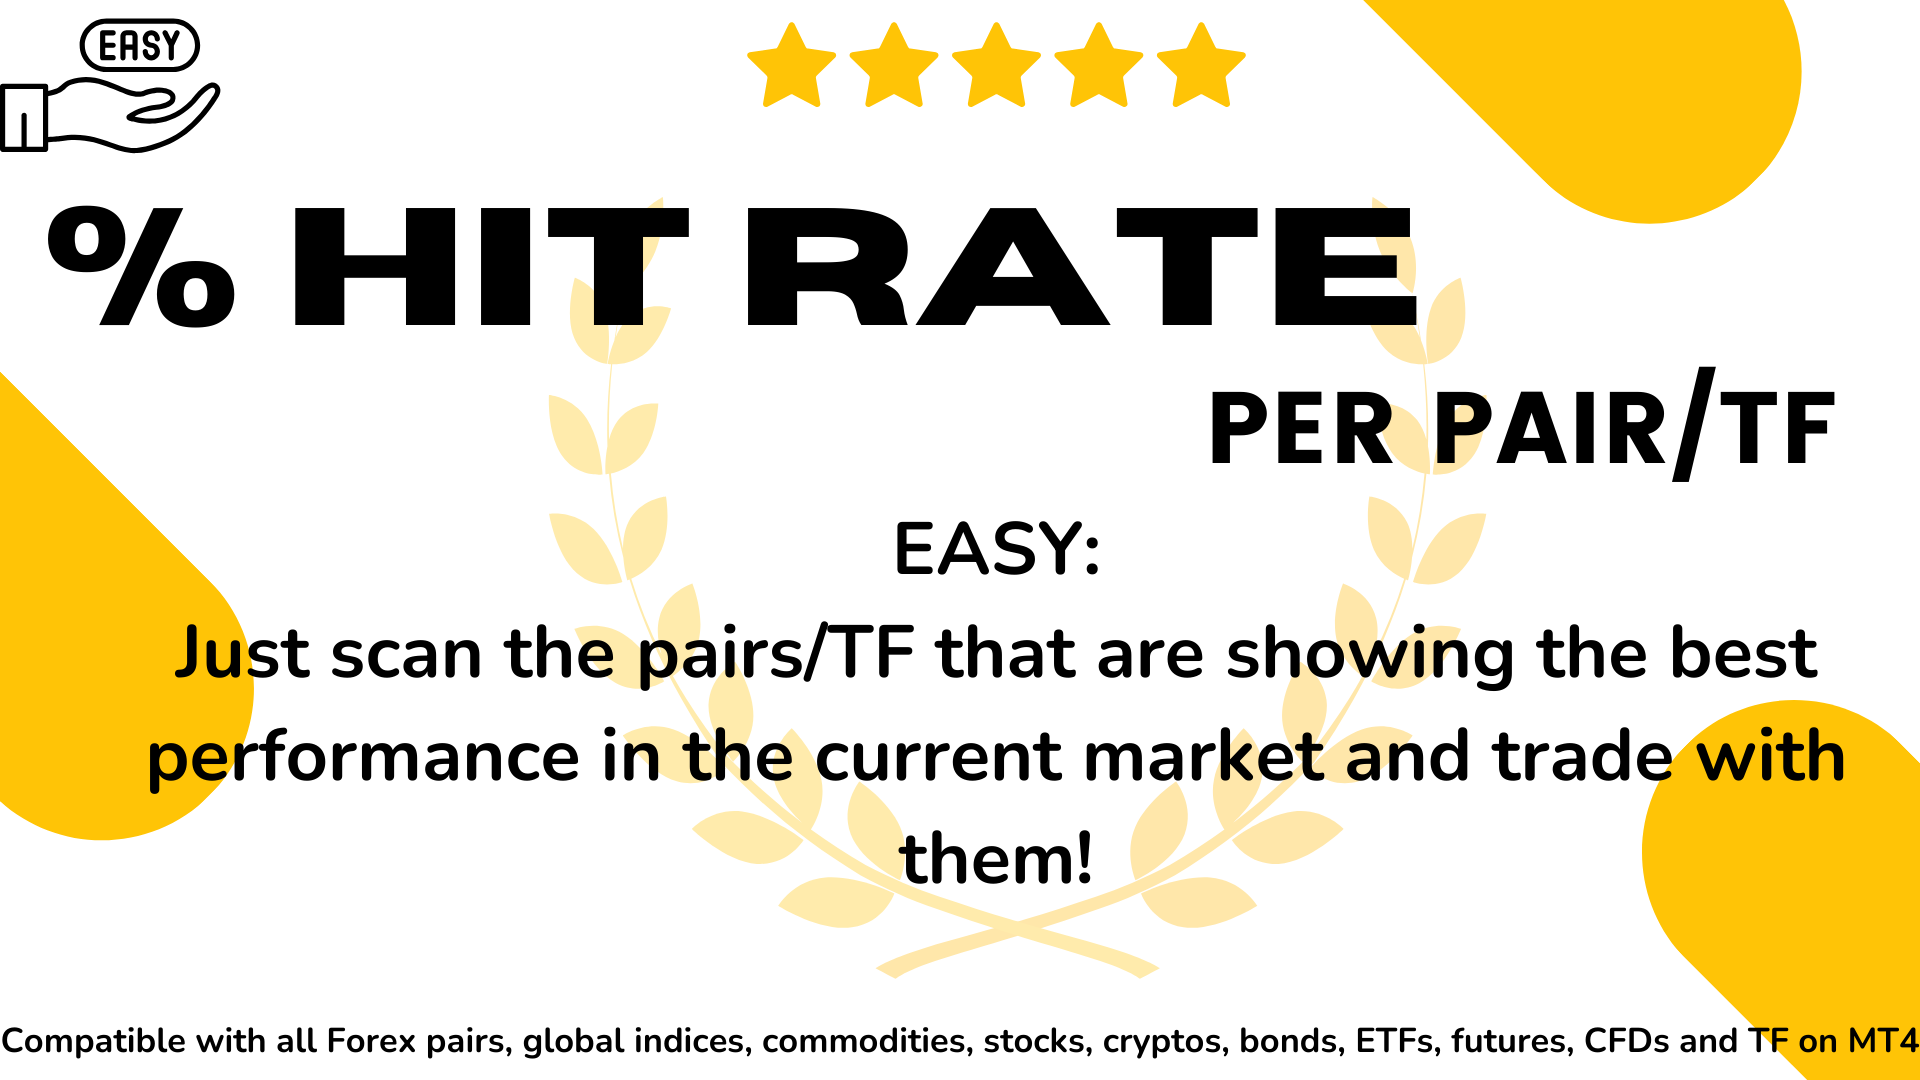
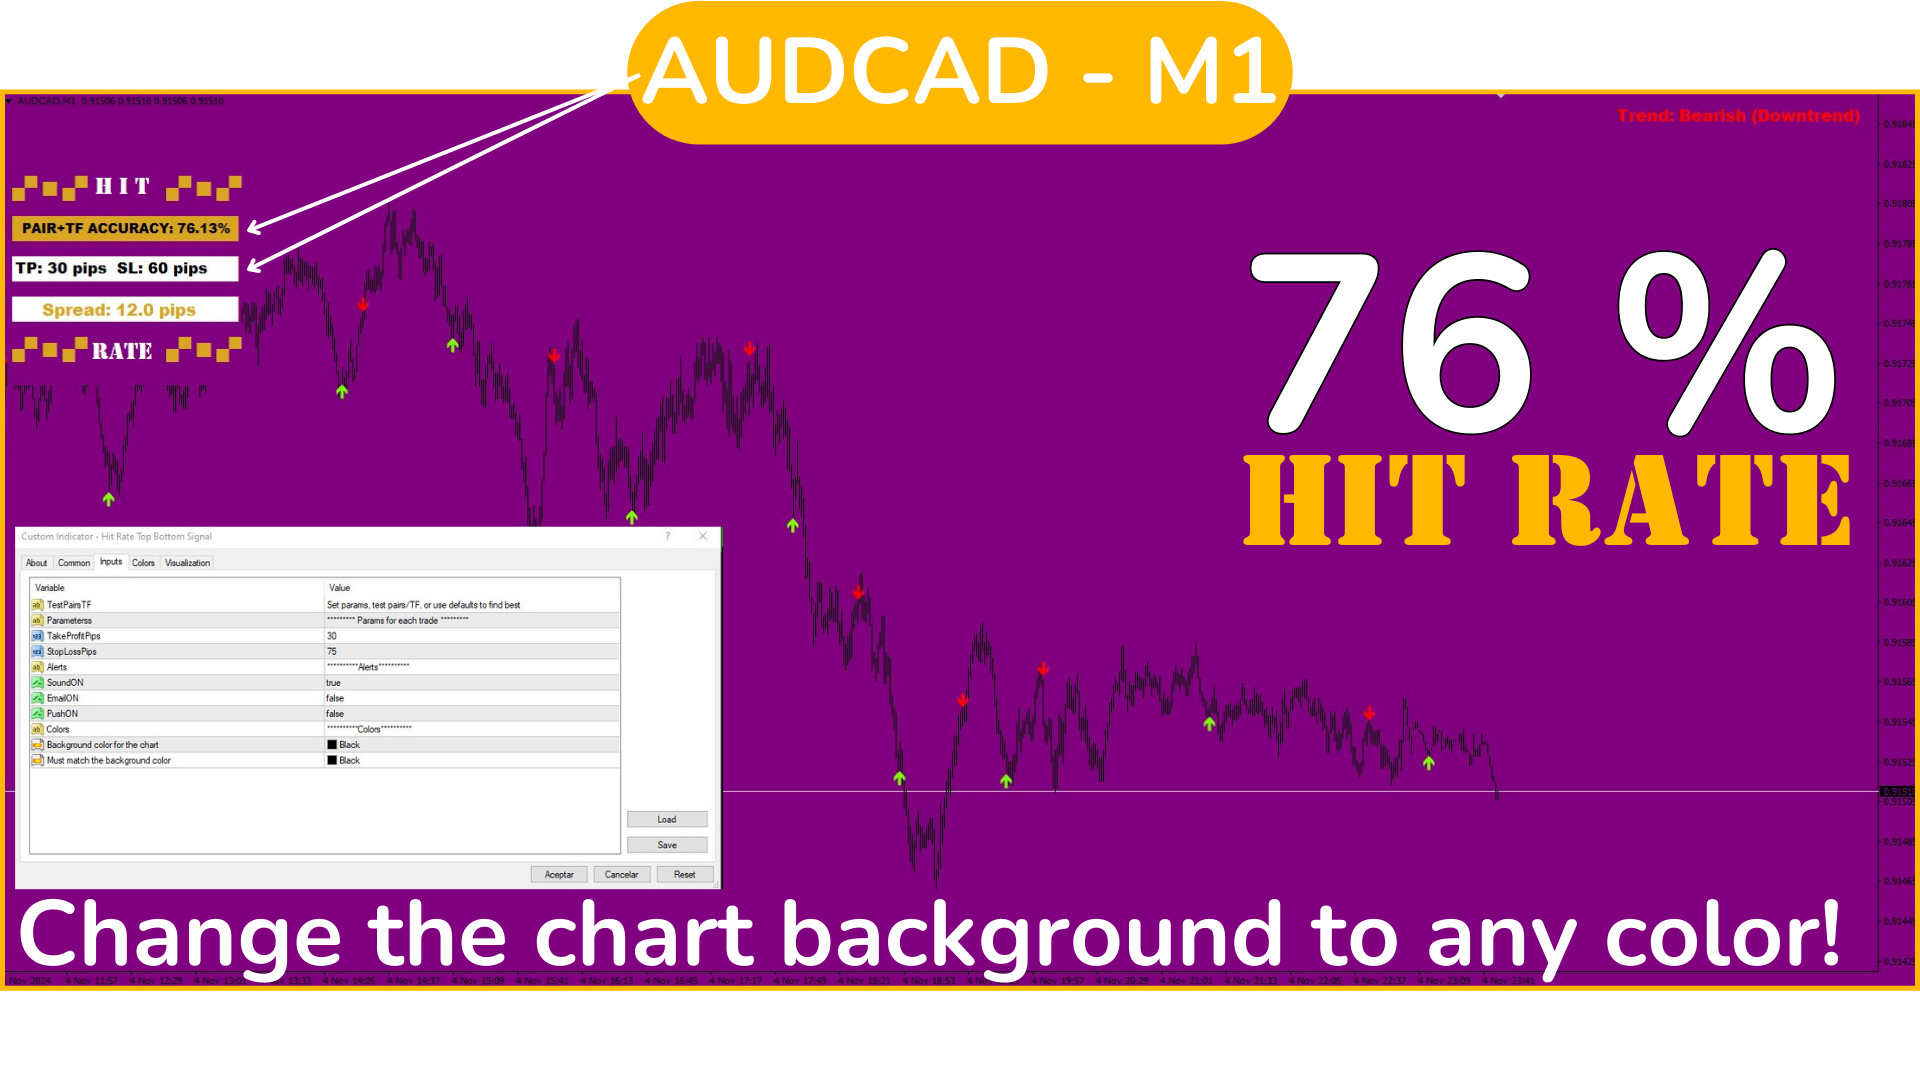
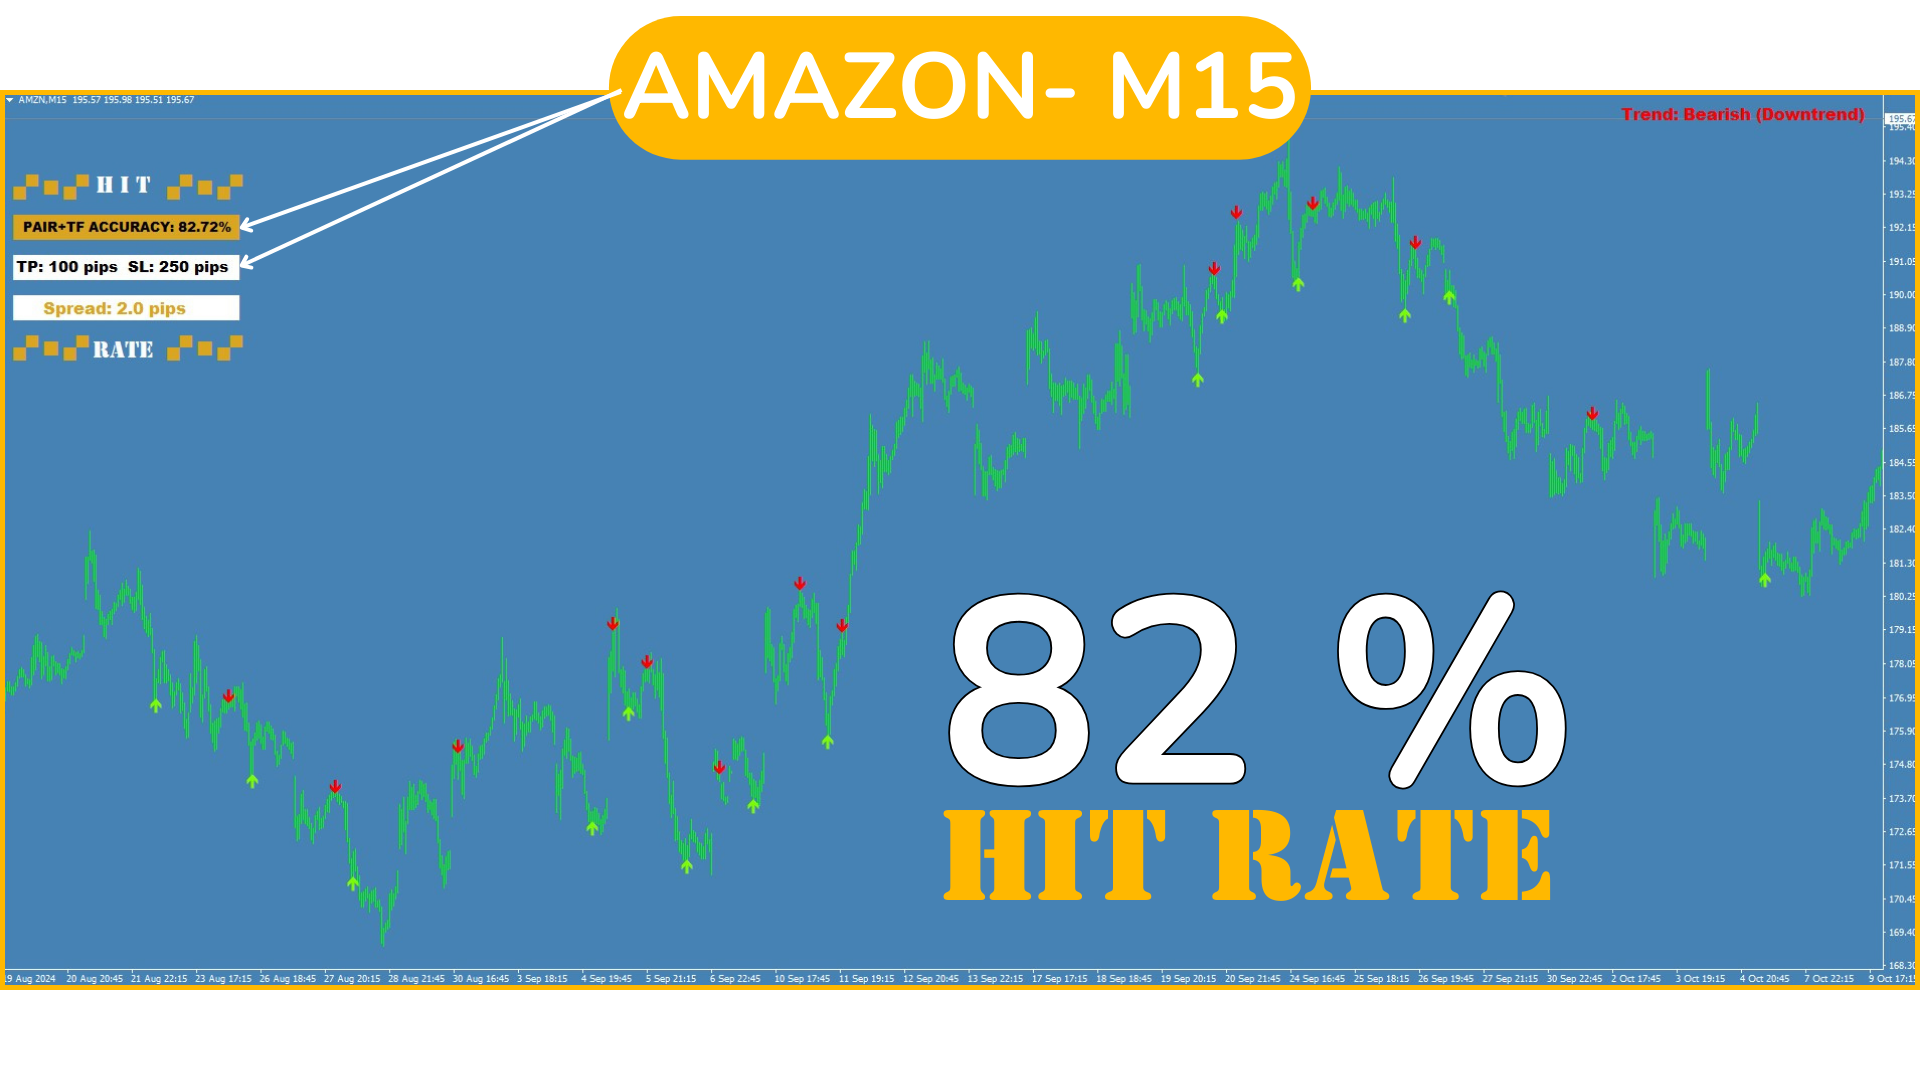
여러 페어를 열고 각 페어에 지표를 로드하세요. 이제 각 페어를 분석하여 신호가 가장 잘 작동하는 페어와 TF(시간대)를 식별한 후 집중하십시오. (이미지 보기)

기본적으로 신호는 TP 100핍과 SL 250핍으로 설정되어 있지만, 원하시는 값을 설정하거나 기본값을 그대로 사용할 수 있습니다.

H1에서의 SL 250핍과 M1에서의 SL 250핍은 동일하지 않다는 점에 유의하십시오. 그러나 걱정하지 마세요. SL 및 TP 매개변수를 수동으로 업데이트하면 새 매개변수에 대한 신호의 성공률이 재계산되어 해당 매개변수로 예상되는 결과를 미리 확인할 수 있습니다.

이렇게 각 페어의 특정 매개변수를 조정하여 해당 페어와 TF에 맞춰 전략을 "최적화"하고 해당 상황에서 신호의 성공률을 확인할 수 있습니다. 이 과정은 매일, 항상 거래를 시작하기 전에 수행하여 현재 시점에서 가장 효과적인 페어/TF를 식별하는 것이 좋습니다. 기본 매개변수는 M30 또는 H1과 같은 TF에서 가장 잘 작동하며, 이는 페어에 따라 다릅니다.

단계별 안내:

  1. 페어를 선택하고 각 TF를 확인하십시오. 예를 들어, 기본 TP 및 SL 설정을 사용하는 경우 성공률이 85-90% 이상인 TF를 확인합니다. 해당 TF를 선택하십시오. 기본 TP와 SL을 사용하지 않는 경우, 전략에 가장 적합한 비율을 이해하려면 아래의 "SL/TP와 성공률 비율"을 참조하세요.

  2. 이 절차를 사용 가능한 모든 페어에 반복하십시오. 열려 있는 페어가 많을수록 거래 기회가 더 많아집니다.

  3. 이제 신호를 기다리고, 신호가 발생하면 바로 거래를 시작하세요. 사전 설정된 SL과 TP를 따릅니다.

  4. 원하는 TP 및 SL을 선택하려면 "입력" 탭에서 데이터를 변경하고 각 페어의 값을 핍으로 설정해야 합니다. 그런 다음 해당 페어의 각 TF를 확인하고 가장 잘 작동하는 것을 선택하여 신호를 주의 깊게 확인하세요.

자유롭게 휴대전화로 거래:

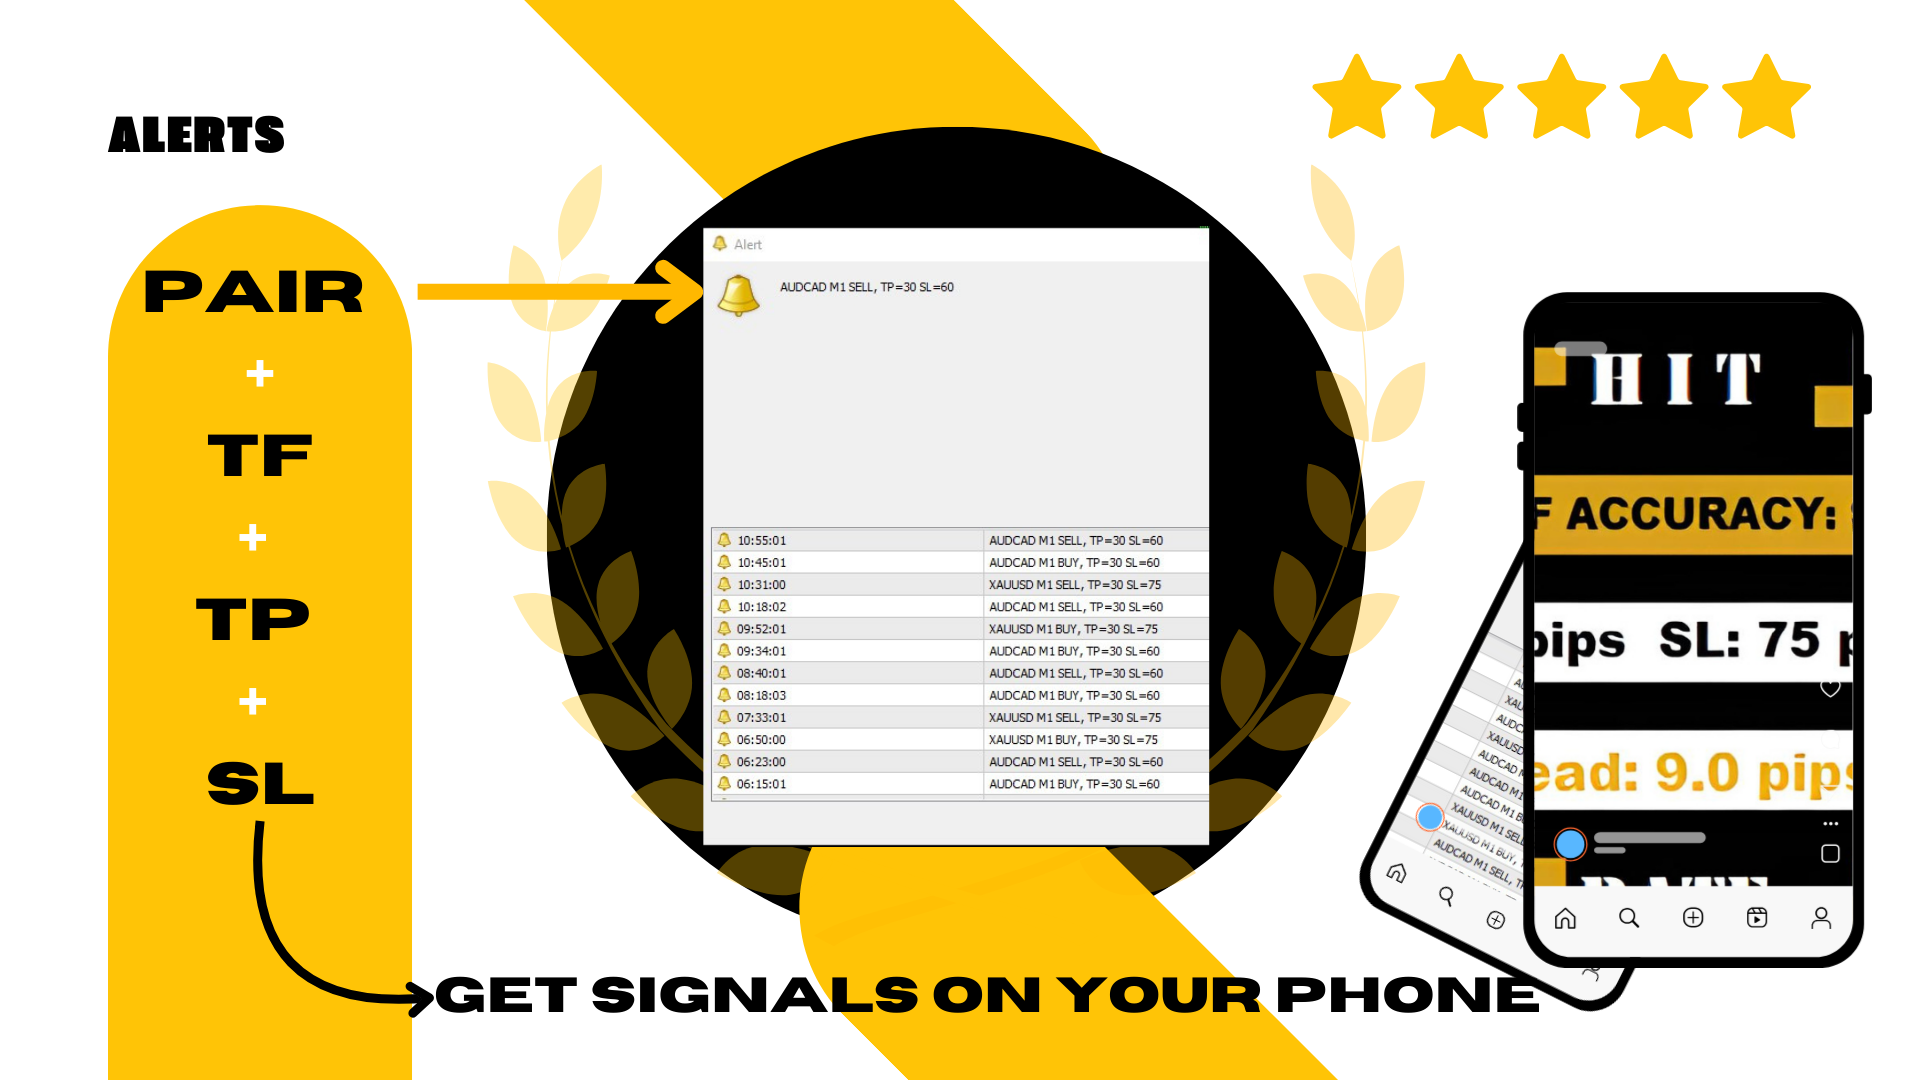
이 "단계별 안내"는 컴퓨터에서 설정해야 하지만, 그 후 휴대전화에서 거래 알림을 받을 수 있습니다. 방법은? 휴대전화에서 MT4 터미널로 푸시 메시지를 받을 수 있도록 설정하고 휴대전화에서 터미널 알림을 허용하십시오.

신호가 발생하면 다음과 같은 알림을 받게 됩니다: 페어 - TF - 신호 유형 (매수/매도) - 해당 페어에 대해 사전 설정된 TP 및 SL 값.


따라서 항상 컴퓨터 앞에 있을 필요는 없습니다. 휴대전화에서 거래를 열고, 해당 페어의 SL 및 TP를 설정하고 지속적인 모니터링 없이 거래를 진행할 수 있습니다.

컴퓨터에서 거래하는 것을 선호하는 경우, 각 페어에서 신호가 발생할 때마다 동일한 데이터(페어 - TF - 신호 유형 및 TP 및 SL 값)가 화면에 나타나며, 소리 및 시각적 신호도 함께 표시됩니다.


SL/TP와 성공률의 비율 이해

거래 전략의 성공은 두 가지 주요 요소에 따라 달라집니다: 첫 번째는 스톱 로스(SL)와 테이크 프로핏(TP)의 비율이며, 두 번째는 신호의 성공률입니다. 각 요소는 전략의 수익성에 중요한 역할을 하며, 이들이 어떻게 함께 작동하는지를 이해하는 것이 시스템 최적화에 중요합니다.

1. SL/TP 비율:

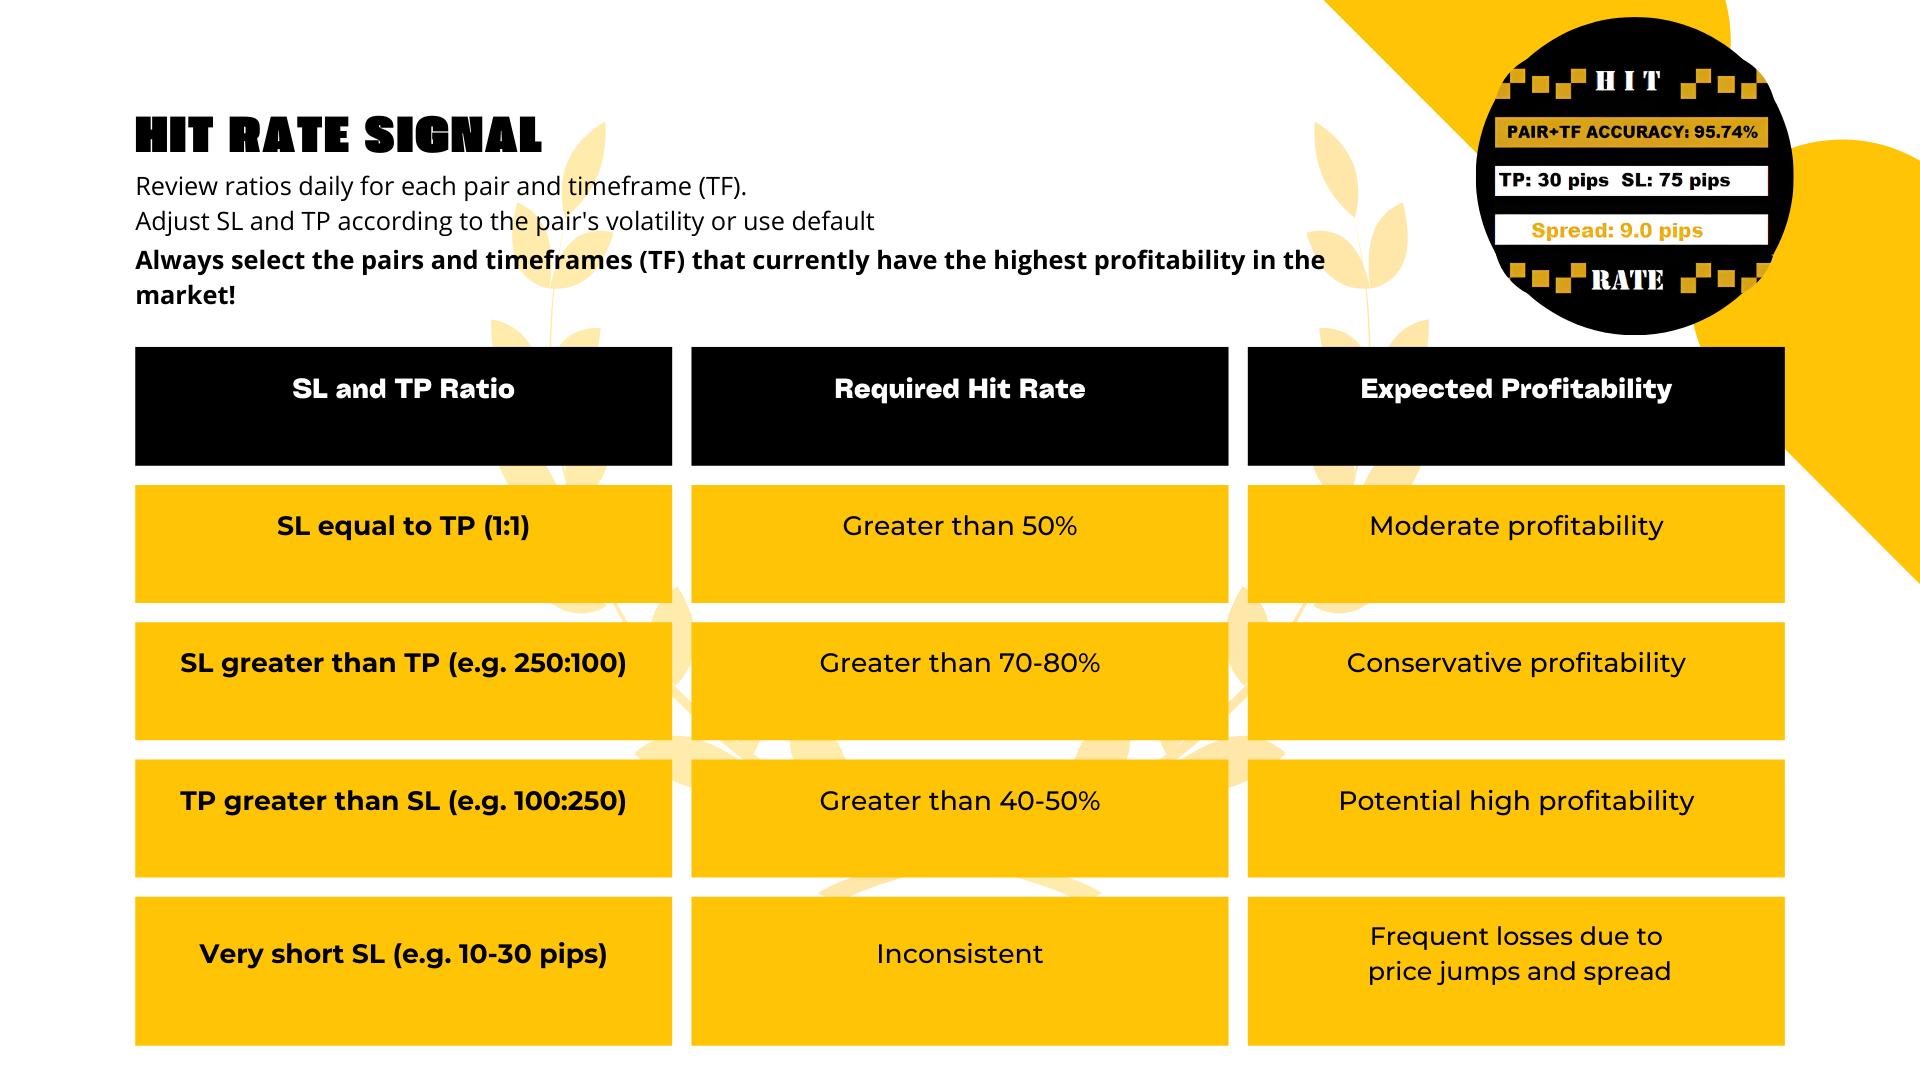
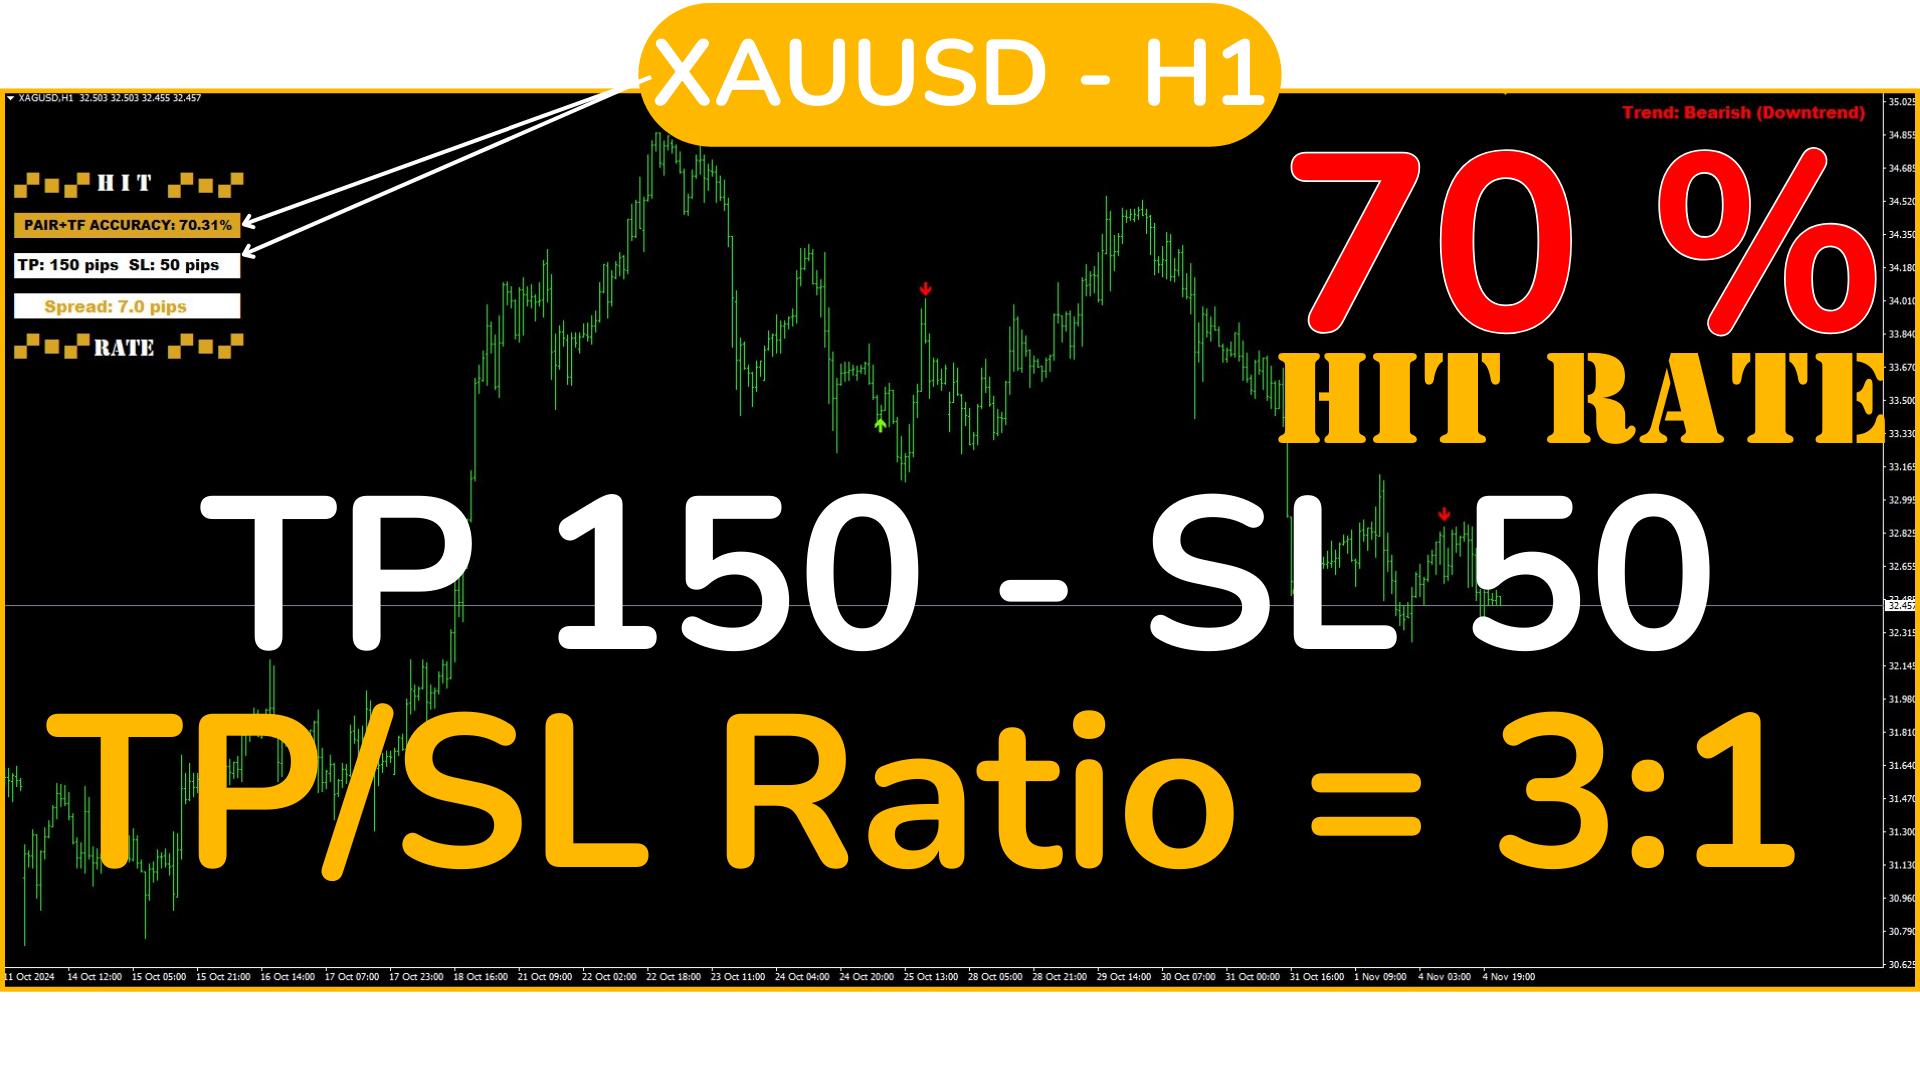
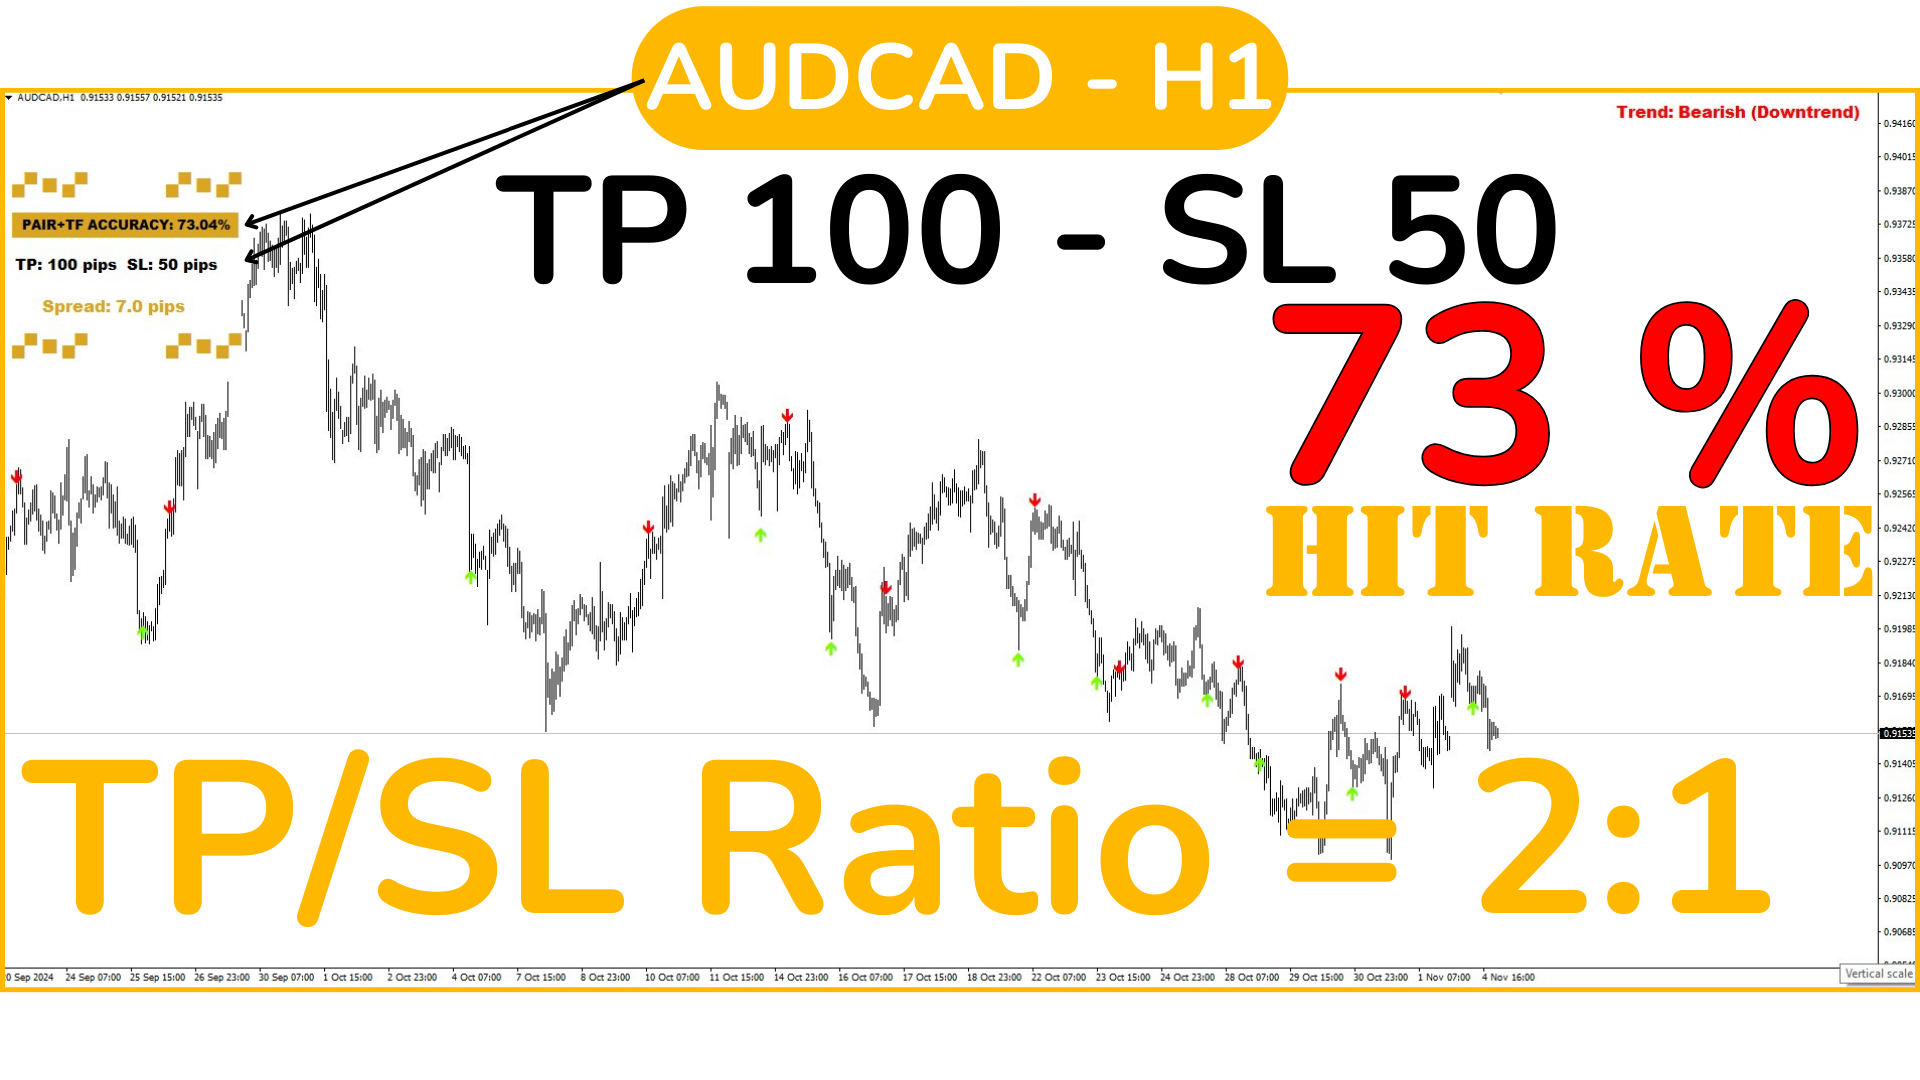
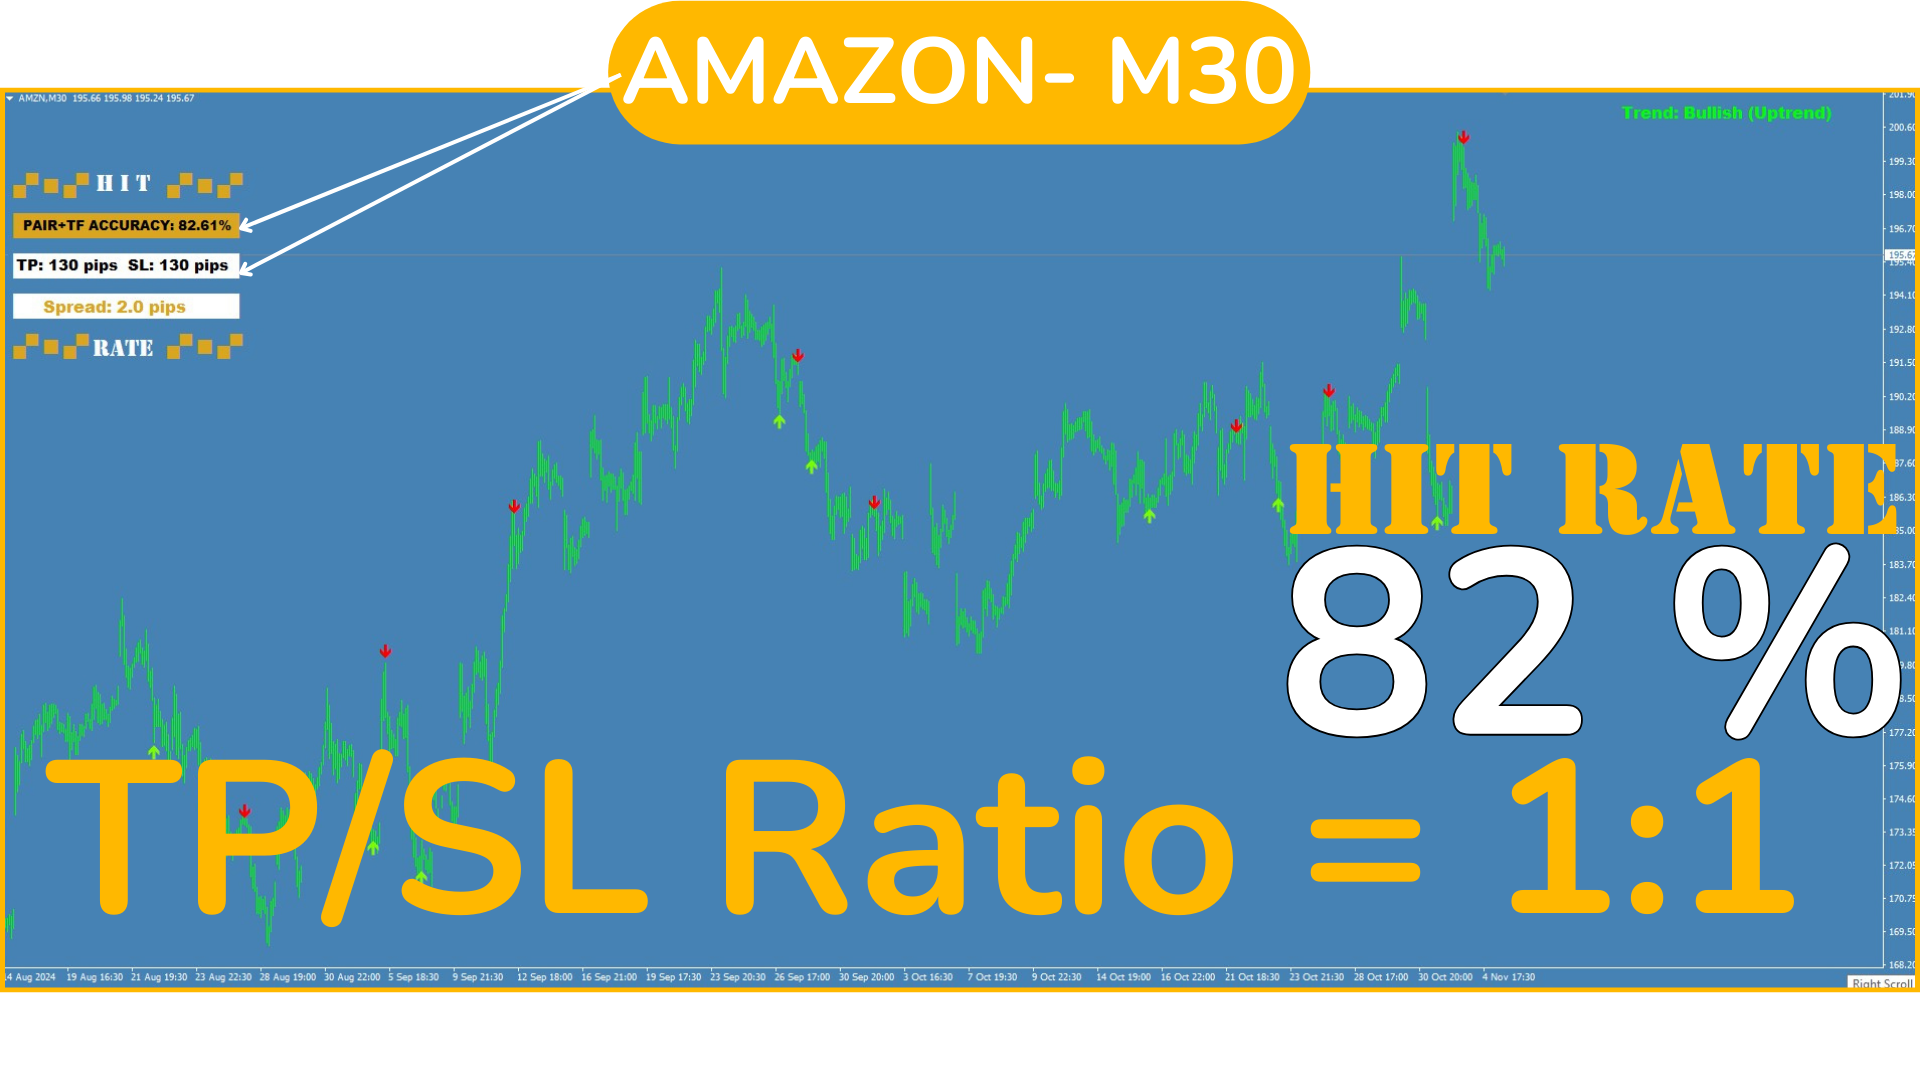
  • SL/TP 비율 1:1: TP 크기는 SL과 동일합니다(예: SL: 100핍 및 TP: 100핍). 이 경우 전략이 수익을 내기 위해서는 성공률이 50% 이상이어야 합니다. 승패의 금액이 비슷하기 때문입니다.
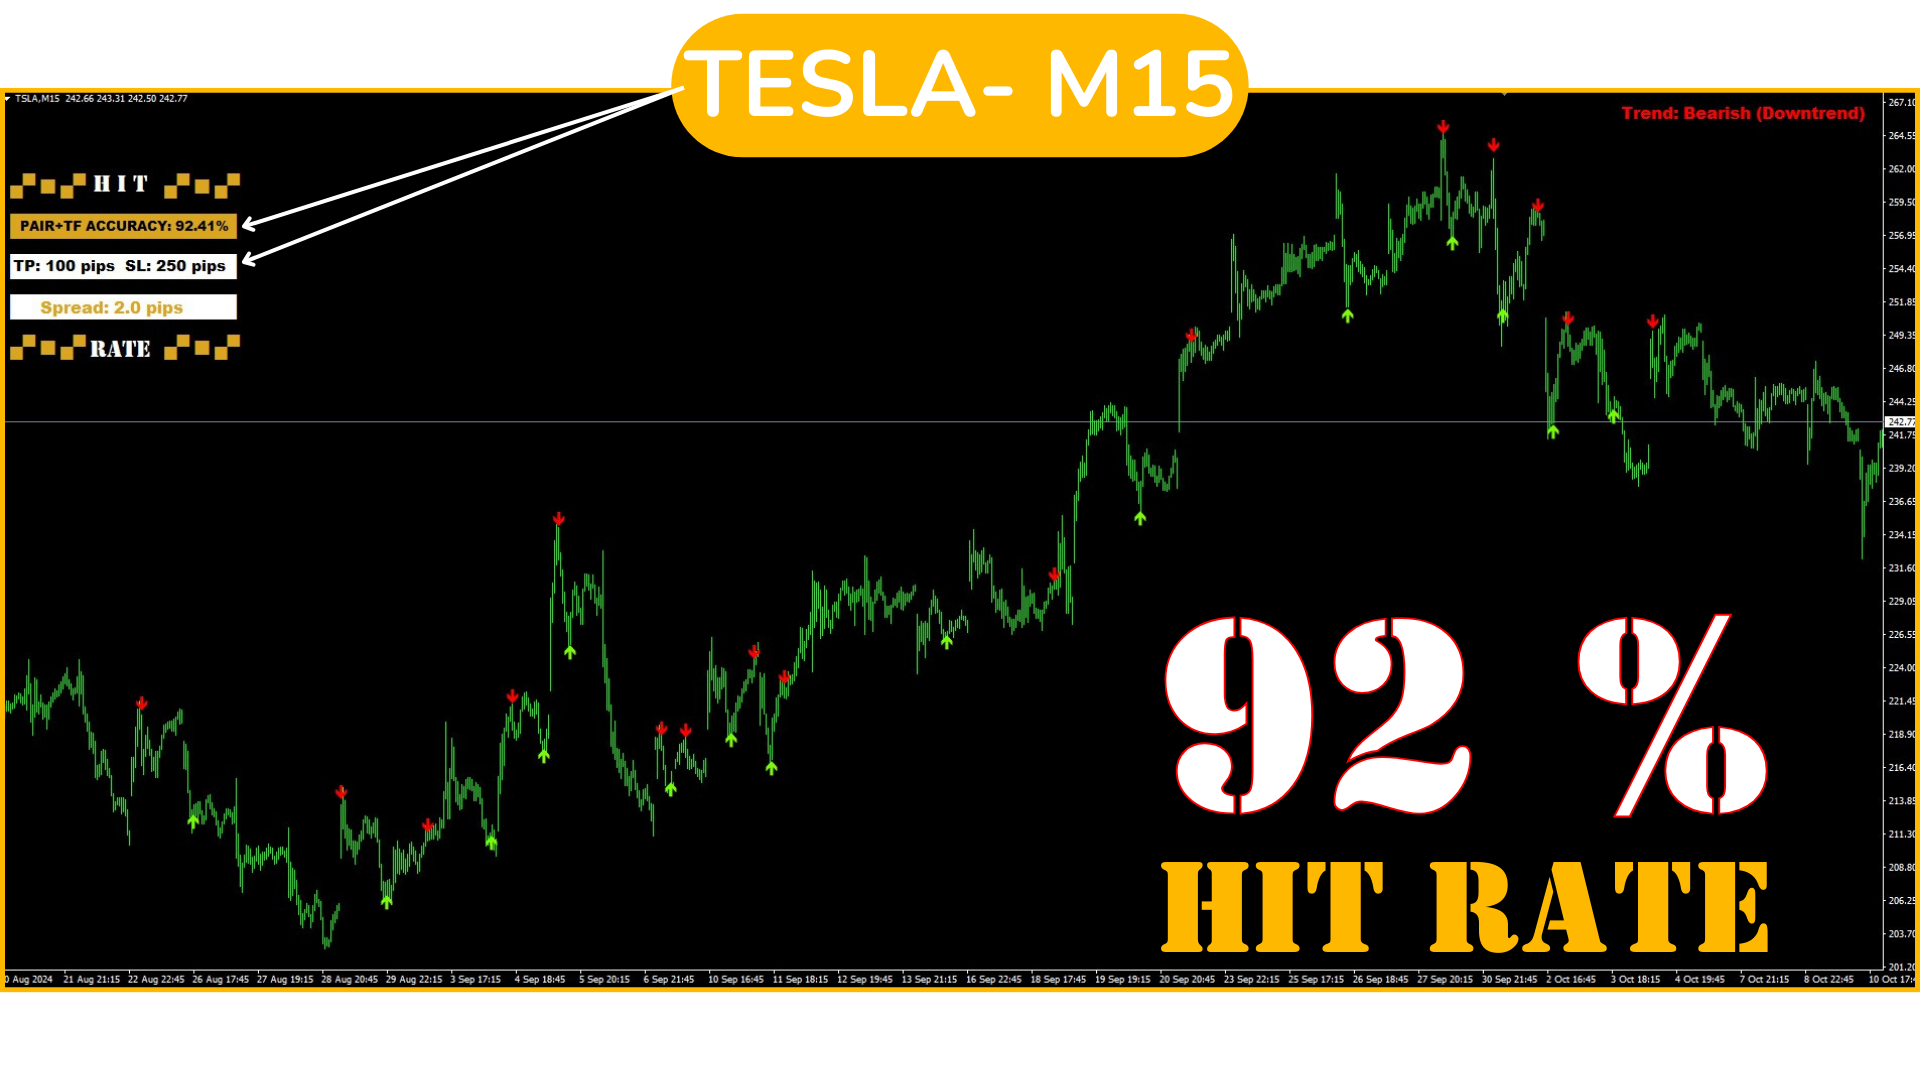
  • SL이 TP보다 클 때: (예: SL: 250핍 및 TP: 100핍), 손실을 보충하기 위해 더 높은 성공률이 필요합니다. 이 경우, 이상적인 성공률은 70% 이상입니다.
  • TP가 SL보다 클 때: (예: TP: 250핍 및 SL: 100핍), 각 수익이 여러 손실을 보상하므로 성공률이 낮더라도 전략이 수익을 창출할 수 있습니다. 이 경우, 40-50%의 성공률이 수익을 내기에 충분합니다.

모든 경우에 대해 주의하세요! SL이 매우 짧을 경우(예: 10-30핍), 스프레드로 인해 자주 실행되어 실제로는 승리할 거래가 손실로 끝날 수 있습니다. 항상 신중하게 가격에 충분한 공간을 남겨 두세요(넉넉한 SL).

2. 성공률:

  • 성공률은 시스템이 얼마나 자주 예측을 맞히는지 나타냅니다. 높은 성공률(예: 90%)을 가진 시스템은 신뢰할 수 있으며, SL이 TP보다 큰 넓은 SL/TP 비율을 허용합니다.
  • 그러나 낮은 성공률이 반드시 손실을 의미하는 것은 아니며, TP가 SL보다 훨씬 클 때 수익이 손실을 보충할 수 있습니다.

    이것이 바로 성공률을 미리 알고 좋은 자금 관리(SL+TP)와 함께 최적의 결과를 얻는 것이 중요한 이유입니다.


페어와 TF에 따른 최적화:

각 페어와 시간대는 동일한 SL/TP 비율에 대해 다르게 반응할 수 있으므로, 페어와 TF의 성과에 따라 SL 및 TP를 조정하는 것이 중요합니다. 예를 들어, 변동성이 큰 페어나 높은 TF에서는 더 넓은 TP를 사용하는 것이 유리할 수 있습니다.

각 페어와 TF에 대해 다양한 SL 및 TP 설정을 시도하여 각 경우의 성공률을 관찰하세요. 이를 통해 이익을 최대화하고 손실을 최소화하는 최적의 균형을 찾을 수 있습니다.


수익성 평가 예시:

SL이 250핍, TP가 100핍인 전략을 가정해 보겠습니다. 이 설정이 수익을 내기 위해서는, 성공률이 이상적으로 70%-80% 이상이어야 하며, 특정 페어의 변동성과 행동에 따라 다릅니다, 이는 SL이 실행되었을 때의 손실을 보상하기 위함입니다.

그러나 비율을 반대로 하여 SL을 100핍, TP를 250핍으로 설정하면, 성공률이 40-50%라도 충분할 수 있습니다. 각 수익 거래가 여러 손실을 보상하기 때문입니다.


요약:

  • SL이 TP보다 클 때: 높은 성공률(이상적으로 70% 이상)이 필요합니다.
  • TP가 SL보다 클 때: 성공률이 낮아도 작동할 수 있습니다, 약 40-50%.
  • 일일 최적화: 각 페어와 TF에서 선택한 비율이 유지되는지 매일 확인하여 최상의 성능을 달성하고, 페어의 성능이 저하되면 "단계별 안내"를 반복하고 최적의 구성을 다시 평가하십시오.

이 전략은 모든 외환 페어, 금, 은, 주식, 지수, 심지어 암호화폐(브로커가 허용하는 경우)와 모든 TF에서 사용할 수 있으므로, 스프레드가 너무 높은 페어나 찾고 있는 비율을 충족하지 않는 페어에 얽매일 필요는 없습니다. 최고의 선택을 하십시오!


마지막으로, 하나의 이상적인 설정은 없다는 점을 기억하세요. 설정을 변경하면 페어와 TF에 따라 다른 설정이 좋은 결과를 제공할 수 있음을 알 수 있습니다. 언제 거래를 해야 할지와 각 SL 및 TP(사전 테스트 완료)를 알려주는 명확한 신호를 가짐으로써, 히트율 탑 바텀 신호는 완전한 전략이 됩니다.
알림 데이터를 읽고 이에 따라 거래함으로써, 분석된 정보에 따라 결정을 내릴 수 있는 안도감을 가질 수 있습니다.

스트레스 없는 거래, 간단하고 명확합니다. 추측이나 의심 없이!


추천 제품
Black series MT4
Dmitriy Kashevich
1 (1)
Black series MT4 - The indicator is designed for trading on binary options with Timeframe M1-M5-M15 Multicurrency (Works on cryptocurrency and currency pairs) The signal appears when the candle opens Up to 90% correct signals There is no signal redrawing at all Can be used with other indicators. Good for scalping! In Settings there is: -Indicator working methods -I Allert Arrow color Red signal down Blue signal up Also watch the video how the indicator works and signals appear or te
Arbitrage Indicators is a professional and easy-to-use Forex trading indicator that uses the best trading principles of the latest AI arbitrage models. This indicator provides accurate buy and sell signals. Applies to currency pairs only. It has six different metrics options, MACD, KDJ, RSI, CCI, RVI, DEMARK. It can be freely switched by users, and intuitively shows the direction and reversal signal of the currency pair. When the two lines cross colors, the currency has a high probability of rev
AWTime Indicator
Komang Putra Riswanjaya
Overview The Time Trading Indicator AWT is designed for traders who often miss or overlook their trading opportunities. This tool helps users stay on top of their trading windows by providing timely alerts. Key Features User-friendly interface: Simple and intuitive design for easy navigation. Easy to use:   Set it up quickly and start receiving notifications instantly. Alert and Push Notifications:   Stay informed with real-time alerts and push notifications. Customizable Objects:   Adjust the
FREE
Alpha Trend sign has been a very popular trading tool in our company for a long time. It can verify our trading system and clearly indicate trading signals, and the signals will not drift. Main functions: Based on the market display of active areas, indicators can be used to intuitively determine whether the current market trend belongs to a trend market or a volatile market. And enter the market according to the indicator arrows, with green arrows indicating buy and red arrows indicating se
REX complete 3in1
Christophe Godart
This is the complete REX package. It consists of the lite, pro and ULTRA version.  Perfect for beginners and intermediates. REX complete is 100% non repaint. The strategy is based on a mix of different strategies, statistics, including pivot points, oscillators and patterns.  As the trading idea consists of a variety of some classic indicators like Momentum, Williams Percent Range, CCI, Force Index, WPR, DeMarker, CCI, RSI and Stochastic, it is clear that the fundamental indicators have being u
Chart Patterns Detect 15 patterns (Ascending Triangle, Descending Triangle, Rising Wedge, Falling Wedge, Bullish Flag, Bearish Flag, Bullish Rectangle, Bearish Rectangle Symmetrical triangle, Head and Shoulders, Inverted Head and Shoulders, Triple top, Triple Bottom, Double Top, Double Bottom) Use historical data to calculate the probability of each pattern to succeed (possibility to filter notification according to the chance of success) gives graphic indication about the invalidation level and
Szia! Egy indikátorral. Több idő gyertyájának kirajzoltatása egy charton. Különböző színek rendelhetők a long és short gyertyákhoz. Vonal vastagsága állítható. A gyertya kitöltése engedélyezhető. Hello! With an indicator. Drawing multiple time candles on a chart. Different colors can be ordered for long and short candles. Line thickness can be adjusted. Filling the candle can be allowed. Videó: https://www.youtube.com/watch?v=-9bequnAw-g&amp ;ab_channel=GyulaKlein
SRP Pro
Farhad Kia
5 (1)
Strong Retracement Points Pro edition! SRP (Strong Retracement/Reversal Points) is a powerful and unique support and resistance indicator. It displays the closest important levels which we expect the price retracement/reversal! If all level are broken from one side, it recalculates and draws new support and resistance levels, so the levels might be valid for several days depending on the market! If you are still hesitating to start using this wonderful tool, you can check this link to see how ef
Preface: First of all, let me introduce myself. I am a programmer and have been working for over 20 years. 2023 has passed, and our studio has achieved a record of 500 times with 7 manual transmissions. Below, we will show you how to do it through a series of operations. The first step is to model. Modeling is to find a fixed trading pattern. I think everyone has heard of a 2/8 probability, and through this probability, we can further refine it, which means that 1 to 4 is the optimal state. We h
FreqoMeterForecast
Stanislav Korotky
The main idea of this indicator is rates analysis and prediction by Fourier transform. Indicator decomposes exchange rates into main harmonics and calculates their product in future. You may use the indicator as a standalone product, but for better prediction accuracy there is another related indicator - FreqoMaster - which uses FreqoMeterForecast as a backend engine and combines several instances of FreqoMeterForecast for different frequency bands. Parameters: iPeriod - number of bars in the ma
Visual Vortex Indicator MT4
AL MOOSAWI ABDULLAH JAFFER BAQER
Unleash the Power of Market Dynamics with the Vortex Indicator!   The   Visual Vortex Indicator   is your advanced tool for decoding market trends, reversals, and momentum shifts. Priced at $65, this indicator provides a comprehensive view of market behavior, but it’s designed for   you   to fine-tune and optimize it according to your unique trading strategy. What Makes It Unique? The Vortex Indicator is based on a strategy that identifies directional movements and trend strength by anal
This indicator is another variant of the famous powerful indicator Fibonacci-SS https://www.mql5.com/en/market/product/10136 but has different behaviour in placing Pending Order and TP Line. Automatically places Fibonacci retracement lines from the last highest and lowest visible bars on the chart with: An auto Pending Order (Buy/Sell). Taking Profit 1, Taking Profit 2 is pivot point and Taking Profit 3 for extended reward opportunity. The best risk and reward ratio. Simple and powerful indicat
This advisor enters the market at the opening of   London Market . It has a automatic function that give buy (arrow up green) and sell (arrow down red) signal when the indicator met high probabilities requirements.Once the signal is generated it is the trader discretions to start the order button and do trade manually. Stop loss are base on ATR. Recommended Take profit is 20pips.  The trading system is suitable for both experienced traders and beginners.  Timeframe is  M5 . Minimum account bal
Stratos Pali
Michela Russo
5 (1)
Stratos Pali Indicator   is a revolutionary tool designed to enhance your trading strategy by accurately identifying market trends. This sophisticated indicator uses a unique algorithm to generate a complete histogram, which records when the trend is Long or Short. When a trend reversal occurs, an arrow appears, indicating the new direction of the trend. Important Information Revealed Leave a review and contact me via mql5 message to receive My Top 5 set files for Stratos Pali at no cost! Dow
RTSPattern
Tomas Belak
The indicator provides a superior alternative to price action analysis. It enables the identification of normalized patterns, which are then transformed into a graphical representation to forecast future steps within a time series. In the top-left corner, you'll find information regarding the expected prediction accuracy, determined through a complex MSQE calculation. You have the flexibility to adjust the time window, making it easy to validate the indicator's performance. Additionally, you can
True SnD
Indra Lukmana
5 (1)
This Supply & Demand indicator uses a unique price action detection to calculate and measures the supply & demand area. The indicator will ensure the area are fresh and have a significant low risk zone. Our Supply Demand indicator delivers functionality previously unavailable on any trading platform. Trading idea You may set pending orders along the supply & demand area. You may enter a trade directly upon price hit the specific area (after a rejection confirmed). Input parameters Signal - Set
Simple to read and powerful, no fancy lines and drawings to clutter your chart or distract you. The trend probability oscillator estimates how likely a trend will continue in a certain period. The cummulator period controls how many bars in the past to use and is a proxy for the timescale the trend probability should hold. The use of a Max Line improves this further by indicating when a trend is likely to reverse. In most cases a trend must lose momentum before reversing. Hence, a trend probabil
Gartley Projection D
Oleksandr Medviediev
3.71 (7)
The indicator identifies the harmonic patterns (XABCD) according to developments of H.M.Gartley ( "Profits in the Stock Market" , 1935г). It projects D-point as a point in the perspective projection (specify ProjectionD_Mode = true in the settings). Does not redraw. When a bar of the working timeframe closes, if the identified pattern point has not moved during Patterns_Fractal_Bars bars, an arrow appears on the chart (in the direction of the expected price movement). From this moment on, the ar
Watch the Clock
David Leander Tschacher
Watch the Clock shows a clock at a desired position. The clock is useful if you want to check when a candle closes. You can also set an alert to be prepared before the news. ️ Watch the Clock works also in the strategy tester. ️ Watch the Clock requires a minimum of CPU power. ️ Watch the Clock can improve your manual style of trading. Inputs Alert -> At which time should the alert occur? Time Shift in Minutes -> Should the time be incremented by x minutes? Size -> The font size of the tim
MACD Divergence
Sergey Deev
2.5 (2)
The indicator detects divergence signals - the divergences between the price peaks and the MACD oscillator values. The signals are displayed as arrows in the additional window and are maintained by the messages in a pop-up window, e-mails and push-notifications. The conditions which formed the signal are displayed by lines on the chart and in the indicator window. Indicator Parameters MacdFast - fast MACD line period MacdSlow - slow MACD line period MacdSignal - MACD signal line period MacdPric
Dynamic Forex28 Navigator
Bernhard Schweigert
5 (4)
Dynamic Forex28 Navigator - 차세대 외환 거래 도구. 현재 49% 할인. Dynamic Forex28 Navigator는 오랫동안 인기 있는 지표의 진화형으로, 세 가지의 힘을 하나로 결합했습니다. 고급 통화 Strength28 지표(695개 리뷰) + 고급 통화 IMPULSE with ALERT(520개 리뷰) + CS28 콤보 신호(보너스). 지표에 대한 자세한 정보 https://www.mql5.com/en/blogs/post/758844 차세대 Strength 지표는 무엇을 제공합니까?  원래 지표에서 좋아했던 모든 것이 새로운 기능과 더 높은 정확도로 강화되었습니다. 주요 기능: 독점적인 통화 Strength 공식.  모든 시간대에 걸쳐 부드럽고 정확한 강도선. 추세와 정확한 진입을 식별하는 데 이상적입니다. 역동적인 시장 피보나치 수준(시장 피보나치).  이 지표에만 있는 고유한 기능. 가격 차트가 아닌 통화 강도에 피보나치가 적용됩니다.
ZhiBiMACD MT4
Qiuyang Zheng
4.5 (2)
This is a unique MACD indicator that is more accurate and easy to use than traditional MACD. It is suitable for any chart cycle and is suitable for any market variety. The red column is the (Buy) band signal, and the blue column is the (Sell) band signal. The yellow and green lines are trend lines, and the two lines never cross. Buy: In the blue column, look at the green line up through the middle 0 axis. Sell: In the red column, look at the yellow line down the middle 0 axis. The MACD's de
The indicator identifies two most important patterns of technical analysis - Pin Bar and Engulfing. MT5-version  https://www.mql5.com/en/market/product/53701 Settings: Mincandle size for PinBar - The minimum size of the Pin-Bar candlestick; Percentage of candle body on size - The percentage of the candle body in relation to its length; PinBar Alert - Alert when a Pin-Bar is detected; PinBar Mail - Sends an email when a Pin Bar is found; PinBar Notification - Sends a push notification when a Pin
PABT Pattern Indicator - it's classical system one of the signal patterns. Indicator logic - the Hi & Lo of the bar is fully within the range of the preceding bar, look to trade them as pullback in trend. In the way if indicator found PABT pattern it's drawing two lines and arrow what showing trend way.  - First line - it's entry point and drawing at: 1. On the high of signal bar or on middle of the signal bar (depending from indicator mode) for buy; 2. On the low of signal bar or on middle of t
RiKen
Gabriel Gomes
RiKen: 검증된 정확성과 신뢰성으로 기술 분석을 혁신 RiKen을 발견하세요, 귀하의 트레이딩 경험을 변화시키기 위해 설계된 혁신적인 기술 분석 도구입니다. 이 지표는 독특한 기능으로 금융 시장을 재정의하며 기술 분석의 기준을 높입니다: 70%의 인상적인 정확도 : RiKen은 70%의 눈에 띄는 정확도로 매수 및 매도 신호를 제공함으로써 두드러집니다. 이 정확도는 투자 결정을 최적화하고자 하는 트레이더에게 소중한 자산이며, 더 수익성 있는 트레이딩 작업을 위한 견고한 기반을 제공합니다. 시각적 화살표로 혁신적인 신호 제공 : 차트의 직관적인 화살표를 통해 RiKen은 이상적인 진입 및 출구 포인트를 명확하게 지시합니다. 이 기능은 집중적인 수동 분석의 필요성을 최소화하며, 명확성과 정확성으로 트레이딩 기회를 강조합니다. 재그리기 없음, 잘못된 신호 제거 : 기본적으로 RiKen은 재그리기 없이 설계되어 제공되는 신호가 확정적이고 신뢰할 수 있음을 보장합니다. 이 기능은 잘못된
Indicement MT4
Profalgo Limited
5 (2)
Indicement에 오신 것을 환영합니다! PROP FIRM 준비 완료! ->   여기에서 세트 파일을 다운로드하세요 프로모션 출시: 현재 가격으로는 몇 개밖에 남지 않았습니다! 최종 가격: 990$ NEW: Choose 1 EA for FREE! (limited to 2 trading account numbers) 최고의 콤보 딜     ->     여기를 클릭하세요 공개 그룹에 가입하세요:   여기를 클릭하세요   LIVE SIGNAL INDICEMENT는   제가 15년 동안 축적한 경험을 바탕으로 지수 시장에 전문적 거래 알고리즘을 개발했습니다. EA는 매우 잘 고안된 알고리즘을 사용하여 최상의 진입 가격을 찾고, 거래 위험을 분산하기 위해 내부적으로 여러 가지 전략을 실행합니다. 모든 거래에는 손절매와 이익실현이 있지만, 거래의 위험을 최소화하고 잠재력을 극대화하기 위해 추적 손절매와 추적 이익실현도 사용합니다. 이 시스템은 매우 인기 있고 검증된 전략, 즉 중요한 지
Owl smart levels
Sergey Ermolov
4.28 (36)
MT5 버전  |   FAQ Owl Smart Levels Indicator 는   Bill Williams 의 고급 프랙탈, 시장의 올바른 파동 구조를 구축하는 Valable ZigZag, 정확한 진입 수준을 표시하는 피보나치 수준과 같은 인기 있는 시장 분석 도구를 포함하는 하나의 지표 내에서 완전한 거래 시스템입니다. 시장과 이익을 취하는 장소로. 전략에 대한 자세한 설명 표시기 작업에 대한 지침 고문-거래 올빼미 도우미의 조수 개인 사용자 채팅 ->구입 후 나에게 쓰기,나는 개인 채팅에 당신을 추가하고 거기에 모든 보너스를 다운로드 할 수 있습니다 힘은 단순함에 있습니다! Owl Smart Levels   거래 시스템은 사용하기 매우 쉽기 때문에 전문가와 이제 막 시장을 연구하고 스스로 거래 전략을 선택하기 시작한 사람들 모두에게 적합합니다. 전략 및 지표에는 눈에 보이지 않는 비밀 공식 및 계산 방법이 없으며 모든 전략 지표는 공개되어 있습니다. Owl Smart Leve
Spirit mt4
Alena Snigireva
5 (1)
Spirit mt4 is an indicator that works without flashing, the signals are triggered after the arrow at the beginning of the next candle Includes several indicators for overbought and oversold levels. Works with any currency pair: EUR/USD, AUD/USD and others. After the purchase, send me a private message and I will send you the settings that I use for this indicator. Suitable for trading cryptocurrencies. I like to trade cryptocurrency more, so I use it more there. It can also be used for bi
Distinctive
Tatiana Savkevych
Distinctive is a forex trending arrow indicator for identifying potential entry points. I like it, first of all, because it has a simple mechanism of work, adaptation to all time periods and trading tactics. Created on the basis of a regression channel with filters. Plotting the Lawrence indicator signals on a price function chart using a mathematical approach. How it works - when the price breaks out in the overbought / oversold zone (channel levels), a buy or sell signal is generated. Everyt
Trendiness Index
Libertas LLC
5 (3)
"The trend is your friend" is one of the best known sayings in investing, because capturing large trendy price movements can be extremely profitable. However, trading with the trend is often easier said than done, because many indicators are based on price reversals not trends. These aren't very effective at identifying trendy periods, or predicting whether trends will continue. We developed the Trendiness Index to help address this problem by indicating the strength and direction of price trend
이 제품의 구매자들이 또한 구매함
거래 속도는 시장에서 대량 주문이 언제 어디서 누적되는지, 그리고 이로 인한 이점을 보여주는 최고 품질의 지표입니다. 매우 초기 단계에서 추세 변화를 감지합니다. 이는 지표이자 동시에 트레이딩 시스템입니다. 이 개념은 독특하고 수익성이 매우 높습니다. 외환에서 틱 볼륨은 거래량이라고 오해의 소지가 있습니다. 실제로는 단위 시간당 가격 변동으로, 사실상 거래 속도입니다. 이 지표는 외환에서 볼륨에 대한 개념을 완전히 수정하여 올바른 방식으로 논리적으로 정의하고이 논리를 적용하면 독특하고 정확한 최상위 수익성 도구가됩니다. 속도가 증가하면 더 큰 관심과 그에 상응하는 진입 및 출구의 신호입니다. 사용 방법: 이 지표는 시장에서 거래 속도를 측정하고 비교하기 때문에 가장 먼저해야 할 일은 다음과 같습니다.  이러한 비교를 할 기간을 선택합니다.  일반적으로 15일 전이 비교를 위한 좋은 출발점입니다.  인디케이터에 날짜를 입력하고 실행합니다.  30분 또는 1시간의 기간에서 속도
Trade Invest Pro
Dmitriy Kashevich
Trade Invest Pro - Boss in the world of cryptocurrency! This indicator is ideal for cryptocurrency trading! Work on Trade Invest Pro took us half a year! But not in vain! Now only accurate signals near support - resistance levels! He showed himself well on timeframes m5 m15 for binary options! Optionally, it can be configured for forex for timeframes m30 and more! Reacts well to news! Doesn't paint! and does not disappear from the schedule! As soon as a red arrow appears, open a deal fo
ON Trade Optuma Astro
Abdullah Alrai
5 (4)
물론입니다. 아래는 제공해주신 텍스트의 한국어 번역입니다: MT4용 천문학 지표 소개: 귀하의 최상급 하늘 트레이딩 동반자 트레이딩 경험을 천체의 높이로 끌어올리기 준비가 되셨나요? MT4용 천문학 지표를 소개합니다. 이 혁신적인 도구는 복잡한 알고리즘의 힘을 활용하여 탁월한 천문학적 통찰과 정밀한 계산을 제공합니다. 정보의 우주를 손에 담다: 천문학적 데이터의 보물함을 드러내는 포괄적인 패널을 살펴보세요. 행성의 지오/헬리오센트릭 좌표, 태양/지구 거리, 크기, 길이, 별자리, 황도 좌표 및 적도 좌표, 심지어 수평 좌표 등 각각이 정밀하게 계산되고 아름답게 제시됩니다. 지표에 의해 생성된 수직선은 시간 값에 해당하여 트레이딩 여정에 우주적인 시각을 부여합니다. 행성 라인과 관계: 수정 가능한 스케일과 각도로 차트를 장식하는 행성 라인의 마법을 경험해보세요. 직관적인 컨트롤 패널을 통해 각 행성의 라인의 가시성을 손쉽게 전환할 수 있습니다. 쥰션이나 섹스타일, 사분각, 삼분각, 트
Smooth price for Monarch MT4
Konstantin Gruzdev
3.67 (3)
The Smooth Price technical indicator is used for plotting a smoothed line as close to the price of the financial instrument as possible, and serves to eliminate its noise components. The indicator is part of the Monarch trading system, but here it is presented as an independent technical analysis tool. The indicator is based on the cluster digital filter , which, unlike the ClusterSMA , is applied directly to the price time series. Smooth Price does not redraw (except the very last, zero bar) an
Mafaranga
Phillimon Shumbusho
The real market buy/Sell signals, you can trust.  This indicator tracks the trend strength, the market strength, the real current volume, and the price direction to give traders and investors the optimum point for entry in the form of signals. The time frames range from 5 minutes to one (1) hour chart. Trading on higher time frames produce the best outcomes, but also do produce less frequent trades, compared to trading on lower time frames.
Market Interest
Paul Edunyu Carissimo
Oni Scalper
Goh Cheng Wai
3.67 (3)
Dear Onis, This Indicator is used for   GBPUSD, US30 and GOLD on 1-Min Chart . For US30 , Depending on your broker, Minimum Lot Size will differ from 0.01 to 1.0 lots. My Current Account is trading at 1.0 lots at $1 per point . Please check with your Broker what's the Margin Required for your Minimum lot sizes before you trade on your Real account. I have Forward Tested the indicator for around 6 months before releasing it to the public. ( No Demo is available for the Indicator, Strategy Teste
Automatic, live & interactive picture of all trendlines. Assign push, email and sound alerts to the lines of your choice and be informed about price rollback, breakout, rollback after breakout, number of rollbacks, line expiration by double breakout. Correct, drag or delete the lines and interactively tune the line system. https://youtu.be/EJUo9pYiHFA . Chart examples https: //www.mql5.com/en/users/efficientforex Price Interaction Events All events are effective immediately and only after one
The indicator displays the probable ( Support and resistance ) levels. The indicator draws horizontal and trend levels of support and resistance. The indicator settings: Trends - the mode for displaying trend lines or horizontal lines of support and resistance Yes - display trend lines only No - display horizontal lines only UseResource - use the resources built into the indicator. Yes - use the ZigZag indicator from the resources of the product. No - use a custom ZigZag indicator. HistoryBar -
THE GRAFF III
Antonin Skaryd
The [GRAFF] III manual trading system is based on multiple MetaTrader (MT4) indicators. Together, the entire PACK of GRAFF III indicators makes an advanced trading tool. The system consists of over 20 different custom-built indicators which have been carefully selected and tested in the long term to produce strong and efficient trading signals. The particular indicators are based on different mathematical formulas, so the entire system is calibrated to remove false signals from its own indicator
You can fins our other products from link : https://www.mql5.com/en/users/drbastem/seller   Also, you can ask all your questins from email : haskayafx@gmail.com or mobile : +90 530 867 5076 or @MehmetBastem    on telegram application This indicator is used to determine the trend. Standard Osma indicator is used. It has the indicator warning system: beep, e-mail and has three types of alerts, including messages to mobile phone. It shows the best performance on the chart of 5 minutes. When the
You can fins our other products from link : https://www.mql5.com/en/users/drbastem/seller   Also, you can ask all your questins from email : haskayafx@gmail.com or mobile : +90 530 867 5076 or @MehmetBastem    on telegram application This indicator is used to determine the trend. Standard Three Moving Average and ADX indicators are used. It has the indicator warning system (audio, e-mail) and three types of alerts, including messages to mobile phone. It shows the best performance on M5. When
This indicator is used to determine the trend. Standard Three Moving Average and ADX indicators are used. It has the indicator warning system (audio, e-mail) and three types of alerts, including messages to mobile phone. It shows the best performance on M5. When the trend value reaches the value set, the warning system is activated. This indicator works only with Forex symbols. Inputs SoundAlarm = true - Sound Alert Sendmail=true - Send an e-mail in case of a buy or sell signal Sendnotification
You can fins our other products from link : https://www.mql5.com/en/users/drbastem/seller   Also, you can ask all your questins from email : haskayafx@gmail.com or mobile : +90 530 867 5076 or @MehmetBastem    on telegram application This indicator is used to determine the trend. Standard MACD indicator is used. It has the indicator warning system: beep, e-mail and has three types of alerts, including messages to mobile phone. It shows the best performance on the chart of 5 minutes. When the
이 인디케이터는 "회귀 채널 도구" 개념을 기반으로 한 강력한 시장 분석 방법을 제공합니다. 이 도구를 활용하여 트레이더는 차트의 회귀 채널을 탁월하게 제어하고 보다 근거 있는 거래 결정을 할 수 있습니다. 회귀 채널 도구는 트레이더 도구 상자 내에서 강력한 도구입니다. 가격 트렌드와 잠재적인 지지 및 저항 수준에 대한 유용한 통찰력을 제공하는 것을 목표로합니다. 이 도구는 특히 트렌드 내의 수정 웨이브를 시각화하는 데 효과적이며 가격 역학의 포괄적인 전망을 제공합니다. 이제 이 인디케이터의 주요 기능과 이점에 대해 더 자세히 살펴보겠습니다: 채널 수준 및 지지/저항: 이 인디케이터의 주요 장점 중 하나는 동적인 지지 및 저항 영역으로 작동하는 채널 수준을 생성할 수 있는 능력입니다. 이러한 수준은 잠재적인 진입 및 이탈 포인트를 식별하는 데 중요하며 거래 전략의 정밀도를 향상시킵니다. 수정 웨이브 수준: 수정 웨이브 수준을 활성화하여 트레이더는 큰 트렌드 내에서 잠재적인 수정을
A simplistic indicator informing a user on RSI divergence by sending messages to mobile device and email. The indicator draws 2 vertical lines, marking two RSI extrema that formed the divergence. You get the alert, open the charts and make a decision. The indicator does not show past divergences, thus when you attach it to a chart for the first time you see nothing. Graphics and alerts will appear as soon as divergences do. Drop it in Tester to see how it works. Parameters: RSIPeriod - number of
Pan PrizMA CD Phase is an analogue of the МetaТrader 5 indicator , and is an option based on the Pan PrizMA indicator. Details . Averaging by a quadric-quartic polynomial increases the smoothness of lines, adds momentum and rhythm. Extrapolation by the sinusoid function near a constant allows adjusting the delay or lead of signals. The value of the phase - wave status parameter (which is close in meaning to the trigonometric phase or the angle of the radius-vector rotation in the trigonometric p
Green Wall Arrows
Daniel Luchinger
1 (1)
The Name Green Wall : Arrows hits a lot of TP, by changing the idea of non using SL as something bad, but instead use Small TP and a lot of free Margin and Patience. Use micro TP and a lot of Free Margin with this indicator on Forex. It also can be used with Binary Options. This strategy is intended to be traded Manually. This Indicator runs on Open Bar, arrows will delete when price are against it. The only Indicator Parameter is Alerts true/false, all the rest is included inside the code. Arro
Golden Monowave
Ahmed Mohamed Ali
Golden Monowave is monowave indicator, the monowave theory is one of Elliott wave approach and one of most complicate and accurate method. Golden Monowave can shortcut many major steps to identify and describe the monowave. It works on any timeframe and with any trading instrument, including currencies, indices, futures, etc. Input Parameters initial_Bars - set the initial number of bars to calculate. wave_color - select the color of the wave. label_color - select the color of labels. temp_labe
Ticks Size
Viktor Kolmakov
This indicator displays in a separate window the difference between the number of points which increased the price, and the number of points that decreased the price during the time interval specified in the settings. The time interval for calculation is expressed as the number of bars of the chart the indicator is attached to. This approach allows you to evaluate the movement direction (growth or fall) of the instrument's price, the strength of the movement and the size of the movement in point
NostradamusMT4
Andrey Spiridonov
1 (1)
NostradamusMT4 is a powerful indicator from the set of professional trader. The indicator is based on Andrei Spiridonov's original price calculation method (ESTIMATED PRICE) for the current candle price. Advantages The indicator does not redraw. It works on any timeframes. Works with any trading instruments. Perfectly suitable for scalping and trading binary options. Parameters Color - color of the ESTIMATED PRICE FUTURE line. How to work with the indicator The indicator forms the ESTIMATED P
BinaryIndicator
Andrey Spiridonov
BinaryIndicator is a highly accurate indicator for trading binary options. It shows excellent results in scalping. This indicator is based in multifactor analysis of trend indicators, as well as confirmation oscillators, which in the end gives an increased accuracy of signals. Advantages of the indicator Increased accuracy of signals. Excellent results when trading binary options with a short expiration time from M30 to M1 . It works on any timeframes. Works with any trade symbols. Parameters
FutureTrade
Andrey Spiridonov
3 (2)
FutureTrade is one of the few indicators that predicts the price right on the price chart. The indicator calculation algorithm is based on the fast Fourier transform. Given the oscillatory behavior of the price, the Fourier function predicts its future behavior. The indicator should be attached in the usual way to a chart with the trading instrument specified symbol and with the M15 timeframe. This timeframe is the most optimal for working with any symbols. Once started, the indicator calculates
BinaryScalping
Andrey Spiridonov
BinaryScalping is a professional indicator for trading binary options and scalping. The algorithm of the indicator is based on the calculation of pivot points for each time period separately, the location of the price of the trading instrument relative to the pivot points is analyzed and the probability of a trading operation is calculated. The indicator has a built-in filter of trading signals based on the global trend. The indicator is installed in the usual way and works with any trading inst
Primus Trading Engine is a trading system that combines price action,ratio based indicators & custom indicators to create this leading indicator with a multi-timeframe approach to give you high probability trade setups for forex,CFD cash/futures,metals & binary option to assist in making predictions on what is MOST likely to happen in the market Main Chart Features Price Action Signal-Arrow displayed on a specific bar;NOT buy/sell arrow;DOES NOT repaint;Bullish arrow on a bullish bar,price is l
This is the FXTraderariel PowerTrend . It compute a trendfollowing system based on it own algorithm. It gives you a buy or sell signal based on the trend. It based on the Supertrend, but our Version is not repainting. Furthermoore we added some Improvements and you can get an Arrow, Push or Alert when the trend changes. Depending on the settings it and trading style, it can be used for scalping or long-term trading . The indicator can be used on every time frame , but we advise to use it on H1
BinaryUniversal
Andrey Spiridonov
BinaryUniversal is a signal indicator for binary options and Forex. In its work, the indicator uses a complex algorithm for generating signals. Before forming a signal, the indicator analyzes volatility, candlestick patterns, important support and resistance levels. The indicator has the ability to adjust the accuracy of the signals, which makes it possible to apply this indicator for both aggressive and conservative trading. The indicator is set in the usual way, it works on any time period and
Sweet Waffle
Christophe Godart
The arrows are calculated with: -     2 Parabolic  parameters -     2 ADX parameters -     4 Stochastic parameters We recommend to combine it with Parabolic, ZigZag or Elliot waves indicator. Always trade the trend! If you make sure to draw your trend lines and support/resistance zones you will just have to wait for the signal to appear. Take the trade. For Binary Options it is advisable to set the expiry time to 5-15 min in M1 chart. THIS INDICATOR IS ZERO REPAINT Best assets to trade: - EUR
Let´s try to make some real money! Call me profit addicted. I thought why not try to make THE dream come reality. With discipline, a clear strategy and this indicator I focus on entering the perfect trades. This indicator is very easy to use as you will get perfect entry points for Put or Call trades. The arrows are calculated with: -     Momentum  parameters -     Candle stick patterns -     Fundamental Price action We recommend to combine it with Parabolic, ZigZag or Elliot waves indicator
제작자의 제품 더 보기
Aurum Apex Mt4 EA
Martin Alejandro Bamonte
3 (2)
이제 댓글 탭에서 Aurum Apex의 데모 버전을 다운로드하여 귀하의 브로커에서 실시간 성능을 평가할 수 있습니다!  설명 Aurum Apex EA는 MT4 플랫폼을 위해 설계된 강력한 100% 자동화된 거래 도구입니다. 실시간으로 시장을 분석하고 다양한 거래 기회를 감지합니다. 모든 수준의 트레이더에 적합한 Aurum Apex EA는 위험 매개 변수를 통해 조정 가능한 세 가지 리스크 모드를 제공합니다: 리스크 = 0.1 (낮은 리스크): 금 거래에 익숙하지 않은 신규 트레이더에게 이상적입니다. 이 설정은 놀라움을 최소화하고 신뢰를 쌓습니다. 리스크 = 0.2 (중간 리스크): 금 거래에 익숙한 경험 많은 트레이더를 위한 것입니다. 수익 가능성과 손실의 최적의 균형을 제공합니다. 리스크 = 0.3 (높은 리스크): 하루에 몇 시간 동안 로봇을 작동하는 고급 트레이더를 위한 것입니다. 이 설정은 3~4시간 후에 EA를 비활성화하는 사람들에게 적합합니다. 중요한 USD 및 BTC
Scalping Signal NO Repaint NO Lag
Martin Alejandro Bamonte
5 (1)
"Scalping Signal No Repaint No Lag"는 어떤 차트에 드래그하더라도 템플릿이나 다른 지표를 로드할 필요 없이 자동으로 모든 필요한 지표를 로드하는 유일한 지표입니다. 제공된 이미지와 정확히 동일한 모습으로 차트를 자동으로 구성합니다. 이 지표는 재도색 없이 신호를 제공하므로 모든 통화 쌍과 시간대(TF)에서 스캘핑 전략에 이상적입니다. 기능 자동 지표 로딩 : 지표를 어떤 차트에 드래그하면 추가로 필요한 모든 지표가 자동으로 로드되고 설정된 선호도에 따라 차트가 구성됩니다. 원하면 설정에서 매개변수를 변경할 수 있습니다. 차트 시각화 : 일본 촛대 및 특정 색상을 사용하여 시각화를 개선하기 위해 차트 속성을 조정합니다. 배경 및 촛대 색상은 원하면 변경할 수 있습니다. 신호 생성 : 두 이동 평균 간의 차이와 RSI가 EMA와 교차하는 것을 사용하여 매수 및 매도 신호를 생성하며, 차트에 화살표로 표시됩니다. 추세 시각화 : 빠른 이동 평균과 느린 이동 평균
Candle Probability Scalper
Martin Alejandro Bamonte
Candle Probability Scalper 사용 가이드 이 지표는 스캘핑을 쉽고 100% 직관적으로 만듭니다. Candle Probability Scalper 는 실시간 으로 현재 캔들에서 매수자와 매도자의 강도 비율을 한눈에 보여줍니다. 비율은 각 틱마다 업데이트되므로, 매 순간 매수자와 매도자 대부분이 무엇을 하고 있는지 알 수 있으며, 지연이 없습니다. 이는 각 세력의 강도를 판단하거나 확인하고, 가격의 움직임을 예측하는 데 큰 도움이 됩니다. 다음은 사용 방법에 대한 명확한 가이드입니다: 1. M1의 매수자와 매도자 비율을 보고 다른 시간대(M5, M15)와 확인하십시오: M1에서 매수자 비율이 60% 이상 이고 M5 및 M15의 매수자 비율이 M1과 일치하여 60% 이상인 경우, 좋은 매수 신호 입니다. M1에서 매도자 비율이 60% 이상 이고 M5 및 M15의 매도자 비율이 M1과 일치하여 60% 이상인 경우, 좋은 매도 신호 입니다. 이것은 추세가 일시적인 것이
M1 Easy Scalper
Martin Alejandro Bamonte
M1 EASY SCALPER is a scalping indicator specifically designed for the 1-minute (M1) timeframe, compatible with any currency pair or instrument available on your MT4 terminal. Of course, it can also be used on any other timeframe, but it works exceptionally well on M1 (which is challenging!) for scalping. Note: if you're going to scalp, make sure you have an account suitable for it. Do not use Cent or Standard accounts as they have too much spread! (use ECN, RAW, or Zero Spread accounts) Robustn
Gold Vertex EA
Martin Alejandro Bamonte
Gold Vertex EA is a reliable and stable option for those looking to automate their trading in the gold market. With a robust system based on one of the most effective indicators and a solid trend-following strategy, Gold Vertex EA is a powerful tool for traders who want precise, worry-free trading. Requirements Platform : MetaTrader 4 Supported Instruments : Specifically developed and configured for Gold (XAUUSD) Recommended Account Type : ECN or low spread Minimum Deposit Recommended : $100 Tim
NextCandlePredictor No Repaint
Martin Alejandro Bamonte
NextCandlePredictor 지표 NextCandlePredictor는 다시 그리지 않으며, 색상이 변경되지 않고, 이동하지 않으며, 사라지지 않으며, 지연이 없는 알림이 있는 신호 지표입니다. 모든 타임프레임에서 다음 또는 다가오는 캔들의 방향을 식별하는 데 도움이 됩니다. 뉴욕, 런던 또는 둘 다 겹치는 고변동성 시장에 매우 권장됩니다. 주요 기능: 타임프레임의 유연성: M1에서 H1 이상까지 모든 타임프레임에서 빠르고 정확한 신호를 제공합니다. 명확한 매수/매도 신호: ADX의 DI+ 및 DI- 라인을 사용하여 명확한 매수 및 매도 신호를 생성하여 최고의 거래 결정을 내릴 수 있도록 합니다. 직관적인 시각화: 신호는 차트에 직접 녹색(매수) 및 빨간색(매도) 화살표로 표시되어 빠르고 쉽게 읽을 수 있습니다. 사용자 정의 가능한 설정: 분석할 막대 수와 경고 옵션을 선호도 및 거래 전략에 따라 조정합니다. 사용하려는 TF에 따른 제안표를 아래에서 확인하세요. 캔들 종료 시
Clear Breakout
Martin Alejandro Bamonte
5 (1)
"Breakout Buy-Sell" 지표는 다양한 시장 세션(도쿄, 런던, 뉴욕) 동안 가격 돌파를 기반으로 매수 및 매도 기회를 식별하고 강조하도록 설계되었습니다. 이 지표는 트레이더가 매수 및 매도 영역뿐만 아니라 이익 실현(TP) 및 손절매(SL) 수준을 명확하게 시각화하는 데 도움이 됩니다. 사용 전략 이 지표는 다음과 같이 사용할 수 있습니다: 초기 설정 : 시장 세션을 선택하고 GMT 오프셋을 조정합니다. 시장 시각화 : 각 세션 시작 시 그려지는 돌파 상자를 관찰합니다. 이러한 상자는 기간의 최고점과 최저점을 나타냅니다. 매수 및 매도 신호 : 상자의 최고점을 초과하는 돌파는 매수 신호로 간주됩니다. 최저점을 밑도는 돌파는 매도 신호로 간주됩니다. 위험 관리 : TP1, TP2, TP3 및 SL 수준을 사용하여 포지션을 관리합니다. TP 수준은 다양한 수익 목표를 위해 설계되었으며 SL은 불리한 움직임으로부터 보호를 보장합니다. 적용 전략 이 지표를 최대한 활용하기 위해
GbpUsd Pip Hunter EA
Martin Alejandro Bamonte
GBPUSD Pip Hunter EA 주요 기능: M15 시간 프레임에 최적화된 GBPUSD: 15분 차트에서 GBPUSD 페어에 맞게 설계되고 테스트되었습니다. 최소 권장 계좌 크기: 낮은 드로우다운을 보장하기 위해 최소 $1000의 계좌 잔액이 필요합니다. 스프레드 호환성: 수익성을 최대화하기 위해 저스프레드 또는 ECN 계좌에서 사용하는 것이 좋습니다. 위험 관리: 지수 로트 기능을 1.0으로 설정하여 비활성화할 수 있는 옵션을 포함하여 거래 요구에 맞게 조정할 수 있습니다. 맞춤형 매개변수: 사용자가 EA를 자신의 거래 스타일과 위험 허용 범위에 맞게 조정할 수 있도록 다양한 조정 가능한 매개변수를 제공합니다. GBPUSD Pip Hunter EA의 매개변수 설명 MM (자금 관리 토글) 설명: 자금 관리 기능을 활성화하거나 비활성화하기 위한 토글 스위치입니다. 옵션: 아니요: 자금 관리를 비활성화합니다. 예: 자금 관리를 활성화합니다. MMType 설명: 사용 중인 자금 관
Multi Timeframe Moving Averages
Martin Alejandro Bamonte
MTFMA(멀티 타임프레임 이동 평균선) 지표는 여러 시간대의 여러 이동 평균선(MA)을 사용하여 주 차트와 별도의 창에서 매수 및 매도 신호(재도색하지 않음)를 제공합니다. 이 지표는 다용도이며 해석하기 쉬워 작은 시간대의 스캘핑과 큰 시간대의 장기 거래 모두에 적합합니다. 왜 멀티프레임인가요? 멀티프레임이라는 용어는 지표가 여러 시간대의 데이터를 사용하고 결합할 수 있는 능력을 나타냅니다. MTFMA는 네 개의 구성 가능한 이동 평균선(MA)에 기반하여 신호를 계산하고 표시합니다. 각 MA는 다른 기간, 계산 방법 및 가격 유형에 맞게 조정할 수 있어 트레이더가 하나의 차트에서 단기 및 장기 트렌드의 조합을 볼 수 있도록 합니다. 중요 포인트: 다용도성: 분 단위부터 월 단위까지 모든 시간대에 사용 가능하며, 스캘핑과 장기 거래 모두에 적합합니다. 재도색하지 않음: 한 번 신호(위쪽 또는 아래쪽 화살표)가 생성되면 색상이 변하지 않아 트레이더가 생성된 신호를 신뢰하고 거래 결정을
"MultiSymbol & TF Chart Integrated" 지표는 단일 차트(다중 모드)에서 최대 60개의 통화 쌍을 선호하는 시간대에 따라 모니터링하거나 모든 TF에서 거래 중인 통화 쌍을 볼 수 있도록 빠르게 포괄적인 시장 전망을 제공하도록 설계되었습니다(단순 모드). 주요 장점: 완전 모니터링: 단일 차트에서 모든 원하는 쌍을 한 눈에 실시간으로 모니터링할 수 있습니다. 시간 절약: 차트 간 전환 필요 없이 각 쌍의 행동을 실시간으로 확인할 수 있습니다. 추세 분석: 추세를 따르는 트레이더에게 적합하며, 결정하기 전에 추세를 확인하기 위해 상위 시간대를 볼 수 있습니다. 극한 사용자 정의: 지표의 모든 측면을 특정 요구에 맞게 조정합니다. 극한 사용자 정의: 높은 구성 가능성 지표 매개변수: 심볼 및 시간대: 최대 60개의 다른 심볼을 구성할 수 있습니다. 각 심볼은 고유한 시간대를 가질 수 있습니다(예: M1, M5, M15, M30, H1, H4, D1, W1, MN
Pairs and TF Changer
Martin Alejandro Bamonte
여러 차트를 전환하며 다양한 통화 쌍과 시간 프레임을 모니터링하는 것에 지치셨나요? Pairs and TF Changer 지표가 거래 경험을 혁신합니다! 모든 전략 지표를 로드한 후 Pairs and TF Changer 를 차트에 추가하십시오. 필요에 따라 위치, 색상 또는 표시할 열 수를 조정할 수 있습니다! 주요 기능: 원활한 통합: 이 지표를 거래 전략에 쉽게 통합하십시오. 클릭 한 번으로 단일 차트에서 모든 통화 쌍과 시간 프레임을 거래하십시오. 추가 차트를 전환하거나 열 필요가 없습니다. 높은 맞춤화 가능: 차트의 어느 위치에든 위치를 조정하십시오 (위, 아래, 왼쪽, 오른쪽). 1열 또는 10열의 버튼을 표시하도록 설정하십시오. 거래 테마에 맞게 색상을 맞춤화하십시오. 차트를 깔끔하고 정돈되게 유지하기 위해 버튼을 투명하게 만드십시오. 보편적 호환성: 모든 유형의 지표 및 전략과 호환됩니다. Forex, 금속, 미국 주식, 지수, 석유, 선물 및 암호화폐를 포함한 모든 심
GO Trend MultiTimeFrame
Martin Alejandro Bamonte
GoTrend Multi-Timeframe 지표 "GoTrend Multi-Timeframe" 지표는 여러 시간 프레임에서 통화쌍의 전체 및 특정 추세를 빠르고 효율적으로 평가하려는 트레이더에게 필수적인 도구입니다. 이 지표는 트레이더가 시장 방향에 대한 명확하고 포괄적인 시각을 한눈에 얻을 수 있도록 하여 의사 결정을 최적화하고 거래 전략의 효과를 높일 수 있습니다. 주요 특징: 다중 시간 프레임 분석: 이 지표는 M5, M15, M30, H1, H4 및 D1의 여섯 가지 다른 시간 프레임에 대한 포괄적인 분석을 제공하여 트레이더가 각 기간의 추세를 이해할 수 있도록 합니다. 통합 기술 지표: 이 지표는 RSI, SAR, MA, MACD 및 ADX의 다섯 가지 강력한 기술 지표를 사용하여 각 시간 프레임에서 추세 방향을 결정합니다. 명확하고 직관적인 시각화: 신호는 직관적인 기호와 색상으로 메인 차트의 원하는 코너에 표시됩니다. 이를 통해 트레이더는 시장 상황을 한눈에 평가할 수
Inferno Signals EA
Martin Alejandro Bamonte
Inferno Signals EA는 중요한 시장 움직임을 활용하기 위해 설계되었으며, 안정적인 M30 타임프레임에서 작동합니다. 이 EA는 적은 초기 투자로 시작하고자 하는 사람들에게 이상적이며, 각 통화쌍당 최소 $100로 시작할 수 있습니다. 자동 자금 관리 기능이 포함되어 있어 동적 로트 조정 및 손절매(SL)와 같은 안전 기능을 제공합니다. 낮은 드로우다운과 최고의 기회를 포착하는 전략을 통해 Inferno Signals EA는 투자 안전성을 희생하지 않고 수익을 극대화하는 것을 목표로 합니다. 이 EA는 과도한 거래를 피하고 특정 구역에서만 거래를 오픈하며, 강한 추세의 연속과 잠재적인 반전 지점을 모두 감지합니다. 가격이 최적의 영역에 있을 때, Inferno Signals EA는 일관되게 거래를 진행하고, 명확한 기회가 없을 때는 대기 상태를 유지합니다. EA 작동 방식: EA는 Buy Stop 및 Sell Stop과 같은 보류 주문을 사용하며, 이는 필요에 따라 BUY
MarketPrice Indicator
Martin Alejandro Bamonte
The MarketPrice Indicator is designed to provide a quick, one-glance visualization of the trend direction for a currency pair across all time frames (Time Frames), streamlining decision-making. MarketPrice Indicator is based on daily levels and trading signals derived from moving average crossovers and market strength according to various technical indicators. It comes fully configured, though you can, of course, modify any parameters as desired. Indicator Logic The indicator uses a combination
Last 50 Pips
Martin Alejandro Bamonte
Last 50 Pips 지표는 최근 가격 움직임을 기반으로 매수 및 매도 기회를 빠르게 식별하도록 설계되었습니다. 최근 캔들의 가격 변화를 측정하여 가격이 방향을 바꿀 수 있는 순간을 노란색으로 강조 표시합니다. 매수 신호: 지표가 빨간색 에서 노란색 으로 변경될 때 매수 포지션을 열어야 합니다. 이는 하락세에서 상승세로의 전환을 암시합니다. 얼마나 쉬운지 확인하려면 이미지를 참조하세요. 매도 신호: 지표가 녹색 에서 노란색 으로 변경될 때 매도 포지션을 열어야 합니다. 이는 상승세에서 하락세로의 전환 가능성을 나타냅니다. 알림: 이 지표는 또한 사용자에게 모든 기기에서 차트의 새로운 신호에 신속하게 반응할 수 있도록 소리, 이메일 또는 푸시 알림을 통한 실시간 알림을 받을 수 있는 옵션을 제공합니다. 질문이 있으면 언제든지 저에게 연락하세요 :)
FlashPoints Breakout
Martin Alejandro Bamonte
매일 시장이 시작될 때, Flashpoints Breakout 은 이전 날의 데이터(고가, 저가, 종가)를 사용하여 피벗, 지지 및 저항 수준을 검토하고 두 개의 돌파 수준(상승 및 하락)을 계산합니다. 이렇게 하면 아침에 새로운 진입 수준과 Take Profit (TP) 및 Stop Loss (SL) 값을 바로 준비할 수 있어 추가 계산 없이 매수 스톱 또는 매도 스톱 주문을 걸 수 있습니다. Flashpoints Breakout 을 사용하면 매일 예상되는 돌파 수준에 따라 매수 스톱 주문 1~2개와 매도 스톱 주문 1~2개를 설정하여 기회를 놓치지 않도록 할 수 있습니다. 상단의 데이터 패널을 확인하고 매수와 매도를 각각 하나 또는 두 개씩 설정하십시오. 패널에서 정확한 진입 값, SL 및 TP를 찾을 수 있으며, 차트에서 해당 값에 일치하는 선을 볼 수 있습니다 (이미지 참조). 1. 매수 작업 (BUY): 진입 1 "BUY" ==> 매수 영역에서: 주문 1: 매수 영역에서
Buy Sell Magic Signal
Martin Alejandro Bamonte
BUYSELLMAGIC is a non-repainting signal-type trading indicator designed to precisely detect entry points in the market.  Features Reliable and permanent signals : BUYSELLMAGIC signals are final once the candle closes, ensuring they will not be modified or removed from the chart. This gives you the confidence of working with an indicator that keeps its signals stable and trustworthy. Comprehensive alerts : In addition to signals on the chart, you’ll receive notifications via email, pop-up alerts
Automatic Fibonacci Pivots
Martin Alejandro Bamonte
Automatic Fibonacci Pivots automatically calculates pivot levels and support/resistance based on Fibonacci, clearly showing key reference points that indicate potential reversal or trend continuation zones, as well as buy and sell areas . Designed for traders seeking clarity on charts without having to recalculate and manually place Fibonacci levels each time. Once set up on your computer, it will send an alert to your phone when a potential buy/sell signal is issued, allowing you to trade direc
Trade Insights Display
Martin Alejandro Bamonte
Trade Insights Display is the ideal companion for traders who want to operate with clarity and precision. This indicator provides real-time access to critical account data, such as: Balance Equity Margin Spread Swap Remaining time for the current candle . These data points are essential, regardless of the strategy or other indicators you use. Having this indicator always visible allows you to quickly assess your account status, the swap for each pair (helping you avoid high-cost trades), and the
필터:
리뷰 없음
리뷰 답변