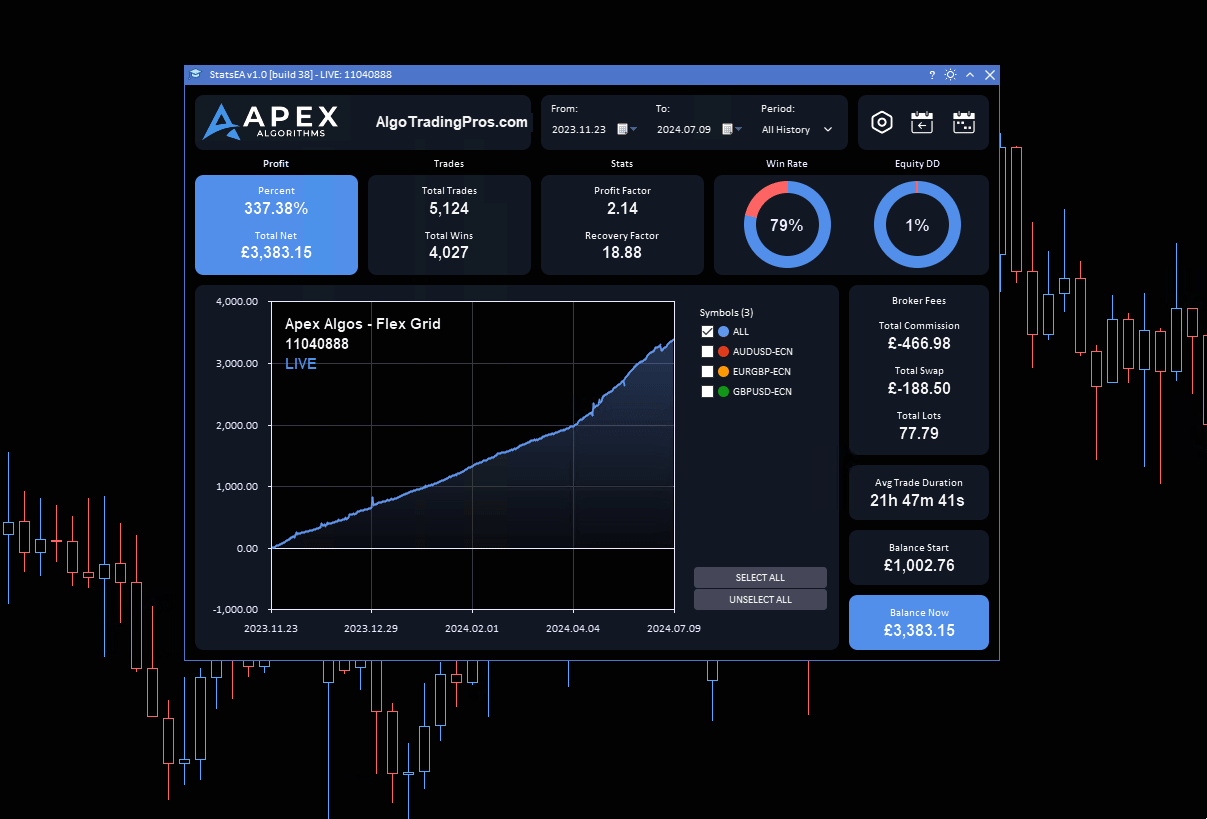
Stats Dashboard
- 유틸리티
- Apex Software Ltd
- 버전: 1.3
- 업데이트됨: 1 10월 2024
개요
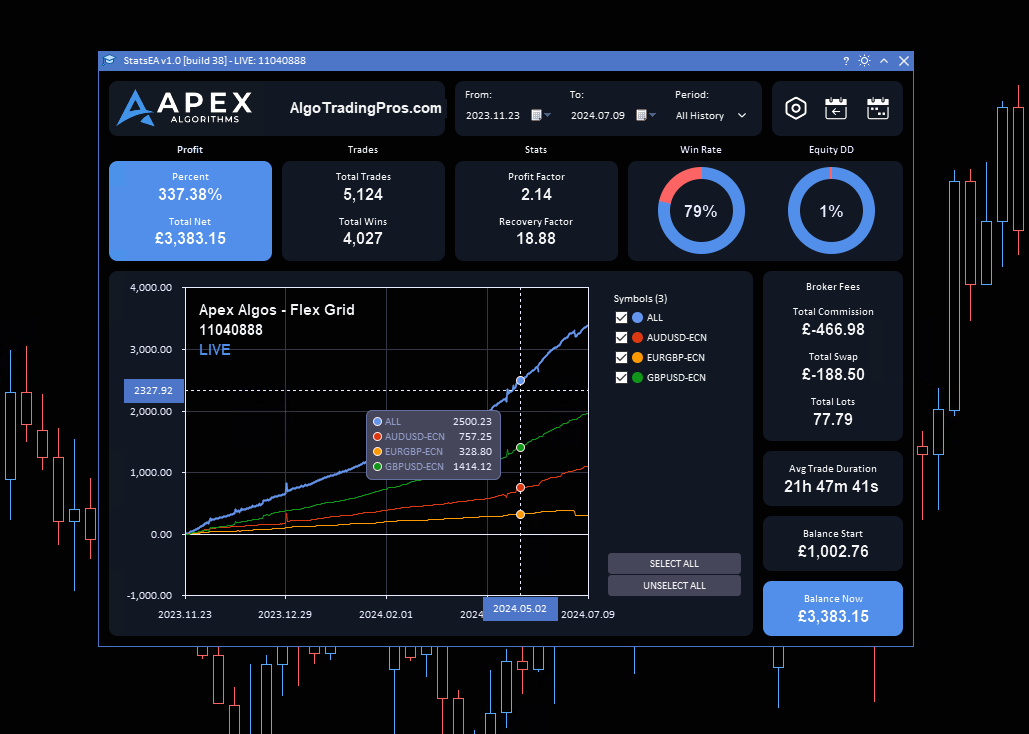
Stats Dashboard를 사용하여 트레이딩 성과를 추적, 분석하고 개선하세요. 일별, 주별, 월별, 맞춤형 등 다양한 기간 동안 주요 통계를 확인할 수 있습니다. 인터랙티브 라인 차트를 사용하여 성과가 좋은 도구와 나쁜 도구를 쉽게 식별할 수 있습니다.
EA는 전략 테스터에서 실행되지 않습니다. 무료 체험을 원하시면 메시지를 보내주세요.
표시되는 통계:
- 수익 - 수익 % 및 총 순수익 $
- 거래 - 총 거래 수 및 승리 수
- 통계 - 수익 계수 및 회복 계수
- 승률 %
- 드로우다운 - 자본 DD % 및 잔액 DD %
- 브로커 수수료 - 총 커미션 및 총 스왑 수수료
- 총 거래 로트 수 및 평균 거래 기간
- 시작 잔액 및 현재 잔액
주요 기능
- 상세한 수익 및 성과 지표
- 실시간 데이터 분석
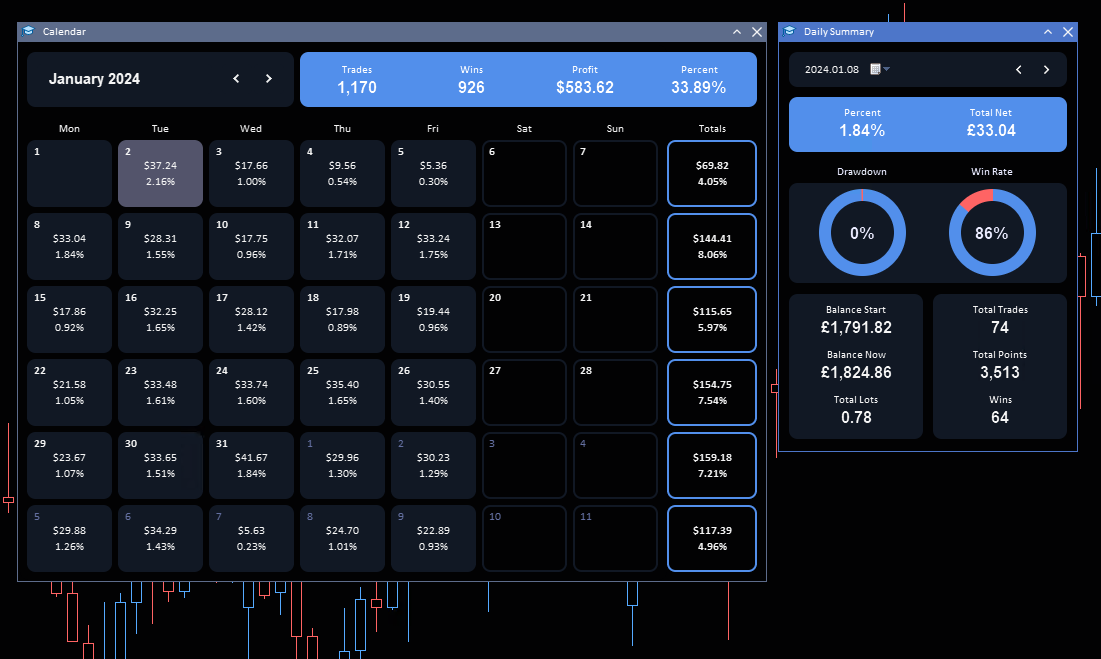
- 일일 요약 보고서
- 월간 캘린더 보기
- 특정 알고리즘으로 필터링 (매직 넘버)
실시간 데이터 분석
- 실시간 트레이딩 데이터에 접근: 최신 시장 움직임과 트레이딩 성과를 최신 상태로 유지하세요.
- 실시간 시장 분석을 기반으로 한 정보 기반 의사 결정: 최신 데이터를 활용하여 빠르고 정확한 트레이딩 결정을 내리세요.
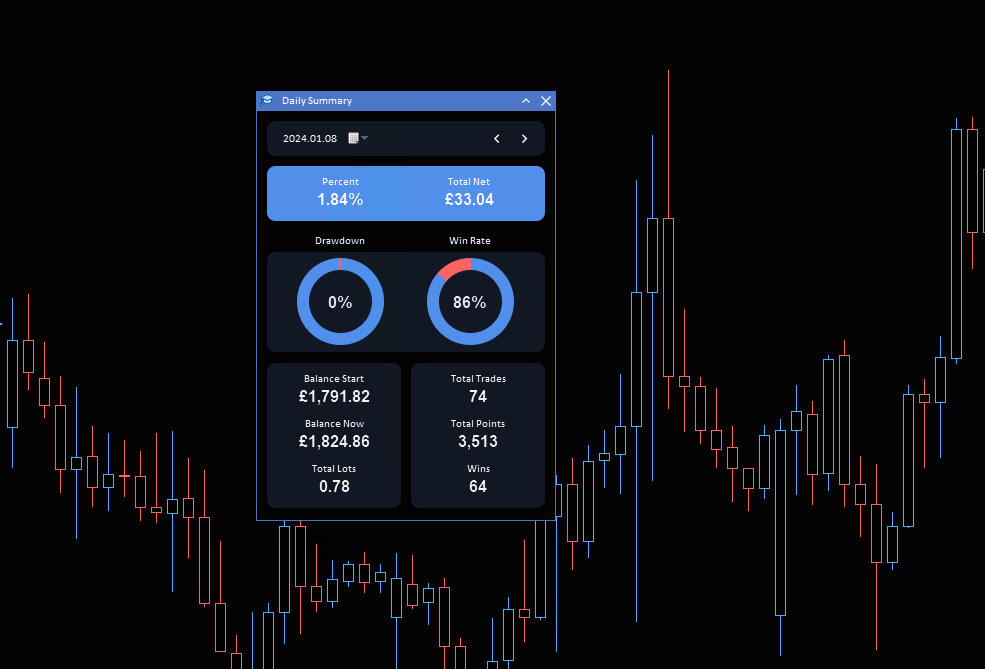
일일 요약 보고서
- 일일 성과 요약으로 최신 상태 유지: 목표와 일치하는지 확인하기 위해 일일 활동을 상세한 일일 보고서로 점검하세요.
- 포괄적인 지표: 총 거래 수, 승률, 수익 계수 등 주요 성과 지표를 추적하여 트레이딩 행동과 결과를 더 잘 이해하세요.
특정 알고리즘으로 필터링
- 매직 넘버를 사용하여 거래 필터링: 다양한 트레이딩 알고리즘 또는 전략의 성과를 개별적으로 평가하세요.
- 맞춤형 그래프 필터: 그래프에서 모든 거래 심볼로 데이터를 필터링하거나, 여러 심볼을 선택하거나, 특정 거래 페어에 집중하여 날짜 범위 내에서 데이터를 확인할 수 있습니다.
이 도구는 트레이딩 경험을 간소화하고 더 나은 성과를 달성할 수 있도록 설계되었습니다.


Sehr nützlich