Stats Dashboard
- ユーティリティ
- Apex Software Ltd
- バージョン: 1.3
- アップデート済み: 1 10月 2024
概要
Stats Dashboardを使用して、トレーディングパフォーマンスを追跡、分析、および向上させましょう。日次、週次、月次、カスタム期間など、さまざまな期間にわたる主要な統計を表示します。インタラクティブなラインチャートを使用して、最もパフォーマンスの良い、または悪い取引商品を簡単に特定できます。
EAはストラテジーテスターでは動作しません。無料トライアルをご希望の方はご連絡ください。
表示される統計:
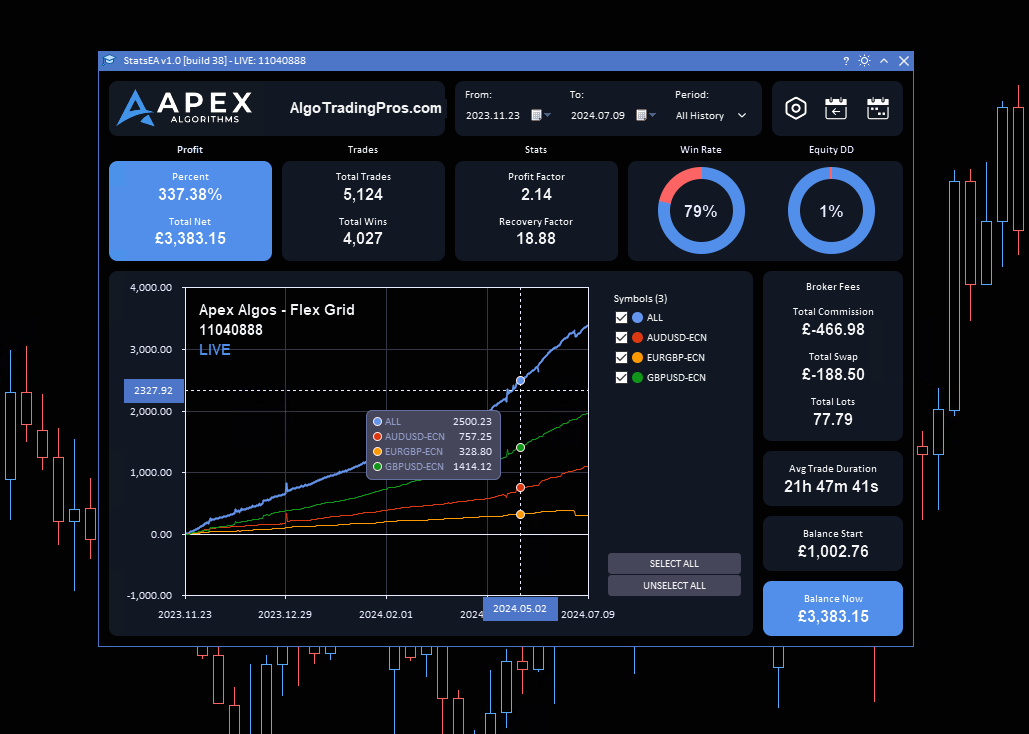
- 利益 - 利益率(%)および総純利益($)
- 取引 - 総取引数および勝率
- 統計 - 利益ファクターおよび回復ファクター
- 勝率 %
- ドローダウン - エクイティドローダウン %およびバランスドローダウン %
- ブローカーフィー - 総手数料および総スワップフィー
- 総取引ロット数および平均取引期間
- 初期バランスおよび現在のバランス
主な機能
- 詳細な利益とパフォーマンスのメトリクス
- リアルタイムデータ分析
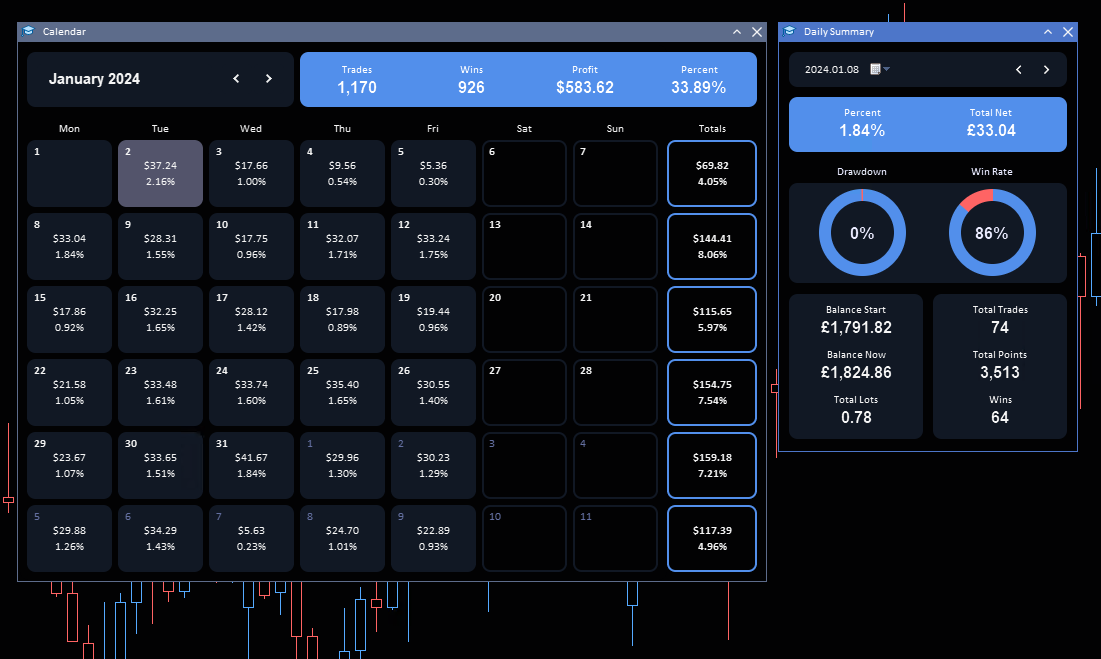
- 日次サマリーレポート
- 月次カレンダービュー
- 特定のアルゴリズムでフィルタリング(マジックナンバー)
リアルタイムデータ分析
- リアルタイムのトレーディングデータにアクセス: 最新の市場動向と取引パフォーマンスを把握しましょう。
- ライブ市場分析に基づいて判断: 最新のデータを活用して、迅速かつ正確な取引決定を下せます。
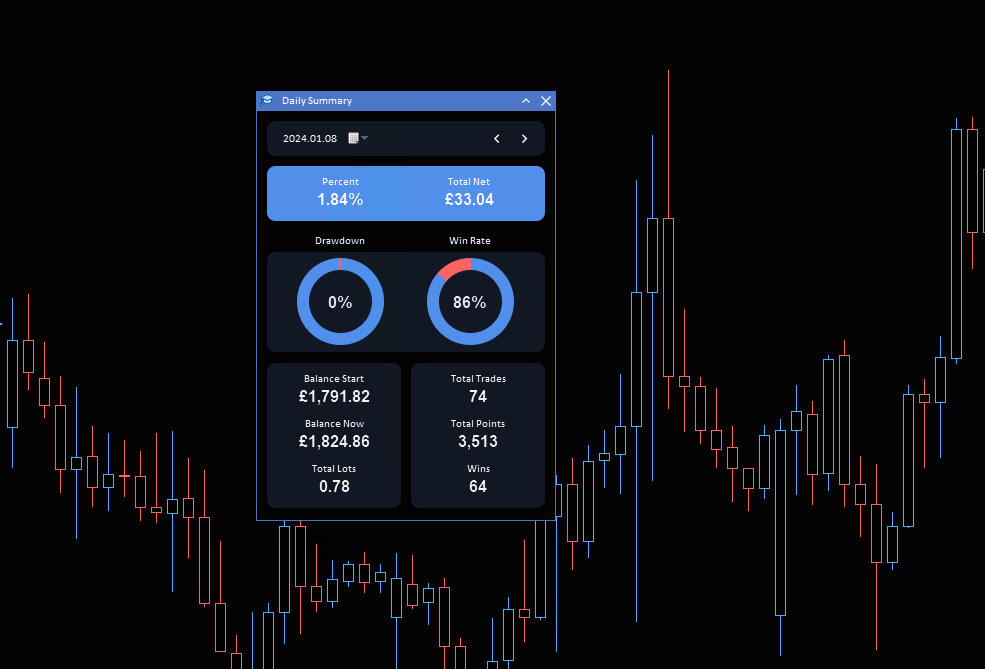
日次サマリーレポート
- 日々のパフォーマンスサマリーで更新される: 日次の活動を確認し、目標に沿っているか確認するために詳細な終日レポートを取得できます。
- 包括的なメトリクス: 総取引数、勝率、利益ファクターなどの主要なパフォーマンス指標を追跡し、取引行動と結果をよりよく理解します。
特定のアルゴリズムでフィルタリング
- マジックナンバーを使用して取引をフィルタリング: 異なるトレーディングアルゴリズムや戦略がどのようにパフォーマンスしているかを個別に評価します。
- カスタマイズ可能なグラフフィルター: グラフ上で、すべての取引シンボルをフィルタリングしたり、複数のシンボルを選択したり、特定の取引ペアに集中したり、任意の日付範囲でデータを確認できます。
このツールは、あなたのトレーディング体験をシンプルにし、より良い結果を達成するのを支援するために設計されています。


Sehr nützlich