Oil and gas deep correlation
- 지표
- GEORGIOS VERGAKIS
- 버전: 1.0
- 활성화: 5
This is a correlation hedge type indicator which helps trade the obscure relationship between crude oil and natural gas markets. Which is overall an unknown trading concept to most traders, yet a very impressive one.
The usual market risk is mittigated through the smooth trend of hedge tading, as well as the leading signals the indicator provides!
Pros: low risk trading, normal profits, no need to be right about either market
Cons: requires large capital
-----------------------------------------------------------------Overlooked Strategy-------------------------------------------------------------------------------------------
Important!: this indicator is for Pepperstone users only, due to wide spread unavailability of symbols, we were unable to make this indicator for all brokers, only Pepperstone worked, so only for Pepperstone mt4 accounts, you can cofirm it will work if you have such an account and the two markets are listed in the exact following format:
crude oil symbol: SpotCrude.r
gas symbol: NatGas.r
the indicator will not work in any other broker/ symbol format. There's no actual need to trade through Pepperstone! you only need a demo account or small live account from Peppeprstone, having these formats, and you can run the indicator on. You can do your actuall trading
through your own existing broker, no problem. Please note this is day to day slow trading and not day trading anyway.
We use Pepperstone ourselves to run the indicator, but we don't trade through them. For any specific modifications/customised version that you may require please contact me, to check if this is possible for your existing broker.
-------------------------------------------------Energy Market Trading Strategy-------------------------------------------------------------------
Crude oil and natural gas commodity prices are strongly interrelated, this is because these two commodities impact one another at a fundamental level.
For the purpose of commodity trading, we focus on trading one market against another, that is we always buy one while selling the other!
You may be temmpted to think that such trading would be pointless, since there wouldn't be any profit margin to profit from, but you'd be wrong.
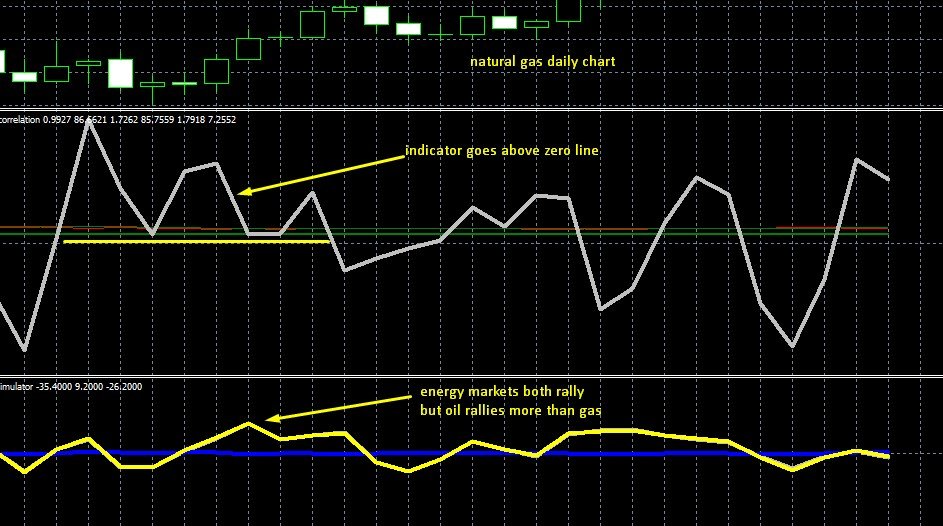
These two markets are ina strong positive correlation, however market dynamics continuously cause one of the two markets to temporarily lag behind the other, both in rallies as well as in declines. In a few days, the lagging market eventually catches up.
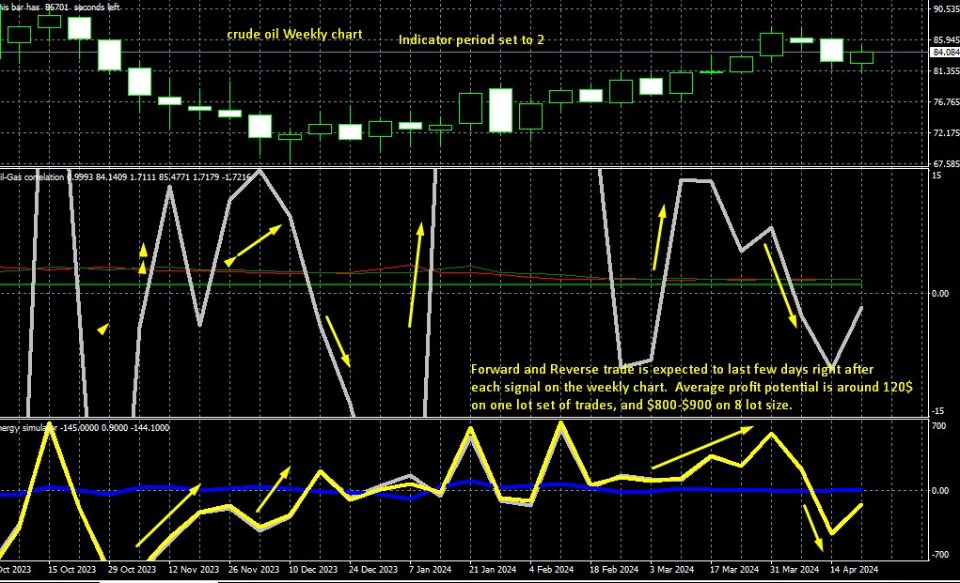
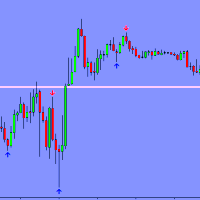
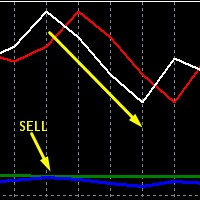
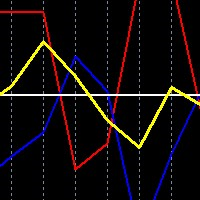
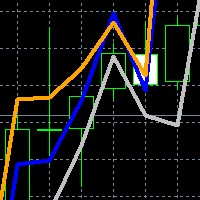
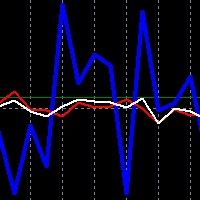
The indicator plots a line over 60 bars, the default period is 1, but we use 2 or higher. and up to a maximum of 9 sometimes.
In the examples we illustrate in the images we use period of 2.
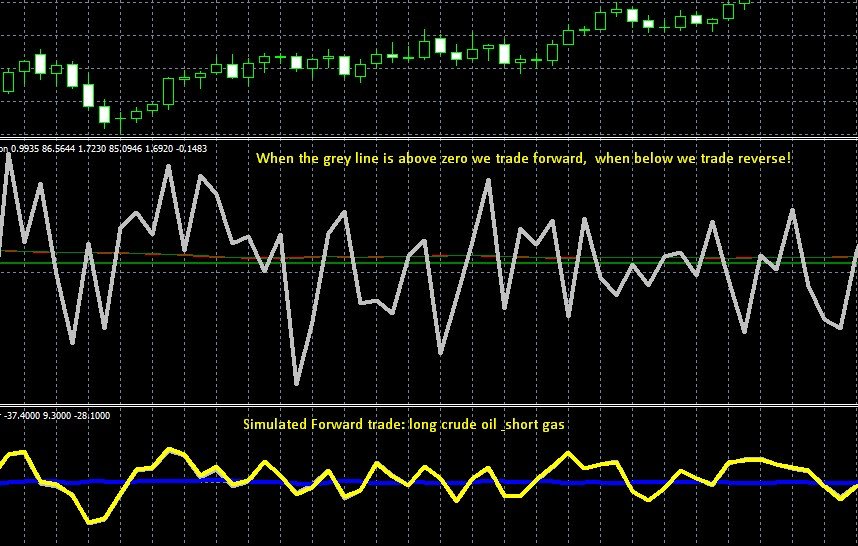
Forward trade: BUY OIL and SELL GAS
Reverse trade: SELL OIL and BUY GAS
Divergence and inevitable convergence!
The indicator helps see the big picture for the next few days, as opposted to random trading, where one can beomce caught out of synch in the overall lead-lag effect between the two markets.
The energy market in greater depth, why is gas and oil so interrelated? oil and gas are related to one another as in many cases, where they are used as fuels, one can replace the other. Also in the petrochemical and plastics industry natural gas can also replace crude oil in a wide number of applications. So it's not possible for the correlation to break apart.
#energy, #energy market, #oil, #gas, #commodity, #energy commodities, #hedging, #hidden pattern, #non bitcoin, #non crypto
# 能源套利

