• 미리보기
  • 리뷰
  • 코멘트

ATR Zone

ATR is an important indicator for any financial market. The abbreviation ATR stands for Average True Range. This indicator is a tool to determine the volatility of the market, this is its direct purpose. ATR shows the average price movement for the selected period of time.

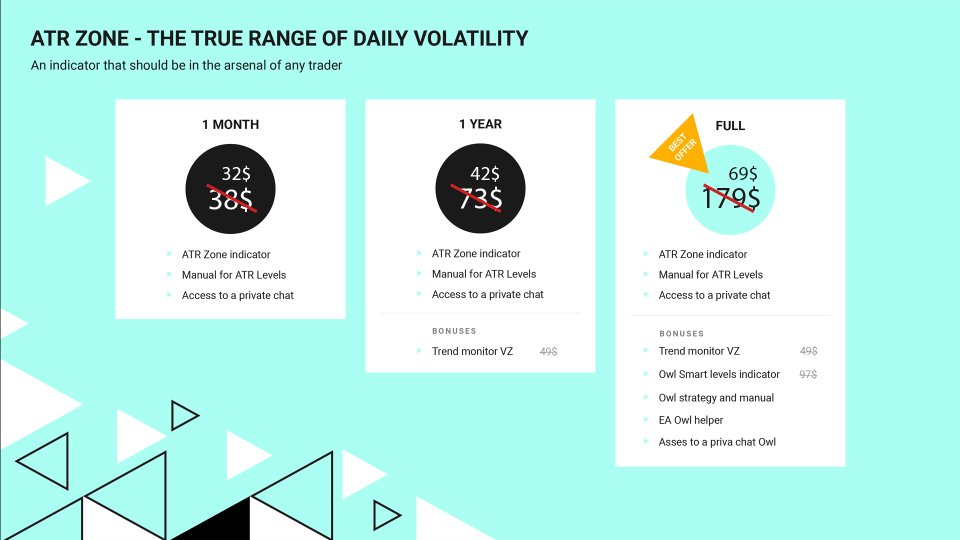
The initial price of the indicator is 63$. The price will increase every 10 sales up to 179$

The original ATR indicator is present in many trading programs. The ATR indicator is not very informative, so I modified its data and got the ATR Zone Indicator. The ATR Zone Indicator displays levels on the chart, which are more understandable and convenient for making trading decisions. In addition, I have added some important recommendations on calculating the indicator from trading guru Alexander Gerchik.

After purchase write me in private messages and you will receive:

  • A manual with detailed instructions for the indicator
  • Trend Monitor Indicator
  • Owl Smart Levels Indicator
  • Owl Helper Expert Advisor
  • Access to private user chat

How does the Indicator calculate?

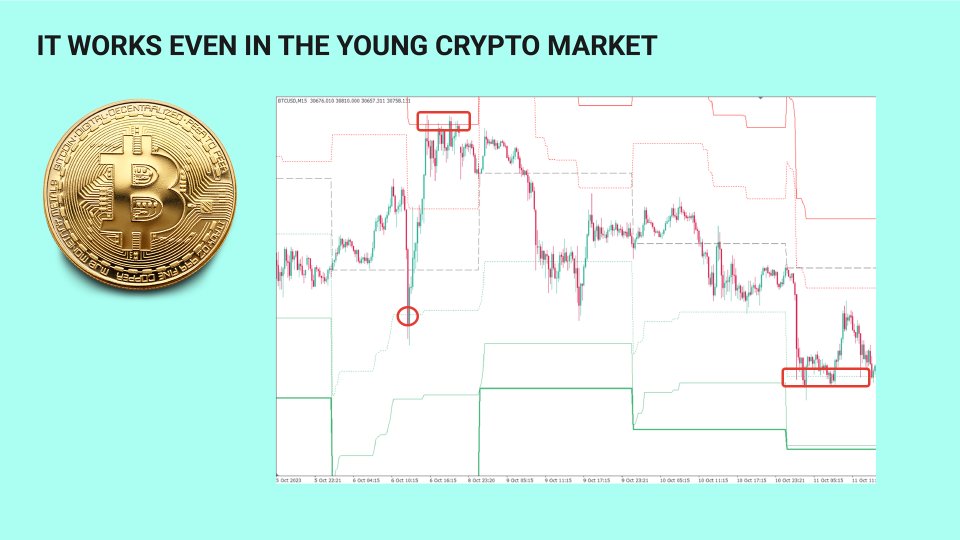
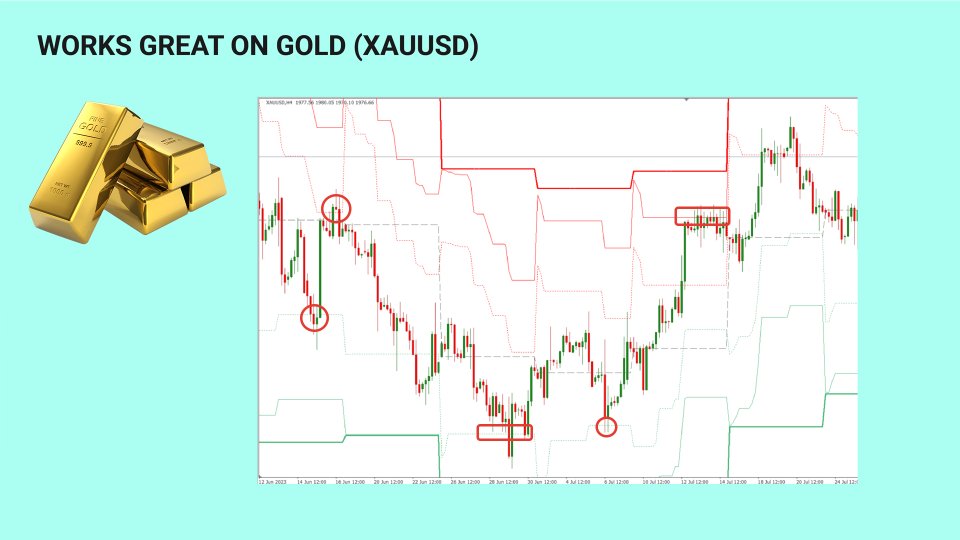
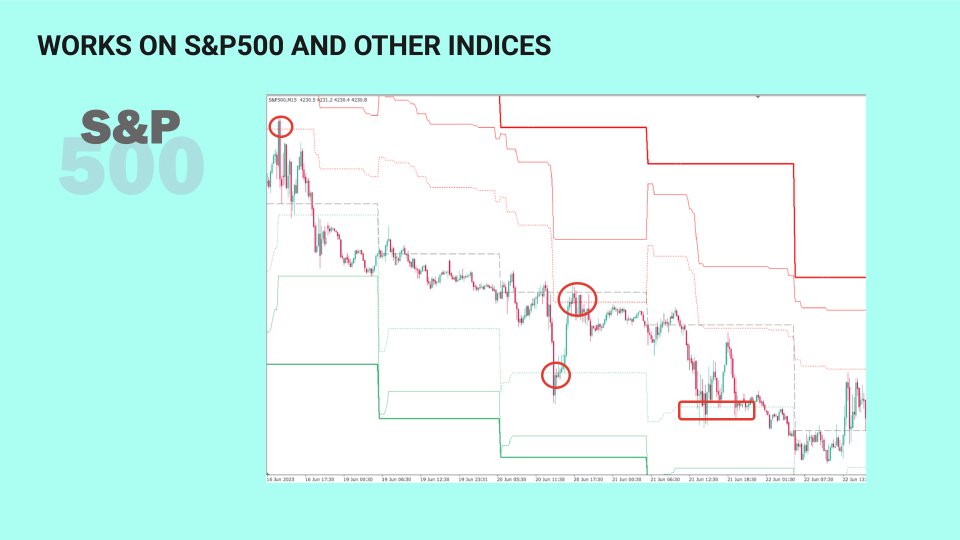
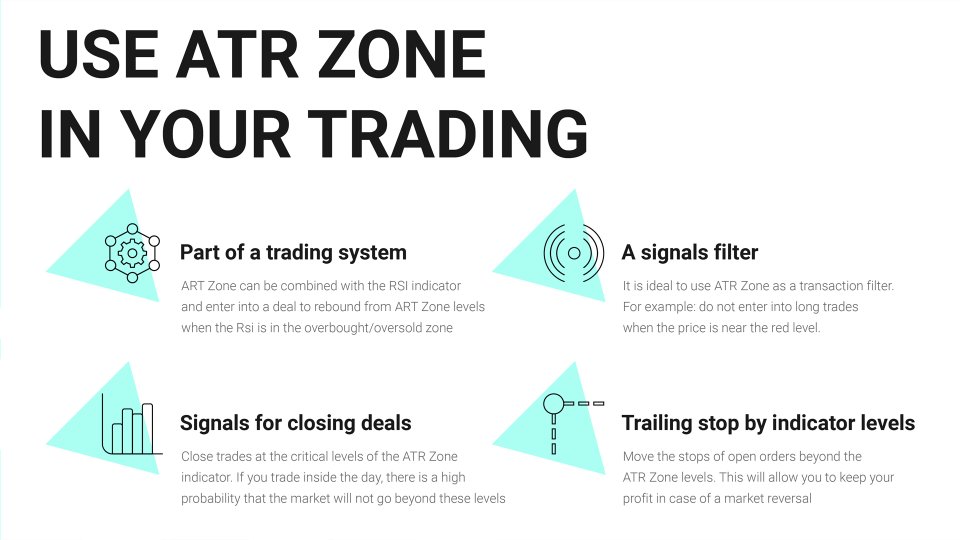
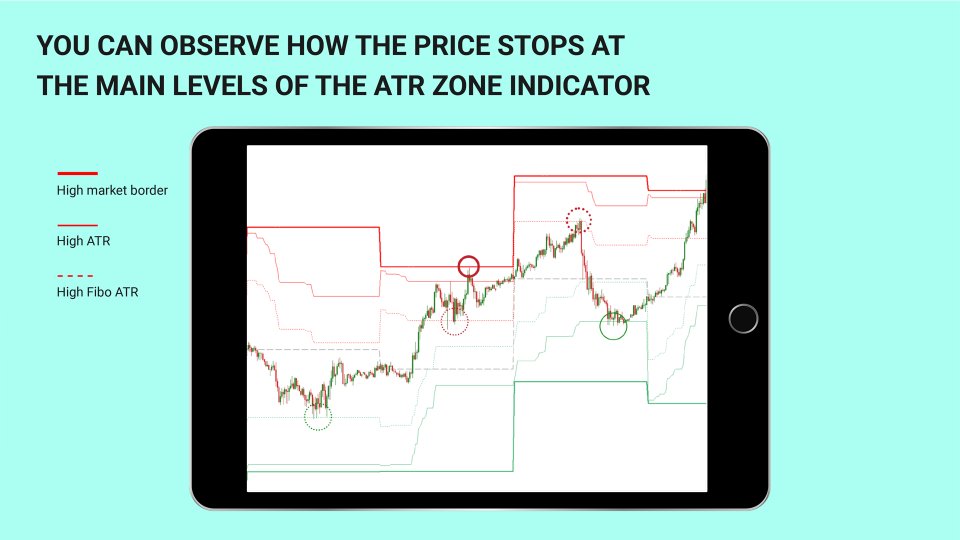
The most important indicator that we really need in intraday trading is the average daily price movement. Knowing the average daily price movement, we can set the limits (trading levels) on the chart, at which the market will lose energy. These levels are marked by the ATR Zone Indicator with bold red and green lines.

IMPORTANT!!! The ATR Zone Indicator calculates the average daily range of price movement (counts D1 candlesticks), and builds levels on a smaller timeframe.

So even on the timeframe M1, M5, M15, H1 you get the levels of the average daily range, which is more informative during intraday trading.

Earlier I talked about important additions to the indicator. Popular trader Alexander Gerchik recommends using the average value of the price movement for the last 5 days, but you should not take into account extremely large and extremely small daily bars. I listened to his recommendation and applied this rule in the ATR Zone Indicator.

Parameters of the ATR Zone Indicator. 

  • The beginning of the day - the beginning of the indicator countdown.

I think it is wrong to take the beginning of the countdown 00:00 hours of the current day. It is more correct to take the time of the beginning of the trading session in one of the trading zones as the starting point. In my trading I take the start time of the European trading session as the starting point.

  • ATR averaging period - number of days for calculating the average value of the daily price movement
  • Exclude the bar more - the coefficient of large bars, which excludes bars that are too large from the calculation of the average ATR value (value 2 means that bars, that are more than 2 times the average ATR, do not participate in the calculations).
  • Exclude smaller bars - the coefficient of small bars, which excludes bars that are too small from the calculation of the average ATR value (value 0.5 means that bars, that are less than 50% of the average ATR, do not participate in the calculation)
  • Fibo level - Fibonacci level for building additional levels (dotted levels)
  • The number of bars to calculate - number of bars to the left to display on the chart


I'm Sergey Ermolov, subscribe to my updates!


추천 제품
Marker Bands
Ramon Sobrevals Arce
4 (1)
This indicator consists in two different algorithms, in order to profit all fast movements created during noises of the market. First of all, it plots normalized trend bands to can filter the possible trades. The normalized trend bands are calcualted using an exclusive mathematical algorithm to has both the correct trend and the fast adaptability to the change of trends. With those bands you can know when you are inside the trend, or when you are outside. The second alhorithm uses a private
Warning: Our product works with 28 symbols. The average accuracy level of the signals is 99%. We see signals below 15 pips as unsuccessful. Technique Signal   indicator is designed for signal trading. This indicator generates trend signals. It uses many algorithms and indicators to generate this signal. It tries to generate a signal from the points with the highest trend potential. This indicator is a complete trading product. This indicator does not need any additional indicators. The
The  Laguerre VIX Trend Extrema   (LVTE)  indicator detects market tops and bottoms. As its name suggests, LVTE is a percentage price oscillator that identifies extreme ranges in market price. How to use:   Buy   when the indicator was in the lower "blue" range for more than 2 candles, and then moves up into grey.   Sell   when the indicator was in the upper "red" range, and then moves down into orange. Please see screenshots for examples! To make it simple, the indicator can show this by paint
Others
Tatiana Savkevych
The Others indicator is a trend-type indicator. In those moments when you need to make a decision to enter a position and give the trader a direction. The indicator gives the trader the opportunity to visually determine which trend will be present at a particular time interval. These are auxiliary tools for technical analysis of the market. Recommended for use in conjunction with any of the oscillators. The main application of the Others indicator is to generate buy and sell signals. Determin
In the context of trading,   Malaysia SNR   (Support and Resistance) refers to the technical analysis of   support and resistance levels   in financial markets, particularly for stocks, indices, or other assets traded. There are three type of Malaysia SNR level Classic , GAP and Flipped 1. Classic Support   is the price level at which an asset tends to stop falling and may start to rebound. It acts as a "floor" where demand is strong enough to prevent the price from dropping further. Resistance
The indicator allows for quick identification of price reversals by promptly reacting to price impulses and indicating the beginning of a price reversal. The histogram demonstrates the direction of movement and identifies favorable moments for opening positions. It is recommended for use in swing trading and can be applied to any currency pairs, metals, and cryptocurrencies. It is also suitable for binary options trading. Key Features Rapidly identifies changes in the local trend Works on all t
PRO Fibonacci Tool MT4
Samil Bozuyuk
5 (1)
The indicator is the advanced form of the MetaTrader 4 standard Fibonacci tool. It is unique and very reasonable for serious Fibonacci traders. Key Features Drawing of Fibonacci retracement and expansion levels in a few seconds by using hotkeys. Auto adjusting of retracement levels once the market makes new highs/lows. Ability to edit/remove any retracement & expansion levels on chart. Auto snap to exact high and low of bars while plotting on chart. Getting very clear charts even though many ret
Indicator for determining adjustments and price reversals It gives signals for inputs and shows the general direction of the price movement. Allows you to conduct trend and counter trend trading It works on all timeframes, on any currency pairs, metals and cryptocurrency Can be used when working with binary options Distinctive features Does not redraw; Thanks to simple settings, you can quickly adapt to any trading instrument; It works on all timeframes and on all symbols; Suitable for trading c
SuperRSI
Andriy Sydoruk
The SuperRSI indicator is an advanced index of internal strength. The indicator shows not the relative strength of the trading instruments being compared, but the internal strength of a single instrument, therefore, it is the “Internal Strength Index”. This is an advanced form of the SuperRSI indicator. It converts the signal so that low-frequency components are delayed much more than high-frequency components. In general, the data of the last bar have more weight than previous data, like an exp
The indicator is the advanced form of the MetaTrader 4 standard Fibonacci tool. It is unique and very reasonable for serious Fibonacci traders. Key Features Drawing of Fibonacci retracement and expansion levels in a few seconds by using hotkeys. Auto adjusting of retracement levels once the market makes new highs/lows. Ability to edit/remove any retracement & expansion levels on chart. Auto snap to exact high and low of bars while plotting on chart. Getting very clear charts even though man
Rsi Regression Channel
Philip Pankaj Suthagar
5 (2)
In statistics, Regression Channel is a approach for modelling the relationship between a scalar response (or dependent variable) and one or more explanatory variables (or independent variables).We Applied relative strength index(rsi) values to develop regression models of various degrees in order to understand relationship between Rsi and price movement.                        Our goal is range prediction and error reduction of Price divergence , thus we use Rsi Regression
Closing Average
Yaroslav Varankin
Closing average This is a completely new indicator in technical analysis. It is based solely on mathematical calculation. about signals It’s worth going into a buy transaction when the price has crossed the indicator line from bottom to top and it is under the price it is worth entering a deal on sell when the price is below the indicator line This author’s development, he doesn’t use any indicators of technical analysis in his analysis.
on free demo press zoom out button to see back.. cnt number is bar numbers.you can change up to 3000 related to chart bars numbers. minimum value is 500. there is g value set to 10000. no need to change it. this indicator almost grail,no repaint and all pairs ,all timeframe indicator. there is red and blue histograms. if gold x sign comes on red histogram that is sell signal. if blue x sign comes on blue histogram that is buy signal. this indicator on thise version works all pairs.al timeframe
MT4용 외환 지표 "HTF 봉투" MT4용 전문 HTF 봉투로 거래 방법을 업그레이드하세요. HTF는 - 더 높은 시간 프레임을 의미합니다. 봉투는 시장에서 가장 좋은 추세 지표 중 하나로, 거래에 완벽한 도구입니다. 이 지표는 거래자가 극단적인 매수 과다 및 매도 과다 조건과 거래 범위를 식별하는 데 사용됩니다. HTF 봉투 지표는 가격 액션 항목이 있는 다중 시간 프레임 거래 시스템이나 다른 지표와 함께 사용하기에 매우 좋습니다. 지표를 사용하면 더 높은 시간 프레임의 봉투를 현재 차트에 첨부할 수 있습니다. // 더 훌륭한 전문가 자문가와 지표는 여기에서 확인할 수 있습니다: https://www.mql5.com/en/users/def1380/seller 이 MQL5 웹사이트에서만 제공되는 오리지널 제품입니다.
VWap Bands EForex
Veridiana Adorno Kendrick
VWAP Bands Metatrader 4 Forex Indicator The VWAP Bands Metatrader 4 Forex indicator is a quite similar to the Bollinger bands, but it deploys volume weighted average as the core value of the bands. There is an option of using the tick volume or real volume for calculation when using the VWAP Bands Metatrader 5 custom forex indicator, especially when the forex broker displays symbol alongside real volume. Similarly, you can decide to have deviations calculated with the sample correction or not
XM Channel
Kaijun Wang
4 (1)
The market price usually falls between the borders of the channel . If the price is out of range, it is a trading signal or trading opportunity . Basically, Fit Channel can be used to help determine overbought and oversold conditions in the market. When the market price is close to the upper limit, the market is considered overbought (sell zone). Conversely, when the market price is close to the bottom range, the market is considered oversold (buy zone). However, the research can be used
Zig Zag reading structure
Maria Cristina Sabatini
'Zig Zag Percentage strenght'   This indicator is awesome. Why? It's able to show the percentage of the last leg, compared with the previous leg. In this way you have a better understanding of the forces in play in that moment.   In fact, for example, if you see that the up extensions are, in percentage, greater of the down legs, that means that there is more bullish pressure or maybe the market is starting to reverse from downtrend to uptrend.   Hope you will ind it useful !
Scanner and Dashboard for Money Flow Index for MT4 The Money Flow Index (MFI) is a technical oscillator that uses price and volume data for identifying overbought or oversold signals in an asset. It can also be used to spot divergences which warn of a trend change in price. The oscillator moves between 0 and 100. Advantages of the Scanner: - Full Alert Options. - Multi Timefrare  - Works for all instruments including Currencies, Indices, Commodities, Cryptocurrencies and Stocks. - Fully customis
OFFER!   OFFER ! After 3 weeks the unlimited price will be 500$ and in the future you will regret why you didn't make a purchase at this lowest price. Dear Traders, the atomic power Entries Indicator is one of the indicators that if used wisely and correctly can help you to find an edge over the market.  The indicator will work for all forex pairs, all markets and all timeframes. Still it is your duty to find the most effective timeframe for you. When the sell or buy arrow appears you will get a
Colored Volume
Seyed Ali Tabatabaei Lotfi
The Colored Volume is a simple, yet useful indicator that paints the color of the volume based on the price direction.  If the price has increased, the volume will be shown in green. If the price has decreased, the volume will be shown in red. This indicator will make it super easy for traders to track volume bars based on price movements. (The settings of the volume bars including line width and color can be manually changed by the trader.)
Volume Zone
Francis Dogbe
Volume Zone is a unique indicator that uses special algorithm to determine the volumes traded for the period. There are two features of the indicator, the volumes price and and volumes zone. The volume price give the level at the buyers and sells entered the market. The zones also serve a good support/resistance and also site for demand/supply areas. The indicator was mainly designed to trade GBPUSD but also be applied on other pairs. The indicator can used by both beginners and advance trades.
- Real price is 80$ - 40% Discount ( It is 49$ now ) Contact me for instruction, add group and any questions! Related Products:  Bitcoin Expert , Gold Expert Introduction The breakout and retest strategy is traded support and resistance levels. it involves price breaking through a previous level.  The break and retest strategy is designed to help traders do two main things, the first is to avoid false breakouts. Many false breakouts start with a candlestick that breaks out of a level but ends w
This indicator works on MT4 and is very easy to use. When you receive a signal from it, you wait for that candle with the signal to close and you enter your trade at the beginning of the next new candle . A red arrow means sell and a green arrow means buy. All arrows comes with Alert  like for easy identification of trade signal. Are you okay with that? 1 minute candle 1 minute expire
Valable ZigZag
Sergey Ermolov
4.5 (6)
MT5 버전  | Trend Monitor VZ 표시  |  Owl Smart Levels 표시   |  Owl Smart Levels 전략  |  FAQ 엘리엇 웨이브 이론은 가격 차트에 파도의 시각적 모델에 의존하는 금융 시장의 프로세스의 해석이다. 평가 가능한 지그재그 표시기는 시장의 파동 구조를 표시하며,이는 거래 결정을 내리는 데 사용할 수 있습니다. 평가 가능한 지그재그 표시등이 더 안정적이며 종종 고전적인 지그재그 표시와 같은 방향을 변경하지 않습니다,오해의 소지가있는 상인. 이 지표파의 건설에 도형의 사용을 통해 달성된다. Telegram 채팅:  @it_trader_chat 새로운 Expert Advisor Prop Master   - 트레이딩 터미널에서 테스트해보세요 https://www.mql5.com/ko/market/product/115375 평가 가능한 지그재그는 주로 추세 지표입니다. 그것은 상인이 거래해야하는 주요 방향을 설정하지만 시장 진입의 지표
FREE
The Best Choice compra y venta
Sandro Israel Hernandez Zamora
¿Has escuchado decir que la tendencia es tu amiga? pues nada es mas cierto en el mundo del trading. Este indicador analiza las tendencias y su fuerza para que puedas aprovecharlas y utilizamos un conjunto de indicadores como RSI, %W, MACD y EMAS para analizar el mercado y sus movimientos, por lo que podrás mantener tu gráfico limpio sabiendo que todos estos indicadores los tienes en uno solo. Este, como cualquier indicador, no representa una certeza de compra o venta definitiva, por lo siempre r
No idea why demo is not working. you can check the GIF to see how it works. Features With this scanner you can detect Candles which are below/above yesterday high/low lines. A pair's rectangle turns RED in dashboard if it is above the yesterday high, and rectangle turns GREEN in dashboard if it is below the yesterday low. It gives alerts in every 15m candle close. Contains a Dashboard which will help you to see all market pair's. It is possible to disable this sorting through to make it easie
Max Min logic formula
Maria Cristina Sabatini
Innovative Max Min swing   This is a really different indicator for drawing Max and Min on the charts.  This indicator draws Min and Max levels in a innovative way, based on a volatility proprietary calculation. In this way you will be able to draw trendlines in an objective way and also to see the break of Max and Min levels.  You have three paramaters you can play with, in order to suite the volatility to your trading style. The indicator works on every time frame. Added: - Sound Notification
Gunn Crosses
Iurii Tokman
Gunn Crosses   지원 및 저항 수준 표시기. 레벨은 Gann 스퀘어의 대각선 및 기본 십자가에 따라 계산됩니다. 계산은 현재 가격 또는 가격 설정에서 사용자가 지정한 가격을 기준으로 수행됩니다. 또한 계산에서 Digit 및 마이너스_znak 설정을 사용하여 가격 책정의 일부를 사용할 수 있습니다. 예: 현재 가격은 -1.23456이고   숫자 설정이 _5____로 설정되어 있으므로 계산에는 다음이 포함됩니다. 참여 번호 23456, _6____의 경우 숫자 123456이 됩니다. 대한   __4____ 수는 3456 것 ___3__의 경우 숫자는 456입니다. ____2__의 경우 숫자는 56입니다. 마이너스_znak 설정은 가격 책정 오른쪽에 있는 숫자를 제거합니다. 예:   Digit는   _5____로 설정되고   마이너스_znak은 _0으로 설정됩니다. 가격 책정 형식은 23456입니다. _1에서는 2345가 됩니다. _2에서 234가
Indicators 14 in 1
Makarii Gubaydullin
5 (1)
14 Indicators and auxiliary tools for convenient trading This utility contains 14 additional tools that can be useful for certain actions of the trader,   thereby simplifying and speeding up the trading process. My   #1 Utility : includes 65+ functions  |   Contact me  if you have any questions Due to the different monitor resolutions, some users may encounter the fact that the labels will be displayed with an overlay or be too small. If you encounter such a problem, you can adjust the font size
buy sell star indicator has a different algoritms then up down v6 and buy sell histogram indicators. so that i put this a another indicator on market. it is no repaint and all pairs and all time frame indicator. it need minimum 500 bars on charts. when  the white  x sign on the red histogram that is sell signals. when the white x sign on the blue  histogram that is sell signals. this indicator does not guarantie the win.price can make mowement on direction opposite the signals. this is multi tim
이 제품의 구매자들이 또한 구매함
Golden Trend Indicator
Noha Mohamed Fathy Younes Badr
5 (1)
Golden Trend indicator  is The best indicator for predicting trend movement this indicator never lags and never repaints and never back paints    and give  arrow buy and sell    before the candle appear  and it will help you and  will make your trading decisions clearer its work on all currencies and  gold and crypto and all time frame This unique  indicator uses very secret algorithms to catch the  trends, so you can trade using this indicator and see the trend clear on charts  manual guide and
FX Power MT4 NG
Daniel Stein
5 (14)
FX 파워 NG의 모든 기능을 활용하세요: 궁극의 통화 강도 측정기 FX Power는 8년 이상 전 세계 트레이더에게 믿을 수 있고 정확한 통화 강세 분석을 제공해 왔습니다. 이제 FX Power NG는 이 신뢰할 수 있는 도구를 한 단계 더 발전시켜 거래에 탁월한 정확성, 사용자 지정 및 통찰력을 제공하는 고급 기능을 제공합니다. FX Power NG가 진지한 트레이더에게 필수품인 이유는 무엇인가요? FX Power NG는 기존 FX Power에서 좋아했던 모든 기능을 기반으로 주요 기능을 추가하고 개선했습니다: 금 강도 분석(XAU): 이제 통화쌍과 함께 금의 강세를 추적하여 더욱 폭넓은 시장 인사이트를 얻을 수 있습니다. 정교한 계산: 모든 분석에서 더욱 정확하고 신뢰할 수 있는 결과를 경험하세요. 사용자 지정 가능한 분석 기간: 일중부터 장기 인사이트까지 트레이딩 전략에 맞게 분석 기간을 조정할 수 있습니다. 고급 다중 인스턴스 설정: 여러 인스턴스를 실행하여 종합적으
FX Volume
Daniel Stein
4.58 (33)
FX 볼륨으로 외환 거래에서 진정한 우위를 점하세요: 최고의 거래량 지표 FX 거래량은 내부자 관점에서 진정한 시장 심리를 보여주는 최초이자 유일한 거래량 지표입니다. FX 거래량은 기관 시장 참여자와 브로커의 포지션에 대한 고유한 인사이트를 제공함으로써 일반적으로 메이저 플레이어에게만 있는 선견지명을 가지고 거래할 수 있게 해줍니다. FX 볼륨은 차트에서 이 중요한 정보를 즉시 제공하므로 더 빠르고 현명한 트레이딩 결정을 내릴 수 있습니다. FX 볼륨이 트레이딩에 필수적인 이유 FX 거래량을 사용하면 고유한 시장 데이터에 비할 데 없이 접근할 수 있어 일반적인 거래량 지표가 제공하지 못하는 인사이트를 얻을 수 있습니다. 차트에서 직접 추적할 수 있는 항목은 다음과 같습니다: 포지션 비율: 통화별 롱/숏 포지션 비율을 확인하여 시장 심리를 명확하게 파악하세요. 비율 변화: 선택한 기간 동안 매수 포지션의 비율 변화를 확인하세요. 총 거래량: 통화별 총 거래량(매수 및 매도)을
TPSproTREND PrO
Roman Podpora
4.79 (19)
TPSpro TREND PRO는   시장을 자동으로 분석하여 추세와 각 변화에 대한 정보를 제공할 뿐만 아니라 다시 그리지 않고도 거래에 진입할 수 있는 신호를 제공하는 추세 지표입니다! 지표는 각 양초를 사용하여 개별적으로 분석합니다. 다른 임펄스를 언급합니다 - 업 또는 다운 임펄스. 통화, 암호화폐, 금속, 주식, 지수 거래의 정확한 진입점! 버전 MT5                   표시기에 대한 전체 설명       표시기   와 함께 사용하는 것이 좋습니다   -   RFI LEVELS 주요 기능: 렌더링 없이 정확한 입력 신호! 신호가 나타나면 관련성은 유지됩니다! 이는 신호를 제공한 후 변경하여 예금 자금 손실을 초래할 수 있는 다시 그리기 지표와의 중요한 차이점입니다. 이제 더 큰 확률과 정확도로 시장에 진입할 수 있습니다. 화살표가 나타난 후 목표에 도달(이익실현)하거나 반전 신호가 나타날 때까지 캔들을 색칠하는 기능도 있습니다. STOP LOSS / TAK
MetaBands M4
Vahidreza Heidar Gholami
5 (3)
MetaBands uses powerful and unique algorithms to draw channels and detect trends so that it can provide traders with potential points for entering and exiting trades. It’s a channel indicator plus a powerful trend indicator. It includes different types of channels which can be merged to create new channels simply by using the input parameters. MetaBands uses all types of alerts to notify users about market events. Features Supports most of the channel algorithms Powerful trend detection algorith
Atomic Analyst
Issam Kassas
5 (2)
우선적으로 언급할 점은이 거래 지표가 다시 그리지 않고 지연되지 않으며 이를 통해 수동 및 로봇 거래 모두에 이상적이라는 점입니다. 사용자 매뉴얼: 설정, 입력 및 전략. Atomic Analyst는 가격의 강도와 모멘텀을 활용하여 시장에서 더 나은 이점을 찾는 PA Price Action Indicator입니다. 고급 필터를 장착하여 잡음과 거짓 신호를 제거하고 거래 잠재력을 높이는 데 도움이 됩니다. 복잡한 지표의 다중 레이어를 사용하여 Atomic Analyst는 차트를 스캔하고 복잡한 수학적 계산을 간단한 신호와 색상으로 변환하여 초보 트레이더가 이해하고 일관된 거래 결정을 내릴 수 있도록합니다. "Atomic Analyst"는 새로운 및 경험이 풍부한 트레이더를위한 종합적인 거래 솔루션입니다. 프리미엄 지표와 최고 수준의 기능을 하나의 거래 전략에 결합하여 모든 종류의 트레이더에 대한 다재다능한 선택지가되었습니다. 인트라데이 거래 및 스캘핑 전략 : 빠르고 정확한
Quantum Breakout Indicator PRO
Bogdan Ion Puscasu
4.96 (26)
소개       Quantum Breakout PRO   , 브레이크아웃 존 거래 방식을 변화시키는 획기적인 MQL5 지표! 13년 이상의 거래 경험을 가진 숙련된 트레이더 팀이 개발한   Quantum Breakout PRO는   혁신적이고 역동적인 브레이크아웃 영역 전략으로 거래 여정을 새로운 차원으로 끌어올리도록 설계되었습니다. Quantum Breakout Indicator는 5개의 이익 목표 영역이 있는 브레이크아웃 영역의 신호 화살표와 브레이크아웃 상자를 기반으로 한 손절 제안을 제공합니다. 초보자 거래자와 전문 거래자 모두에게 적합합니다. Quantum EA 채널:       여기를 클릭하세요 MT5 버전 :   여기를 클릭하세요 중요한! 구매 후 설치 매뉴얼을 받으려면 개인 메시지를 보내주십시오. 추천: 기간: M15 통화쌍: GBPJPY, EURJPY, USDJPY,NZDUSD, XAUUSD 계정 유형: 스프레드가 매우 낮은 ECN, Ra
TrendMaestro
Stefano Frisetti
5 (3)
note: this indicator is for METATRADER4, if you want the version for METATRADER5 this is the link:  https://www.mql5.com/it/market/product/108106 TRENDMAESTRO ver 2.4 TRENDMAESTRO recognizes a new TREND in the bud, he never makes mistakes. The certainty of identifying a new TREND is priceless. DESCRIPTION TRENDMAESTRO identifies a new TREND in the bud, this indicator examines the volatility, volumes and momentum to identify the moment in which there is an explosion of one or more of these data a
Dynamic Forex28 Navigator
Bernhard Schweigert
5 (2)
Dynamic Forex28 Navigator - 차세대 외환 거래 도구. 현재 49% 할인. Dynamic Forex28 Navigator는 오랫동안 인기 있는 지표의 진화형으로, 세 가지의 힘을 하나로 결합했습니다. 고급 통화 Strength28 지표(695개 리뷰) + 고급 통화 IMPULSE with ALERT(520개 리뷰) + CS28 콤보 신호(보너스). 지표에 대한 자세한 정보 https://www.mql5.com/en/blogs/post/758844 차세대 Strength 지표는 무엇을 제공합니까?  원래 지표에서 좋아했던 모든 것이 새로운 기능과 더 높은 정확도로 강화되었습니다. 주요 기능: 독점적인 통화 Strength 공식.  모든 시간대에 걸쳐 부드럽고 정확한 강도선. 추세와 정확한 진입을 식별하는 데 이상적입니다. 역동적인 시장 피보나치 수준(시장 피보나치).  이 지표에만 있는 고유한 기능. 가격 차트가 아닌 통화 강도에 피보나치가 적용
Scalper Inside PRO
Alexey Minkov
4.73 (56)
An exclusive indicator that utilizes an innovative algorithm to swiftly and accurately determine the market trend. The indicator automatically calculates opening, closing, and profit levels, providing detailed trading statistics. With these features, you can choose the most appropriate trading instrument for the current market conditions. Additionally, you can easily integrate your own arrow indicators into Scalper Inside Pro to quickly evaluate their statistics and profitability. Scalper Inside
현재 20% 할인 ! 초보자 또는 전문가 트레이더를 위한 최고의 솔루션! 이 대시보드 소프트웨어는 28개의 통화 쌍에서 작동합니다. 2가지 주요 지표(Advanced Currency Strength 28 및 Advanced Currency Impulse)를 기반으로 합니다. 전체 Forex 시장에 대한 훌륭한 개요를 제공합니다. 고급 통화 강도 값, 통화 이동 속도 및 모든(9) 시간대의 28 Forex 쌍에 대한 신호를 보여줍니다. 추세 및/또는 스캘핑 기회를 정확히 파악하기 위해 차트의 단일 지표를 사용하여 전체 시장을 볼 수 있을 때 거래가 어떻게 개선될지 상상해 보십시오! 잠재적인 거래를 식별하고 확인하면서 강력한 통화와 약한 통화를 더욱 쉽게 식별할 수 있도록 이 지표에 기능을 내장했습니다. 이 표시기는 통화의 강세 또는 약세가 증가 또는 감소하는지 여부와 모든 시간대에서 수행되는 방식을 그래픽으로 보여줍니다. 추가된 새로운 기능은 현재 시장 조건 변화에 적
TakePropips Donchian Trend Pro
Eric John Pajarillaga Aldana
4.44 (16)
TakePropips Donchian Trend Pro   (MT4)는 Donchian 채널을 사용하여 추세의 방향을 자동으로 감지하고 진입 및 퇴장 거래 신호를 제공하는 강력하고 효과적인 도구입니다! 이 다기능 지표에는 추세 스캐너, 거래 신호, 통계 패널, 스크리너, 거래 세션 및 경고 내역 대시보드가 포함됩니다. 거래 신호를 제공하고 차트 분석 시간을 절약하도록 설계되었습니다! 다음 블로그 게시물에서 사용자 설명서 및 설치 가이드를 다운로드할 수 있습니다.   https://www.mql5.com/en/blogs/post/751368 오늘 50% 할인을 받으세요! 가격이 $98에서 $49로 인하되었습니다! 전략 테스터에서 이 지표를 테스트할 수 있습니다(비주얼 모드 활성화).  자세한 내용은 설명 아래에 비디오 자습서도 제공됩니다. 질문이 있거나 도움이 필요하면 저에게 연락하십시오. TakePropips Donchian Trend Pro 지표는 모든 Forex 쌍, 금속
FX Levels MT4
Daniel Stein
FX 레벨 알아보기: 트레이딩 성공을 위한 궁극적인 지지 및 저항 지표 FX 레벨은 단순한 지지 및 저항 지표가 아니라 통화쌍, 지수, 주식, 원자재 등 모든 거래 기호에 대해 정확성, 신뢰성, 원활한 기능을 원하는 진지한 트레이더를 위한 게임 체인저입니다. 입증된 라이트하우스 방식을 기반으로 하고 동적 실시간 적응성으로 강화된 FX 레벨은 차트에 바로 시장 반전 포인트를 표시해 정확한 수익 목표를 설정하고 거래 진입을 최적화하는 데 적합합니다. 왜 FX 레벨을 선택해야 하나요? 스타인 인베스트먼트 팀은 브로커와 다양한 데이터 피드에 대한 다년간의 경험을 활용하여 정확성과 일관성이 뛰어난 FX 레벨을 만들었습니다. 여러 브로커에서 거의 100% 동일한 레벨을 제공하는 FX 레벨은 다른 지표가 제공할 수 없는 탁월한 수준의 신뢰성을 제공합니다. FX 레벨을 향상시키는 것은 세부 사항에 대한 우리의 약속이며, 기대치를 충족시킬뿐만 아니라지지 및 저항 분석에 접근하는 방식을 변화시
TPSpro RFI Levels
Roman Podpora
4.82 (22)
지침         러시아   -        영어       표시기와 함께 사용하는 것이 좋습니다   .       -       TPSpro   트렌드 프로 -   MT4 버전         거래에서 핵심 요소는 거래 상품을 매수 또는 매도하기로 결정하는 구역 또는 수준입니다. 주요 업체가 시장에서 자신의 존재를 숨기려는 시도에도 불구하고, 그들은 필연적으로 흔적을 남깁니다. 우리의 과제는 이러한 흔적을 식별하고 올바르게 해석하는 방법을 배우는 것이었습니다. 주요 기능:: 판매자와 구매자를 위한 활성 영역을 표시합니다! 이 지표는 매수 및 매도를 위한 모든 올바른 초기 임펄스 레벨/존을 보여줍니다. 진입점 검색이 시작되는 이러한 레벨/존이 활성화되면 레벨의 색상이 바뀌고 특정 음영으로 채워집니다. 또한 상황을 보다 직관적으로 이해하기 위해 화살표가 나타납니다. 더 높은 시간대의 레벨/존 표시(MTF 모드) 더 높은 시간 간격을 사용하여 레벨/존을 표시하는 기능을 추가했습니다.
Connect Indicator
Sukunthakan Ngernbamrung
Connect Indicator is a tool used for connecting indicators between the MQL market and MT4. The connected indicators are made by our group and can be used for other applications, such as sending messages to the Line application or Telegram application. If you have any questions, please don't hesitate to ask us to receive support. Function and indicator buffer Buffer one is the high price of the previous candle. Buffer two is the high price of the previous candle. Usage To connect indicators to fu
Entry Arrow Alerts: Finds market entry opportunities then notifies you via mobile or desktop alerts The key features include: Conservative mode . One entry signal per direction. Ideal for the patient trader looking to capture longer term moves. Aggressive mode . Multiple possible entry signals per direction. Ideal for the active trader looking to capture multiple moves within the same trend. Trigger Line . Price entry line helps cut down on false signals. Display Window . Allows you to instantly
Advanced Supply Demand
Bernhard Schweigert
4.91 (295)
현재 33% 할인! 초보자나 전문 트레이더를 위한 최고의 솔루션! 이 보조지표는 우리가 다수의 독창적 기능과 새로운 공식을 통합한 독특하고 고품질이며 저렴한 거래 도구입니다. 이 업데이트를 통해 이중 시간대를 표시할 수 있습니다. 더 높은 TF를 표시할 수 있을 뿐만 아니라 차트 TF와 더 높은 TF 모두를 표시할 수 있습니다: 중첩 영역 표시. 모든 Supply Demand 트레이더들이 좋아할 것입니다. :) 중요한 정보 공개 Advanced Supply Demand의 잠재력을 극대화하려면 다음을 방문하십시오. https://www.mql5.com/ko/blogs/post/720245   진입 또는 목표의 명확한 트리거 포인트를 정확히 찾아냄으로 해서 거래가 어떻게 개선될지 상상해 보십시오. 새로운 알고리즘을 기반으로 매수자와 매도자 간의 잠재적인 불균형을 훨씬 더 쉽게 분간할 수 있습니다. 왜냐하면 가장 강한 공급영역과 가장 강한 수요 영역과 과거에 어떻게 진행 되었는지를(이
Supply and Demand Dashboard PRO
Bernhard Schweigert
4.8 (20)
현재 20% 할인! 이 대시보드는 여러 기호와 최대 9개의 타임프레임에서 작동하는 매우 강력한 소프트웨어입니다. 주요 지표(최상의 리뷰: 고급 공급 수요)를 기반으로 합니다.   Advanced Supply Demand 대시보드는 훌륭한 개요를 제공합니다. 다음과 같이 표시됩니다.  영역 강도 등급을 포함하여 필터링된 공급 및 수요 값, 영역에 대한/및 영역 내 Pips 거리, 중첩된 영역을 강조 표시하고 모든 (9) 시간 프레임에서 선택한 기호에 대해 4가지 종류의 경고를 제공합니다. 그것은 당신의 개인적인 필요에 맞게 고도로 구성 가능합니다! 당신의 혜택! 모든 트레이더에게 가장 중요한 질문: 시장에 진입하기에 가장 좋은 수준은 무엇입니까? 최고의 성공 기회와 위험/보상을 얻으려면 강력한 공급/수요 영역 내 또는 그 근처에서 거래를 시작하십시오. 손절매를 위한 최적의 장소는 어디입니까? 가장 안전하려면 강력한 수요/공급 구역 아래/위에 정
IX Power MT4
Daniel Stein
4.67 (6)
IX Power는 마침내 FX Power의 탁월한 정밀도를 외환이 아닌 기호에도 적용했습니다. 좋아하는 지수, 주식, 원자재, ETF, 심지어 암호화폐까지 단기, 중기, 장기 추세의 강도를 정확하게 파악할 수 있습니다. 단말기가 제공하는 모든 것을 분석할 수 있습니다. 사용해 보고 트레이딩 타이밍이 크게 향상되는 것을 경험해 보세요. IX Power 주요 특징 단말기에서 사용 가능한 모든 거래 심볼에 대해 100% 정확한 비재도장 계산 결과 제공 사전 구성 및 추가적으로 개별 구성 가능한 강도 분석 기간의 드롭다운 선택 가능 이메일, 메시지, 모바일 알림을 통한 다양한 알림 옵션 제공 EA 요청을 위한 액세스 가능한 버퍼 더 나은 성능을 위한 사용자 지정 가능한 계산 한도 더 많은 것을 보고 싶은 사용자를 위한 특별 다중 인스턴스 설정 모든 차트에서 좋아하는 색상을 위한 무한한 그래픽 설정 가능 Windows 11 및 macOS 스타일의 둥근 모서리를 가
Apollo Pips PLUS SP
Oleg Rodin
5 (4)
제품을 구매하기 전에 아래 정보를 읽어보세요! Apollo Pips PLUS SP는 독특한 제품입니다! 모든 거래 지표에 액세스할 수 있는 새로운 "APOLLO PIPS" 지표와 "슈퍼 팩" 보너스를 받고 싶은 분들을 위한 것입니다! Apollo Pips PLUS SP 제품을 구매하면 실제로 Apollo Pips 표시기의 완전히 새로운 버전을 구매하게 됩니다. 이 버전의 지표에는 개선된 알고리즘과 사용하기 쉬운 매개변수가 있어 모든 시장 및 거래 스타일에서 지표를 사용할 수 있는 기회를 제공합니다. 이 제품의 구매자는 슈퍼 보너스로 다른 모든 표시기에 무료로 액세스할 수 있습니다! 내 모든 거래 도구에 액세스하고 싶었다면 이 제품이 당신에게 딱 맞습니다! :) 하지만 이것이 전부는 아닙니다! :) 이 제품의 모든 구매자는 또한 내 새로운 지표를 무료로 받을 자격이 있습니다! :) 새로운 거래 지표를 사용할 수 있게 되었는데, 귀하는 저의 특별한 "SUPER PACK" 평생 보너스
AT Forex Indicator MT4
Marzena Maria Szmit
5 (3)
The AT Forex Indicator MT4 is a sophisticated trading tool designed to provide traders with a comprehensive analysis of multiple currency pairs. This   powerful indicator   simplifies the complex nature of the forex market, making it accessible for both novice and experienced traders. AT Forex Indicator uses   advanced algorithms   to detect trends, patterns and is an essential tool for traders aiming to enhance their forex trading performance. With its robust features, ease of use, and reliabl
Basic Harmonic Patterns Dashboard
Mehran Sepah Mansoor
5 (3)
이 대시보드는 선택한 심볼에 대해 사용 가능한 최신 고조파 패턴을 표시하므로 시간을 절약하고 더 효율적으로 사용할 수 있습니다 / MT5 버전 . 무료 인디케이터: Basic Harmonic Pattern 인디케이터 열 Symbol : 선택한 심볼이 나타납니다 Trend : 강세 또는 약세 Pattern : 패턴 유형(가틀리, 나비, 박쥐, 게, 상어, 사이퍼 또는 ABCD) Entry : 진입 가격 SL: 스톱로스 가격 TP1: 1차 테이크프로핏 가격 TP2: 2차 테이크프로핏 가격 TP3: 3차 테이크프로핏 가격 Current price: 현재 가격 Age (in bars): 마지막으로 그려진 패턴의 나이 주요 입력 Symbols : "28개 주요 통화쌍" 또는 "선택한 심볼" 중에서 선택합니다. Selected Symbols : 쉼표로 구분하여 모니터링하려는 원하는 심볼("EURUSD,GBPUSD,XAUUSD")을 선택합니다. 브로커에 쌍에 접미사 또는 접두사가
SMCpro VIP
Arief
5 (1)
Currently Price 20% OFF ( for unlimited use )   BONUS  AUX VIP Club 2024 : Include  EA Airbag  and  Load Data History  to enhance the performance of this tool to its maximum potential  Click Here to Download Files   ( for users only )   Hello World! Introducing.. SMCpro VIP tool and Indicator for MetaTrader 4, designed to revolutionize your trading experience with the ICT Smart Money Concept. This system is meticulously crafted to empower traders with advanced insights and precision in
Quantum Heiken Ashi PRO MT4
Bogdan Ion Puscasu
4.33 (6)
소개       Quantum Heiken Ashi PRO   차트 시장 동향에 대한 명확한 통찰력을 제공하도록 설계된 Heiken Ashi 양초는 노이즈를 필터링하고 잘못된 신호를 제거하는 기능으로 유명합니다. 혼란스러운 가격 변동에 작별을 고하고 더 매끄럽고 신뢰할 수 있는 차트 표현을 만나보세요. Quantum Heiken Ashi PRO를 정말 독특하게 만드는 것은 전통적인 촛대 데이터를 읽기 쉬운 색상 막대로 변환하는 혁신적인 공식입니다. 빨간색과 녹색 막대는 각각 약세와 강세 추세를 우아하게 강조하여 잠재적 진입점과 퇴장점을 매우 정확하게 파악할 수 있습니다. Quantum EA 채널:       여기를 클릭하세요 MT5 버전:       여기를 클릭하세요 이 놀라운 지표는 다음과 같은 몇 가지 주요 이점을 제공합니다. 선명도 향상: Heiken Ashi 바는 가격 변동을 완화하여 시장 추세를 보다 명확하게 나타내므로 유리한 거래 기회를 쉽게 식별할 수 있
PRO Renko System
Oleg Rodin
5 (26)
PRO Renko System 은 RENKO 차트 거래를 위해 특별히 고안된 매우 정확한 거래 시스템입니다. 이것은 다양한 거래 상품에 적용될 수있는 보편적 인 시스템입니다. 체계는 효과적으로 당신에게 정확한 반전 신호에 접근을 주는 소위 시장 소음을 중화합니다. 이 표시기는 사용하기가 매우 쉽고 신호 생성을 담당하는 매개 변수가 하나만 있습니다. 당신은 쉽게 당신의 선택의 어떤 무역 계기에 공구를 적응시킬 수 있고 renko 막대기의 크기. 나는 항상 당신이 내 소프트웨어로 수익성있게 거래 할 수 있도록 추가 지원을 제공 할 준비가되어 있습니다! 나는 당신에게 행복하고 수익성있는 거래를 기원합니다! 구매 후 저에게 연락하십시오! 내 렌코 차트 생성기를 보내드립니다. 또한 내 개인 권장 사항 및 시스템의 다른 모듈을 무료로 공유 할 것입니다!
우선적으로 이 거래 시스템은 다시 그리지 않고, 다시 그리지 않으며, 지연되지 않는 것을 강조할 가치가 있습니다. 이는 전문적인 거래에 이상적입니다. 온라인 강좌, 사용자 매뉴얼 및 데모. "스마트 서포트 앤 레지스턴스 트레이딩 시스템"은 새로운 및 경험 많은 트레이더를 위해 개발된 고급 지표입니다. 이 시스템은 외환 시장에서 정밀도와 신뢰감을 제공합니다. 이 포괄적인 시스템은 일일 거래 전략, 스윙 거래 전략, 지원 및 저항 전략, 캔들스틱 패턴 전략, VWAP 전략, 다중 시간대 추세 전략 등을 포함한 7개 이상의 전략, 10개의 지표 및 다양한 거래 방식을 결합합니다. 이 시스템은 화살표 신호, 진입 및 출구 지점, 거래 경보, 높은 시간대 추세 분석, 실시간 거래 모니터링 및 트렌드 및 볼륨 캔들 색상 제공합니다. 자동 지원 및 저항 감지로 다양한 시장 상황에서 신중한 결정을 돕는 다면적 인 지표입니다. 스마트 서포트 앤 레지스턴스 트레이딩 시스템은 프리미엄 및 강력한
Line Magnit
Aleksey Trenin
The LineMagnit Indicator for MT4 is a highly precise tool that builds support and resistance levels which magnetically attract prices. This feature allows traders to easily determine the most probable entry and exit points in the market, as well as identify the market's directional forces, as levels are based on capital inflows into the instrument. Equipped with an intuitively understandable graphical interface, the LineMagnit Indicator enables users to quickly locate and analyze support and res
TheStrat Monitor
Robert Gerald Wood
3 (2)
If you've not already learnt about The Strat trading strategy , go google it now. I promise it won't be a waste of your time, and you will likely learn some new tricks whether you use it or not. OK, so now you know what TheStrat is, you will be able to understand what this indicator can do for you. Key Features In short, the Indicator will: Show Timeframe Continuity for all supported timeframes Supports two timeset views, Day trader and Swing trader Show when Full Timeframe Continuity is in pl
Reincarnations
Maryna Shulzhenko
The Reincarnations trend indicator is used to determine the strength and direction of a trend and to find price reversal points. This tool scans the market looking for the correct entry. You can see and evaluate it yourself, perhaps it will suit you for a number of tasks related to forecasting price movements. It uses only price data and analytics to calculate entry points. Does not use auxiliary indicators. It has two parameters for customization. Indicator setting. Interval - price analysis
PZ Support Resistance
PZ TRADING SLU
3.33 (3)
Unlock key market insights with automated support and resistance lines Special Offer: Purchase now to receive free bonuses worth $75! (Read more for details) Tired of plotting support and resistance lines? This is a multi-timeframe indicator that detects and plots supports and resistance lines in the chart with the same precision as a human eye would. As price levels are tested over time and its importance increases, the lines become thicker and darker, making price leves easy to glance and ev
제작자의 제품 더 보기
Universal Breakout MT5
Sergey Ermolov
4.19 (47)
설정 및 보고서 |  MT4 버전  |  Universal Box 거래 세션 표시기   |  FAQ Universal Breakout  이것은 고전적인 가격 범위 분석 전략에 대한 전문가 고문 거래입니다. 시간 간격에 의해 설정된 가격 코리더에서 가격의 종료를 의미하는 모든 전략에 대해 구성할 수 있습니다. 예를 들면:아시아,유럽 또는 미국 무역 세션의 극단의 고장,일일 극단의 고장 또는 월요일의 첫 번째 4 촛불. Telegram 채팅:  @it_trader_chat 새로운 Expert Advisor Prop Master - 트레이딩 터미널에서 테스트해보세요 https://www.mql5.com/ko/market/product/115375 개량 설정에서는 개수가 최대 및 최소 가격대를 검색하는 시간 범위를 설정합니다. 또한 고문이 보류중인 주문을 할 시간을 지정합니다. 지정된 시간에 매장은 해당 범위의 최대 및 최소 가격 수준에서 두 개의 보류 중인 매수 중지 및 매도 중지 주문
FREE
Owl Smart Levels MT5
Sergey Ermolov
4.07 (28)
MT4 버전  |  FAQ Owl Smart Levels Indicator 는 Bill Williams 의 고급 프랙탈, 시장의 올바른 파동 구조를 구축하는 Valable ZigZag, 정확한 진입 수준을 표시하는 피보나치 수준과 같은 인기 있는 시장 분석 도구를 포함하는 하나의 지표 내에서 완전한 거래 시스템입니다. 시장과 이익을 취하는 장소로. 전략에 대한 자세한 설명 표시기 작업에 대한 지침 고문-거래 올빼미 도우미의 조수 개인 사용자 채팅 ->구입 후 나에게 쓰기,나는 개인 채팅에 당신을 추가하고 거기에 모든 보너스를 다운로드 할 수 있습니다 힘은 단순함에 있습니다! Owl Smart Levels 거래 시스템은 사용하기 매우 쉽기 때문에 전문가와 이제 막 시장을 연구하고 스스로 거래 전략을 선택하기 시작한 사람들 모두에게 적합합니다. 전략 및 지표에는 눈에 보이지 않는 비밀 공식 및 계산 방법이 없으며 모든 전략 지표는 공개되어 있습니다. Owl Smart Levels를
Valable ZigZag MT5
Sergey Ermolov
4.76 (17)
MT4 버전 | Trend Monitor VZ 표시  |  Owl Smart Levels 표시   |  Owl Smart Levels 전략  |  FAQ 엘리엇 웨이브 이론은 가격 차트에 파도의 시각적 모델에 의존하는 금융 시장의 프로세스의 해석이다. 평가 가능한 지그재그 표시기는 시장의 파동 구조를 표시하며,이는 거래 결정을 내리는 데 사용할 수 있습니다. 평가 가능한 지그재그 표시등이 더 안정적이며 종종 고전적인 지그재그 표시와 같은 방향을 변경하지 않습니다,오해의 소지가있는 상인. 이 지표파의 건설에 도형의 사용을 통해 달성된다. Telegram 채팅:  @it_trader_chat 새로운 Expert Advisor Prop Master   - 트레이딩 터미널에서 테스트해보세요 https://www.mql5.com/ko/market/product/115375 평가 가능한 지그재그는 주로 추세 지표입니다. 그것은 상인이 거래해야하는 주요 방향을 설정하지만 시장 진입의 지표
FREE
Owl smart levels
Sergey Ermolov
4.34 (35)
MT5 버전  |   FAQ Owl Smart Levels Indicator 는   Bill Williams 의 고급 프랙탈, 시장의 올바른 파동 구조를 구축하는 Valable ZigZag, 정확한 진입 수준을 표시하는 피보나치 수준과 같은 인기 있는 시장 분석 도구를 포함하는 하나의 지표 내에서 완전한 거래 시스템입니다. 시장과 이익을 취하는 장소로. 전략에 대한 자세한 설명 표시기 작업에 대한 지침 고문-거래 올빼미 도우미의 조수 개인 사용자 채팅 ->구입 후 나에게 쓰기,나는 개인 채팅에 당신을 추가하고 거기에 모든 보너스를 다운로드 할 수 있습니다 힘은 단순함에 있습니다! Owl Smart Levels   거래 시스템은 사용하기 매우 쉽기 때문에 전문가와 이제 막 시장을 연구하고 스스로 거래 전략을 선택하기 시작한 사람들 모두에게 적합합니다. 전략 및 지표에는 눈에 보이지 않는 비밀 공식 및 계산 방법이 없으며 모든 전략 지표는 공개되어 있습니다. Owl Smart Lev
Grid Hlevel MT5
Sergey Ermolov
4.65 (34)
MT4 버전  |  Valable ZigZag표시   |  FAQ Grid HLevel  전문가 어드바이저는 매월 외환 시장에서 안정적인 수익을 내고자 하는 트레이더에게 적합합니다. 전문가 어드바이저는 평균화 전략에 따라 작동하므로 올바르게 사용하는 것이 좋습니다.   "올바르게"사용한다는 것은 시장의 반전 지점에서 평균화 된 거래를 시작하고 글로벌 추세의 방향으로 만 거래하는 것을 의미합니다. 주요 추세의 방향에 관해서는 H4 기간의 Valable ZigZag 표시기로 결정하는 것이 좋습니다. 지표로 시장이 변할 수있는 수준을 결정하는 것이 더 어렵 기 때문에 평균화 주문을 사용하여 시장에보다 정확하게 진입하기 위해 거래자가 차트에서 수동으로설정하는 것이 좋습니다.   Telegram 채팅:  @it_trader_chat 새로운 Expert Advisor Prop Master   - 트레이딩 터미널에서 테스트해보세요 https://www.mql5.com/ko/market/prod
FREE
Full Fractals MT5
Sergey Ermolov
4.64 (14)
MT4 version  |   Owl Smart Levels Indicator   |  Owl Smart Levels 전략  |  FAQ Fractals Indicator 는   Bill Williams 의 저자 거래 전략 요소 중 하나입니다. 가격 차트에서 가격 반전 지점을 검색하고 결과적으로 지원 및 저항 수준을 검색하는 데 사용됩니다. Full Fractals Indicator 는 거의 모든 거래 터미널의 툴킷에서 사용할 수 있는 개선된 Fractals입니다. 유일한 차이점은 프랙탈을 만들기 위해 기본 양초의 왼쪽에 5개의 양초와 오른쪽에 2개의 양초를 사용한다는 것입니다(그림 1 참조). 기본 구성 외에도 Full Fractals는 가격이 한동안 멈춘 수준을 찾습니다. Telegram 채팅:  @it_trader_chat 새로운 Expert Advisor Prop Master   - 트레이딩 터미널에서 테스트해보세요 https://www.mql5.com/ko/market
FREE
Full Fractals
Sergey Ermolov
4.85 (13)
MT5 version  |  Owl Smart Levels Indicator   |  Owl Smart Levels 전략  |  FAQ Fractals Indicator 는 Bill Williams 의 저자 거래 전략 요소 중 하나입니다. 가격 차트에서 가격 반전 지점을 검색하고 결과적으로 지원 및 저항 수준을 검색하는 데 사용됩니다. Full Fractals Indicator 는 거의 모든 거래 터미널의 툴킷에서 사용할 수 있는 개선된 Fractals입니다. 유일한 차이점은 프랙탈을 만들기 위해 기본 양초의 왼쪽에 5개의 양초와 오른쪽에 2개의 양초를 사용한다는 것입니다(그림 1 참조). 기본 구성 외에도 Full Fractals는 가격이 한동안 멈춘 수준을 찾습니다. Telegram 채팅:  @it_trader_chat 새로운 Expert Advisor Prop Master   - 트레이딩 터미널에서 테스트해보세요 https://www.mql5.com/ko/market/pr
FREE
Universal Breakout
Sergey Ermolov
4.55 (33)
설정 및 보고서 |  MT5 버전  |  Universal Box 거래 세션 표시기 |  FAQ Universal Breakout  이것은 고전적인 가격 범위 분석 전략에 대한 전문가 고문 거래입니다. 시간 간격에 의해 설정된 가격 코리더에서 가격의 종료를 의미하는 모든 전략에 대해 구성할 수 있습니다. 예를 들면:아시아,유럽 또는 미국 무역 세션의 극단의 고장,일일 극단의 고장 또는 월요일의 첫 번째 4 촛불. Telegram 채팅:  @it_trader_chat 새로운 Expert Advisor Prop Master   - 트레이딩 터미널에서 테스트해보세요 https://www.mql5.com/ko/market/product/115375 개량 설정에서는 개수가 최대 및 최소 가격대를 검색하는 시간 범위를 설정합니다. 또한 고문이 보류중인 주문을 할 시간을 지정합니다. 지정된 시간에 매장은 해당 범위의 최대 및 최소 가격 수준에서 두 개의 보류 중인 매수 중지 및 매도 중지 주문
FREE
Universal Box MT5
Sergey Ermolov
4.75 (8)
MT4 버전   |  FAQ  |   EA Universal Breakout   Universal Box 는 차트에 가격대를 표시하여 나중에 가격대 돌파 시 거래에 사용할 수 있습니다. 이 지표를 적용할 수 있는 전략은 다양합니다. 이 인디케이터는 기본적으로 차트에   아시아, 유럽 및 미국 거래 세션  범위를 표시하도록 설정되어 있습니다. 범위는 직사각형으로 표시되며, 그 경계는 거래 세션의 시작 및 종료 시간과 해당 기간의 최대 및 최소 가격 수준입니다. Telegram 채팅:  @it_trader_chat 새로운 Expert Advisor Prop Master   - 트레이딩 터미널에서 테스트해보세요 https://www.mql5.com/ko/market/product/115375 인디케이터 설정은 매우 간단합니다. Time Open   - 거래 세션 시작 시간 Time Close   - 거래 세션 종료 시간 Box color   - 사각형의 색상 인디케이터에 4개의 가
FREE
Prop Master MT4
Sergey Ermolov
2 (1)
Prop Master   Expert Advisor는 고전적인 전략에 따라 작동하며 고객을 위해   Prop   firms   설정한 모든 규칙을 따릅니다. Expert Advisor는 Prop 회사의 펀딩 계좌와 본인 계좌에서 모두 거래할 수 있습니다. 거래 계좌 유형에는 제한이 없습니다. Expert Advisor를 테스트하는 방법은 무엇인가요? Expert Advisor가 올바른 시간대에서 작동하는 것이 중요하므로 테스트하기 전에 GMT 매개변수를 올바르게 설정해야 합니다. GMT 매개변수를 올바르게 설정하는 방법은 무엇인가요? 설정은 시장이 개장하고 거래 터미널에 틱이 수신되는 시점에 이루어져야 합니다. Google을 열고 "현재 GMT 시간"을 검색한 다음 표시되는 첫 번째 웹사이트를 열고 시간을 기록합니다(예: 10:53). Expert Advisor를 테스트하고 사용할 트레이딩 단말기를 엽니다. 데이터 창(Market watch)을 열면 이 창 상단에 브로커 거래 서버의
Prop Master MT5
Sergey Ermolov
5 (1)
Prop Master   Expert Advisor는 고전적인 전략에 따라 작동하며 고객을 위해   Prop   firms   설정한 모든 규칙을 따릅니다. Expert Advisor는 Prop 회사의 펀딩 계좌와 본인 계좌에서 모두 거래할 수 있습니다. 거래 계좌 유형에는 제한이 없습니다. Expert Advisor를 테스트하는 방법은 무엇인가요? Expert Advisor가 올바른 시간대에서 작동하는 것이 중요하므로 테스트하기 전에 GMT 매개변수를 올바르게 설정해야 합니다. GMT 매개변수를 올바르게 설정하는 방법은 무엇인가요? 설정은 시장이 개장하고 거래 터미널에 틱이 수신되는 시점에 이루어져야 합니다. Google을 열고 "현재 GMT 시간"을 검색한 다음 표시되는 첫 번째 웹사이트를 열고 시간을 기록합니다(예: 10:53). Expert Advisor를 테스트하고 사용할 트레이딩 단말기를 엽니다. 데이터 창(Market watch)을 열면 이 창 상단에 브로커 거래 서버의
Grid HLevel
Sergey Ermolov
4.54 (24)
MT5 버전  |  Valable ZigZag 표시   |   FAQ Grid HLevel  전문가 어드바이저는 매월 외환 시장에서 안정적인 수익을 내고자 하는 트레이더에게 적합합니다. 전문가 어드바이저는 평균화 전략에 따라 작동하므로 올바르게 사용하는 것이 좋습니다. "올바르게"사용한다는 것은 시장의 반전 지점에서 평균화 된 거래를 시작하고 글로벌 추세의 방향으로 만 거래하는 것을 의미합니다. 주요 추세의 방향에 관해서는 H4 기간의 Valable ZigZag 표시기로 결정하는 것이 좋습니다. 지표로 시장이 변할 수있는 수준을 결정하는 것이 더 어렵 기 때문에 평균화 주문을 사용하여 시장에보다 정확하게 진입하기 위해 거래자가 차트에서 수동으로설정하는 것이 좋습니다. Telegram 채팅:  @it_trader_chat 새로운 Expert Advisor Prop Master   - 트레이딩 터미널에서 테스트해보세요 https://www.mql5.com/ko/market/produc
FREE
Shuttle Runner
Sergey Ermolov
3.82 (17)
스윙 전략은 Shutle Runner 전문가 고문의 기초입니다. 이 전략은 2009 년에 다시 설명되었으며 외환 시장의 거래자들에 의해 적극적으로 사용되었습니다. Shutle Runner 은 이 전략의 수정되고 개선된 버전입니다 . Telegram 채팅:  @it_trader_chat 새로운 Expert Advisor Prop Master   - 트레이딩 터미널에서 테스트해보세요 https://www.mql5.com/ko/market/product/115375 이 전략의 주요 본질은 다음과 같습니다: 이 전문가 고문은 시장의 활성 단계에서만 거래 할 가치가 있습니다. 그리고 우리는 시장이 유럽과 미국의 거래 세션 동안 활성화되어 있다는 것을 알고(당신은 또한 아시아 하나를 취할 수 있지만,중요한 경제 뉴스의 존재는 전제 조건입니다). 따라서 전문가 고문을 시작하기 전에 경제 달력을보고 통화를 거래 할 국가의 중요한 뉴스를 확인하십시오. 뉴스가있는 경우 뉴스 1-2 시간 전에 전
FREE
Valable ZigZag
Sergey Ermolov
4.5 (6)
MT5 버전  | Trend Monitor VZ 표시  |  Owl Smart Levels 표시   |  Owl Smart Levels 전략  |  FAQ 엘리엇 웨이브 이론은 가격 차트에 파도의 시각적 모델에 의존하는 금융 시장의 프로세스의 해석이다. 평가 가능한 지그재그 표시기는 시장의 파동 구조를 표시하며,이는 거래 결정을 내리는 데 사용할 수 있습니다. 평가 가능한 지그재그 표시등이 더 안정적이며 종종 고전적인 지그재그 표시와 같은 방향을 변경하지 않습니다,오해의 소지가있는 상인. 이 지표파의 건설에 도형의 사용을 통해 달성된다. Telegram 채팅:  @it_trader_chat 새로운 Expert Advisor Prop Master   - 트레이딩 터미널에서 테스트해보세요 https://www.mql5.com/ko/market/product/115375 평가 가능한 지그재그는 주로 추세 지표입니다. 그것은 상인이 거래해야하는 주요 방향을 설정하지만 시장 진입의 지표
FREE
Universal Box
Sergey Ermolov
5 (1)
MT5 버전   |  FAQ  |   EA Universal Breakout   Universal Box 는 차트에 가격대를 표시하여 나중에 가격대 돌파 시 거래에 사용할 수 있습니다. 이 지표를 적용할 수 있는 전략은 다양합니다. 이 인디케이터는 기본적으로 차트에 아시아, 유럽 및 미국 거래 세션  범위를 표시하도록 설정되어 있습니다. 범위는 직사각형으로 표시되며, 그 경계는 거래 세션의 시작 및 종료 시간과 해당 기간의 최대 및 최소 가격 수준입니다. Telegram 채팅:  @it_trader_chat 새로운 Expert Advisor Prop Master   - 트레이딩 터미널에서 테스트해보세요 https://www.mql5.com/ko/market/product/115375 인디케이터 설정은 매우 간단합니다. Time Open - 거래 세션 시작 시간 Time Close - 거래 세션 종료 시간 Box color - 사각형의 색상 인디케이터에 4개의 가격 범위를 설정
FREE
MiloBot PRO MT5
Sergey Ermolov
5 (4)
2015 년 백테스트 |  MT4 버전  |   FAQ MiloBot PRO 는 2 년 이상 개발,테스트 및 최적화 된 저자의 전략을 기반으로 한 외환 전문가 고문입니다. 전략의 신뢰성을 나타내는 지표는 총$100,000 이상의 예금을 가진 실제 개발자 계정으로 간주 될 수 있습니다. MiloBot PRO의 고급 알고리즘 전략을 통해 매월 지속적으로 수익을 올릴 수 있습니다. 그리고 저자의 지표를 통해 시장은 시장 반전 순간에 가능한 한 정확하게 시장에 진입 할 수 있습니다. 개발자의 라이브 신호 보기: 2019년 11월 계정(이익 +1520% 이상):   myfxbook.com/members/Malik87/robot-advisor-launched-november-11/3623023 우리는 거래를 위해   MiloBot PRO 를 사용하므로 끊임없이 새로운 것을 테스트하고 그것을 구현하고 있습니다. 모든 구매자는 업데이트를 받고 가장 신뢰할 수있는 최신 버전의 전문가 고문을 사용합
Molecule AI
Sergey Ermolov
3.86 (7)
2010년 이후 V4 보고서 |  MT5 버전  |   FAQ !!! 새 버전 V4 - 09/23/2023 !!! 보다 안정적인 새 알고리즘이 추가되었습니다(자세한 내용은 아래 참조). 테스트 전 올바른 설정 Expert Advisor가 올바른 시간대에서 작동하는 것이 중요하므로 테스트하기 전에 GMT 매개변수를 올바르게 설정해야 합니다. GMT 매개변수를 올바르게 설정하는 방법은 무엇인가요? 설정은 시장이 개장하고 거래 터미널에 틱이 수신되는 시점에 이루어져야 합니다. Google을 열고 "현재 GMT 시간"을 검색한 다음 표시되는 첫 번째 웹사이트를 열고 시간을 기록합니다(예: 10:53). Expert Advisor를 테스트하고 사용할 트레이딩 단말기를 엽니다. 데이터 창(Market watch)을 열면 이 창 상단에 브로커 거래 서버의 시간이 표시됩니다(예: 12:53). 브로커 시간에서 그리니치 표준시(GMT)를 빼고 Expert Advisor에서 설정할 파라미터를 가져
ATR Zone MT5
Sergey Ermolov
ATR is an important indicator for any financial market. The abbreviation ATR stands for Average True Range. This indicator is a tool to determine the volatility of the market, this is its direct purpose. ATR shows the average price movement for the selected period of time. The initial price of the indicator is 63$. The price will increase every 10 sales   up to 179$ The original ATR indicator is present in many trading programs. The ATR indicator is not very informative, so I modified its data a
Safety
Sergey Ermolov
5 (2)
나는 모두가"안전"과 같은 돈 관리 규칙을 알고 있다고 생각합니다. 인식하지 못하는 사람들을 위해,금고는 거래에 대한 이익이 정지의 크기를 같게 한 후 위치의 절반을 마감한다고 가정합니다. 따라서,가격이 반전하고 정지를 잡는다 할지라도,이전에 위치의 일부를 닫을 때 정확히 같은 양의 이익을 받았기 때문에 돈을 잃지 않을 것입니다. 안전 전문가 고문은 단 하나의 설정,즉 폐쇄 로트 만 있습니다. 위치 0 에 남겨두면 고문은 거래의 정확히 절반을 닫을 것입니다. 전문가 어드바이저를 설치 한 후,이익의 일부가 전문가 어드바이저에 의해 고정 될 위치에 빨간색 점선이 차트에 나타납니다. 당신이 고문이 다른 수준에서 트랜잭션의 일부를 닫으려면 안전하게 다른 장소로이 라인을 이동할 수 있습니다. 동일한 통화 쌍에 여러 개의 거래가 열려 있는 경우 마우스 커서로 시장을 차트로 끌어다 놓고 안전한 거래로 마감하려는 주문 시작 수준 근처에 시장을 놓아야 합니다. 전문가 고문은 주문 티켓을
FREE
MiloBot PRO
Sergey Ermolov
5 (3)
2015 년 백테스트 |  MT5 버전  |   FAQ MiloBot PRO 는 2 년 이상 개발,테스트 및 최적화 된 저자의 전략을 기반으로 한 외환 전문가 고문입니다. 전략의 신뢰성을 나타내는 지표는 총$100,000 이상의 예금을 가진 실제 개발자 계정으로 간주 될 수 있습니다. MiloBot PRO의 고급 알고리즘 전략을 통해 매월 지속적으로 수익을 올릴 수 있습니다. 그리고 저자의 지표를 통해 시장은 시장 반전 순간에 가능한 한 정확하게 시장에 진입 할 수 있습니다. 개발자의 라이브 신호 보기: 2019년 11월 계정(이익 +1520% 이상):   myfxbook.com/members/Malik87/robot-advisor-launched-november-11/3623023 우리는 거래를 위해 MiloBot PRO 를 사용하므로 끊임없이 새로운 것을 테스트하고 그것을 구현하고 있습니다. 모든 구매자는 업데이트를 받고 가장 신뢰할 수있는 최신 버전의 전문가 고문을 사용합니
Trend Monitor VZ
Sergey Ermolov
3.67 (3)
MT5 버전  | Valable ZigZag표시 |  FAQ 엘리엇 파동 이론은 가격 차트의 시각적 파동 모델을 기반으로 한 금융 시장의 프로세스에 대한 해석입니다. 이이론에 따르면 현재 시장에서 어떤 추세가 우세한지, 즉 상승 또는 하락 추세를 정확히 알 수 있습니다. Valable ZigZag 표시 기는 시장의 파동 구조를 보여줄 뿐만 아니라 현재 시간대에서 현재 주요 추세의 방향을 나타냅니다. 편의를 위해 Trend Monitor VZ 표시기는 거래하는 전체 통화 쌍 목록에 대한 모든 시간대의 추세 방향을 차트에표시합니다. 단일 차트에서 모든 상품에 대한 전반적인 시장 상황을 파악하여 올바른 거래 결정을 내릴 수 있습니다! Valable ZigZag 표시기는 매우 안정적이며 고전적인 지그재그처럼 방향을 자주 바꾸지 않아 트레이더에게 혼란을주지 않습니다. 이는 지표의 파동을 플로팅하기 위해 프랙탈을 사용하여 달성됩니다. Valable ZigZag 표시기는 무엇보다도 추세 표시기
Babylon
Sergey Ermolov
Babylon Expert Advisor trades on support and resistance levels. Support and resistance levels are determined on the basis of a genetic algorithm based on artificial intelligence. This allows you to open trades not only at levels that are already visible in history, but also at the expected levels that may be formed in the future. Moreover, trading only in the direction of the trend increases reliability and minimizes possible drawdowns. After purchase, send me a private message to receive the se
Trend Monitor VZ MT5
Sergey Ermolov
5 (1)
MT4 버전  |   Valable ZigZag표시   |  FAQ 엘리엇 파동 이론은 가격 차트의 시각적 파동 모델을 기반으로 한 금융 시장의 프로세스에 대한 해석입니다. 이이론에 따르면 현재 시장에서 어떤 추세가 우세한지, 즉 상승 또는 하락 추세를 정확히 알 수 있습니다.   Valable ZigZag 표시 기는 시장의 파동 구조를 보여줄 뿐만 아니라 현재 시간대에서 현재 주요 추세의 방향을 나타냅니다. 편의를 위해 Trend Monitor VZ 표시기는 거래하는 전체 통화 쌍 목록에 대한 모든 시간대의 추세 방향을 차트에표시합니다. 단일 차트에서 모든 상품에 대한 전반적인 시장 상황을 파악하여 올바른 거래 결정을 내릴 수 있습니다! Valable ZigZag 표시기는 매우 안정적이며 고전적인 지그재그처럼 방향을 자주 바꾸지 않아 트레이더에게 혼란을주지 않습니다. 이는 지표의 파동을 플로팅하기 위해 프랙탈을 사용하여 달성됩니다. Valable ZigZag 표시기는 무엇보다도 
Molecule AI MT5
Sergey Ermolov
2.67 (6)
2010년 이후 V4 보고서  |  MT4 버전  |  FAQ !!! 새 버전 V4 - 09/23/2023 !!!   보다 안정적인 새 알고리즘이 추가되었습니다(자세한 내용은 아래 참조). 테스트 전 올바른 설정 Expert Advisor가 올바른 시간대에서 작동하는 것이 중요하므로 테스트하기 전에 GMT 매개변수를 올바르게 설정해야 합니다. GMT 매개변수를 올바르게 설정하는 방법은 무엇인가요? 설정은 시장이 개장하고 거래 터미널에 틱이 수신되는 시점에 이루어져야 합니다. Google을 열고 "현재 GMT 시간"을 검색한 다음 표시되는 첫 번째 웹사이트를 열고 시간을 기록합니다(예: 10:53). Expert Advisor를 테스트하고 사용할 트레이딩 단말기를 엽니다. 데이터 창(Market watch)을 열면 이 창 상단에 브로커 거래 서버의 시간이 표시됩니다(예: 12:53). 브로커 시간에서 그리니치 표준시(GMT)를 빼고 Expert Advisor에서 설정할 파라미터를
Babylon MT5
Sergey Ermolov
Babylon Expert Advisor trades on support and resistance levels. Support and resistance levels are determined on the basis of a genetic algorithm based on artificial intelligence. This allows you to open trades not only at levels that are already visible in history, but also at the expected levels that may be formed in the future. Moreover, trading only in the direction of the trend increases reliability and minimizes possible drawdowns. After purchase, send me a private message to receive the se
필터:
리뷰 없음
리뷰 답변