ATR Zone
- Indicators
- Sergey Ermolov
- Version: 1.1
- Activations: 10
ATR is an important indicator for any financial market. The abbreviation ATR stands for Average True Range. This indicator is a tool to determine the volatility of the market, this is its direct purpose. ATR shows the average price movement for the selected period of time.
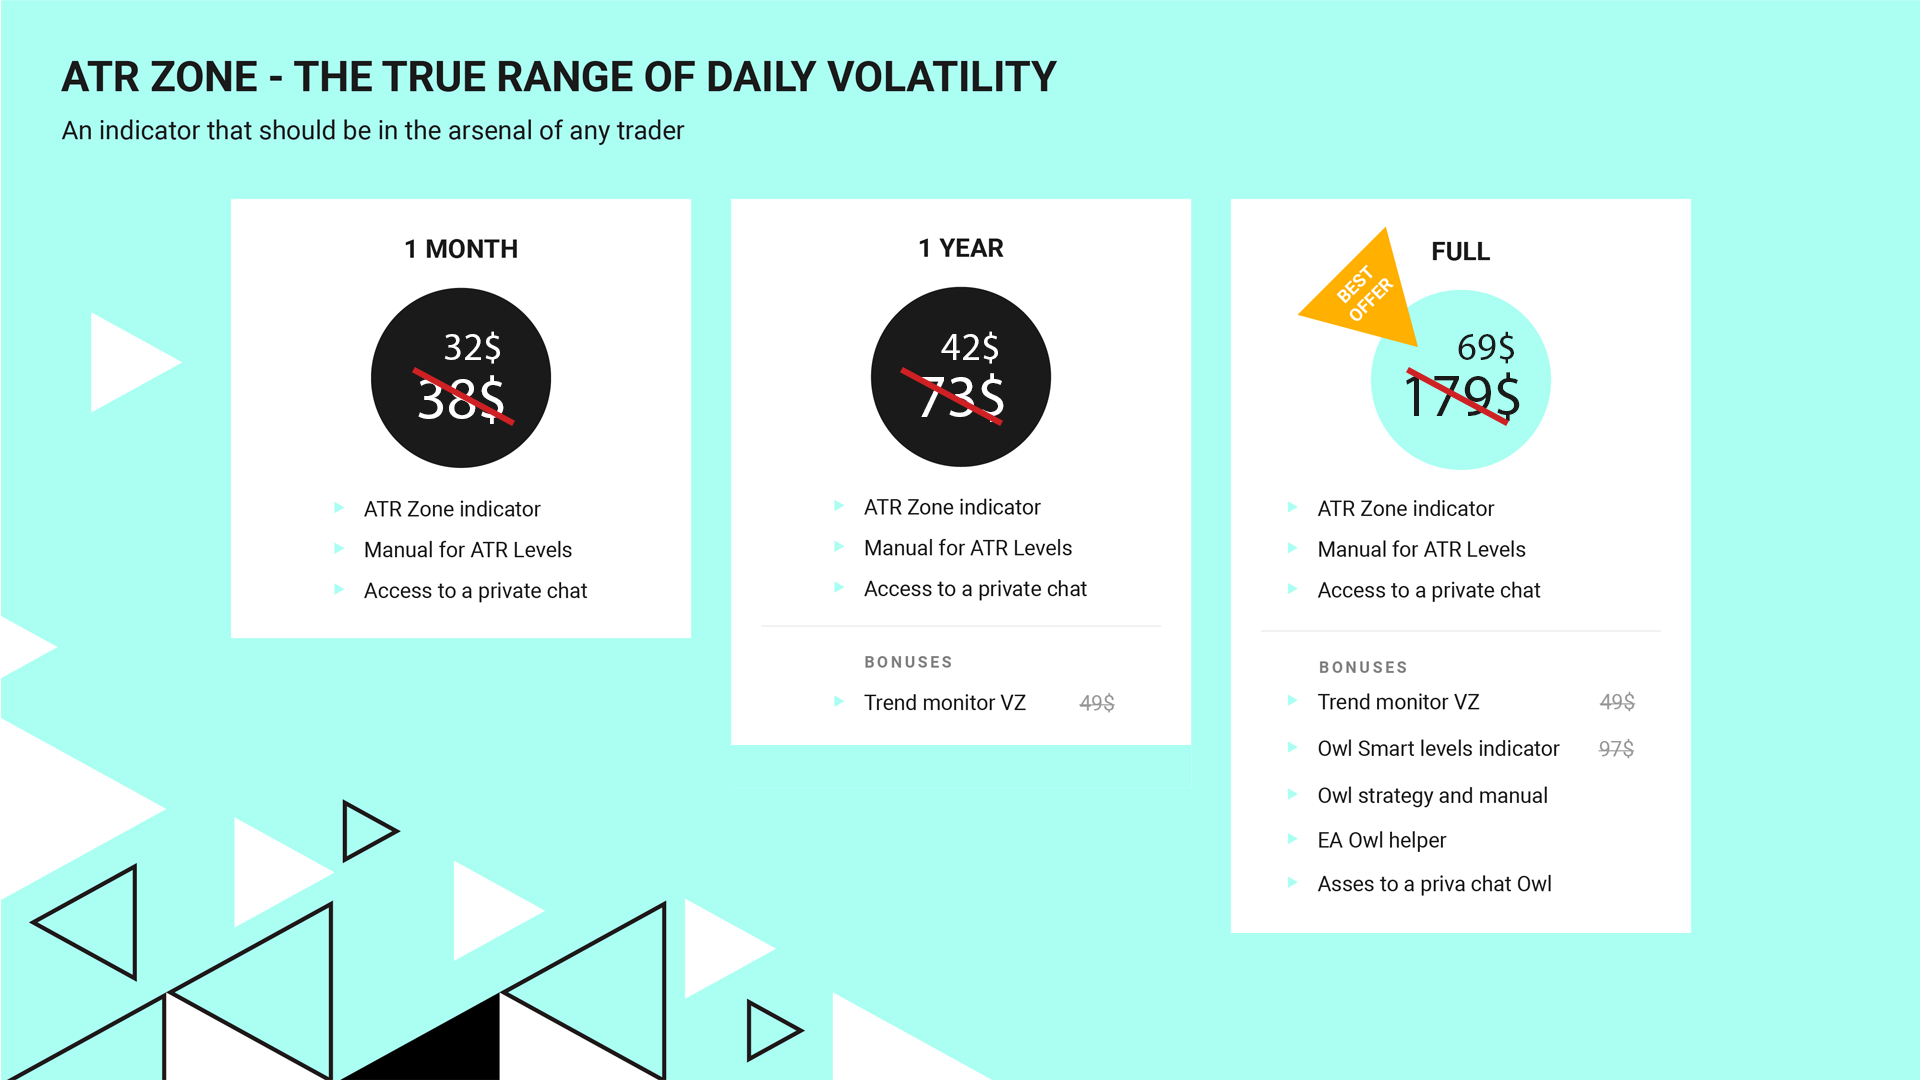
The initial price of the indicator is 63$. The price will increase every 10 sales up to 179$
The original ATR indicator is present in many trading programs. The ATR indicator is not very informative, so I modified its data and got the ATR Zone Indicator. The ATR Zone Indicator displays levels on the chart, which are more understandable and convenient for making trading decisions. In addition, I have added some important recommendations on calculating the indicator from trading guru Alexander Gerchik.
After purchase write me in private messages and you will receive:
- A manual with detailed instructions for the indicator
- Trend Monitor Indicator
- Owl Smart Levels Indicator
- Owl Helper Expert Advisor
- Access to private user chat
How does the Indicator calculate?
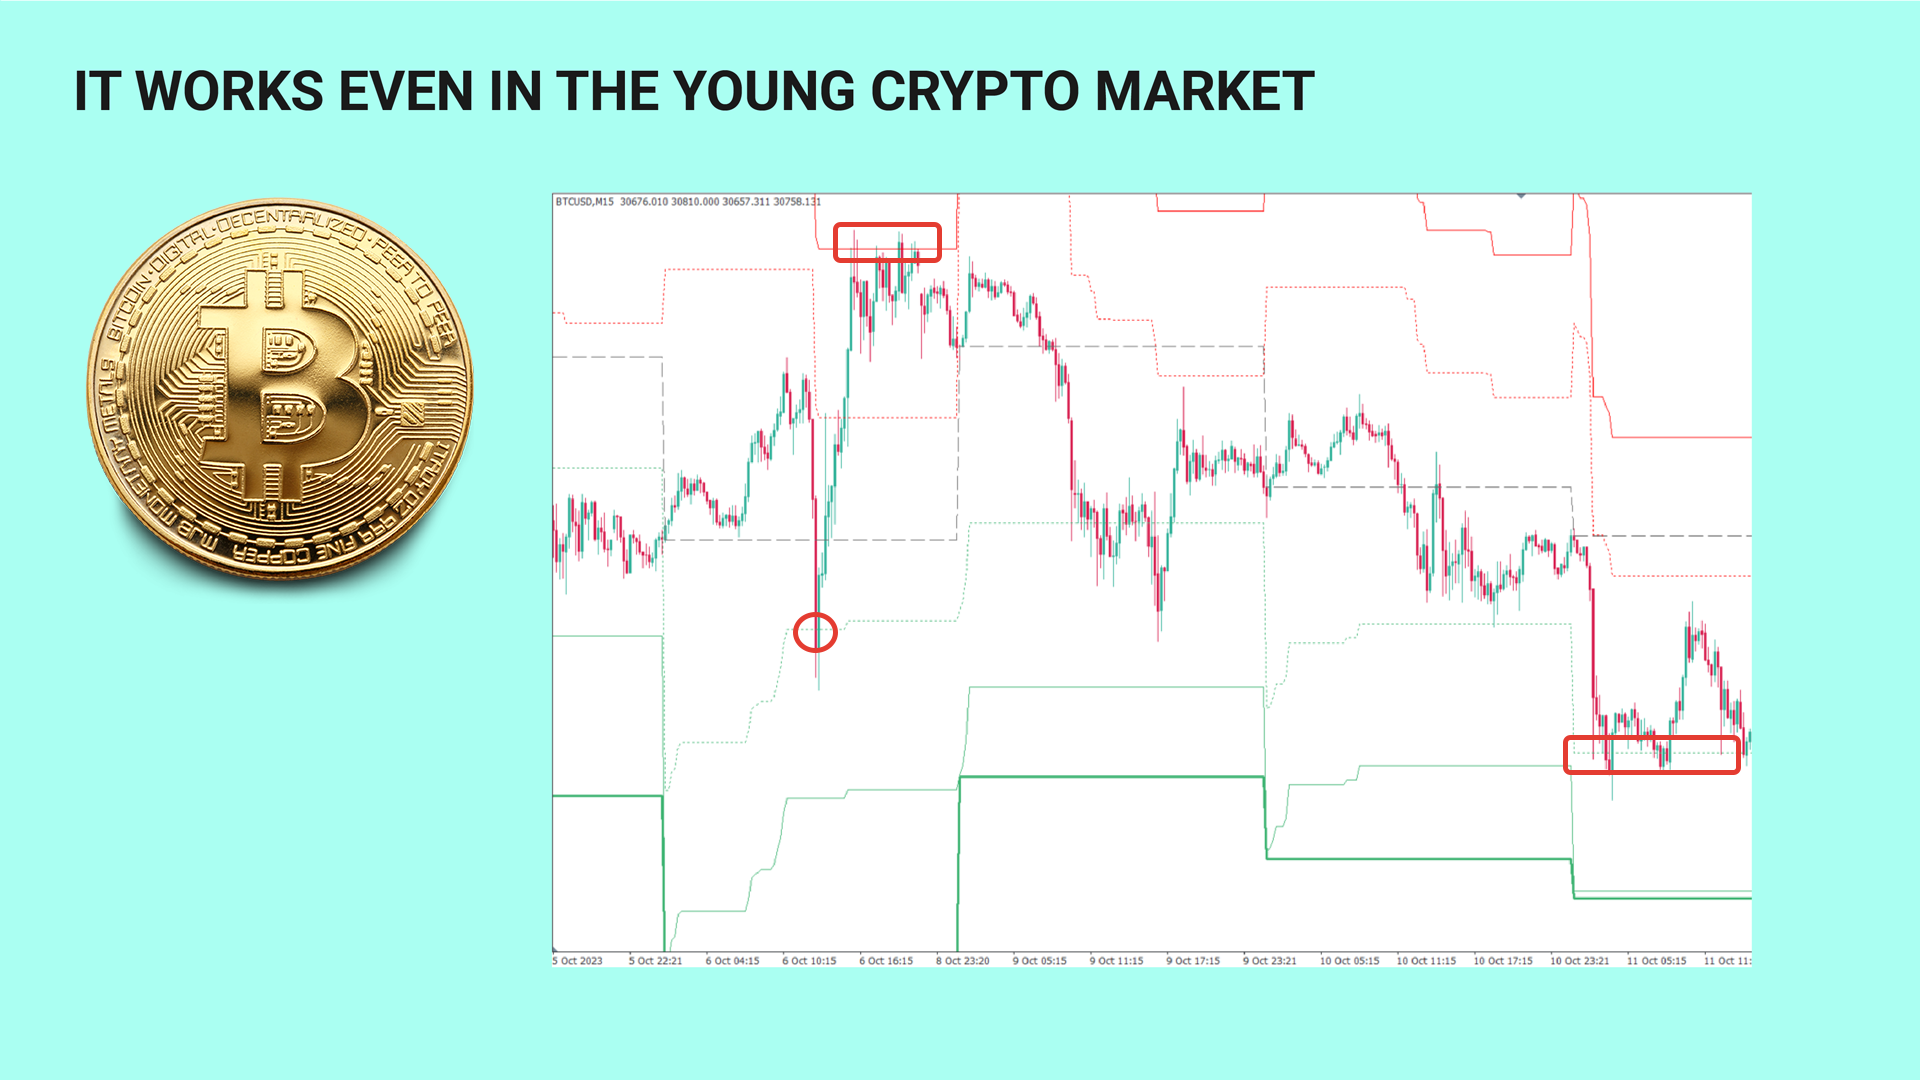
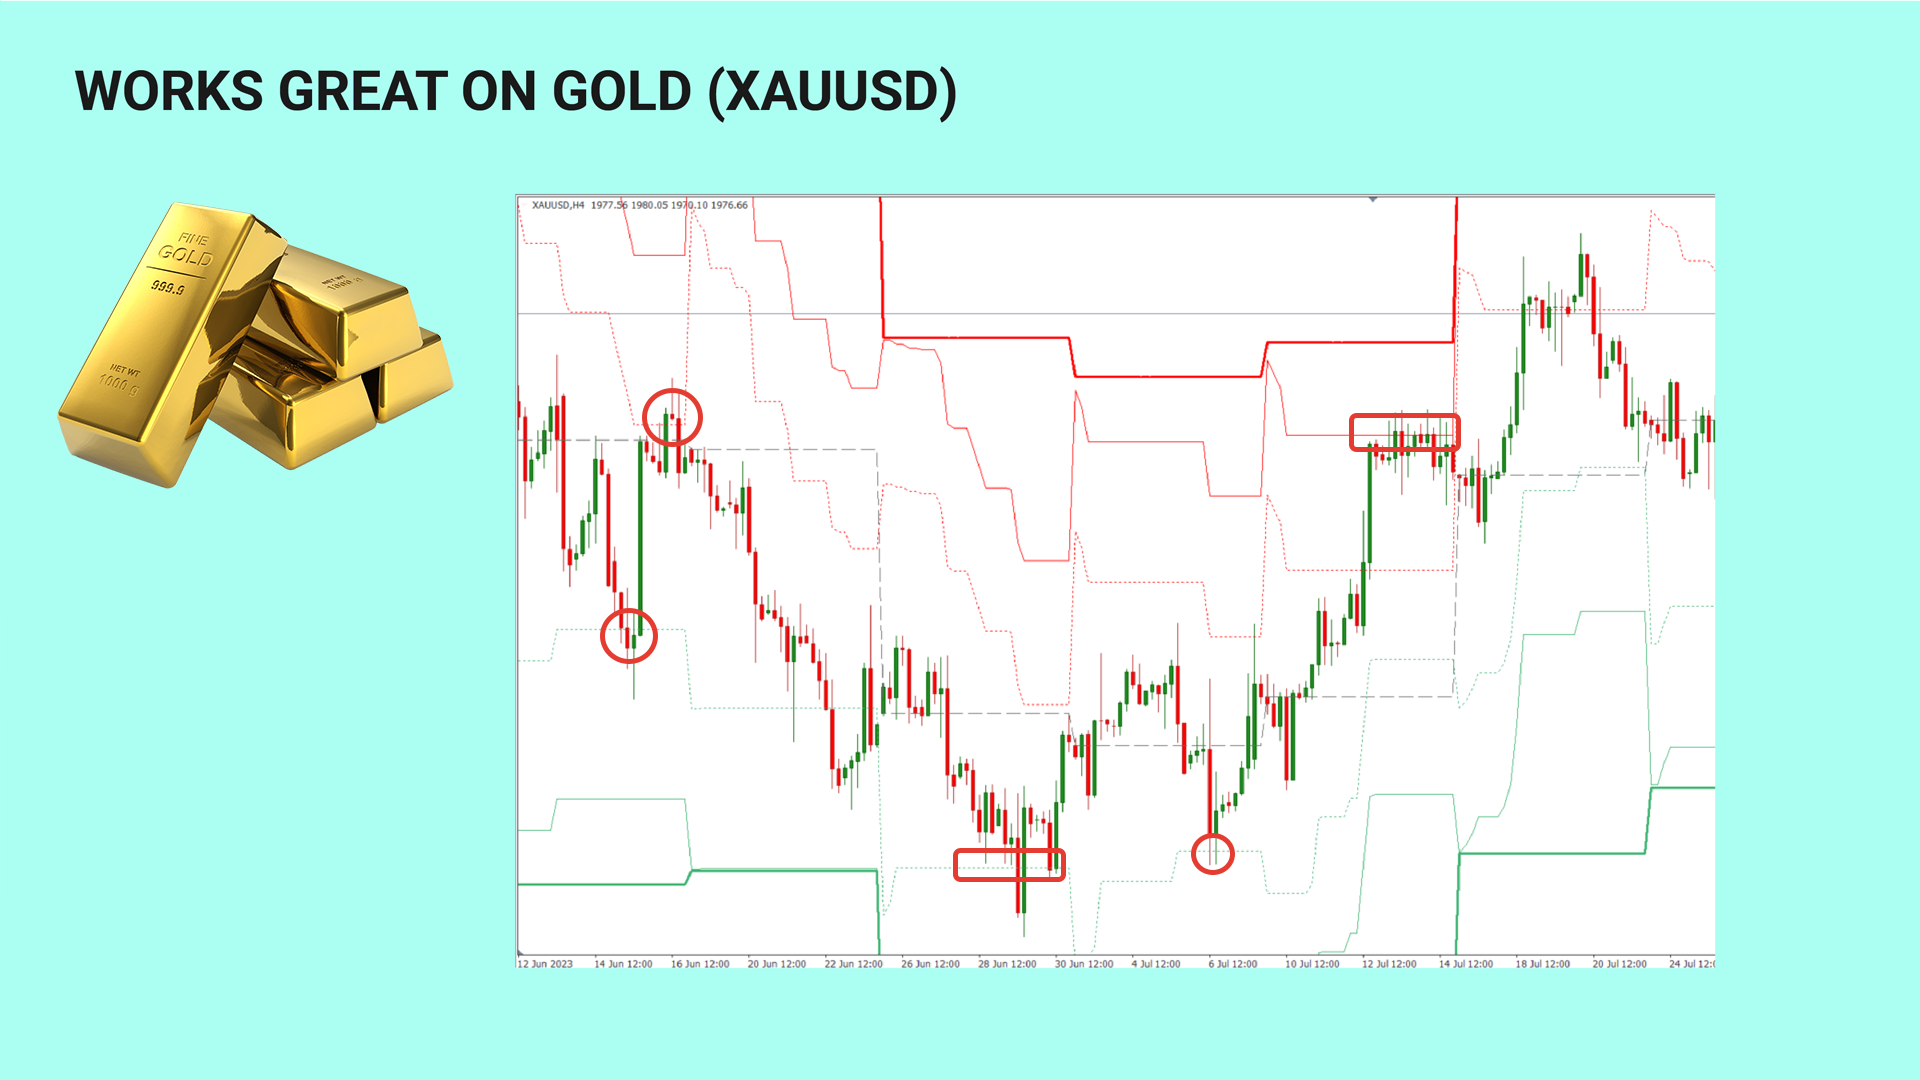
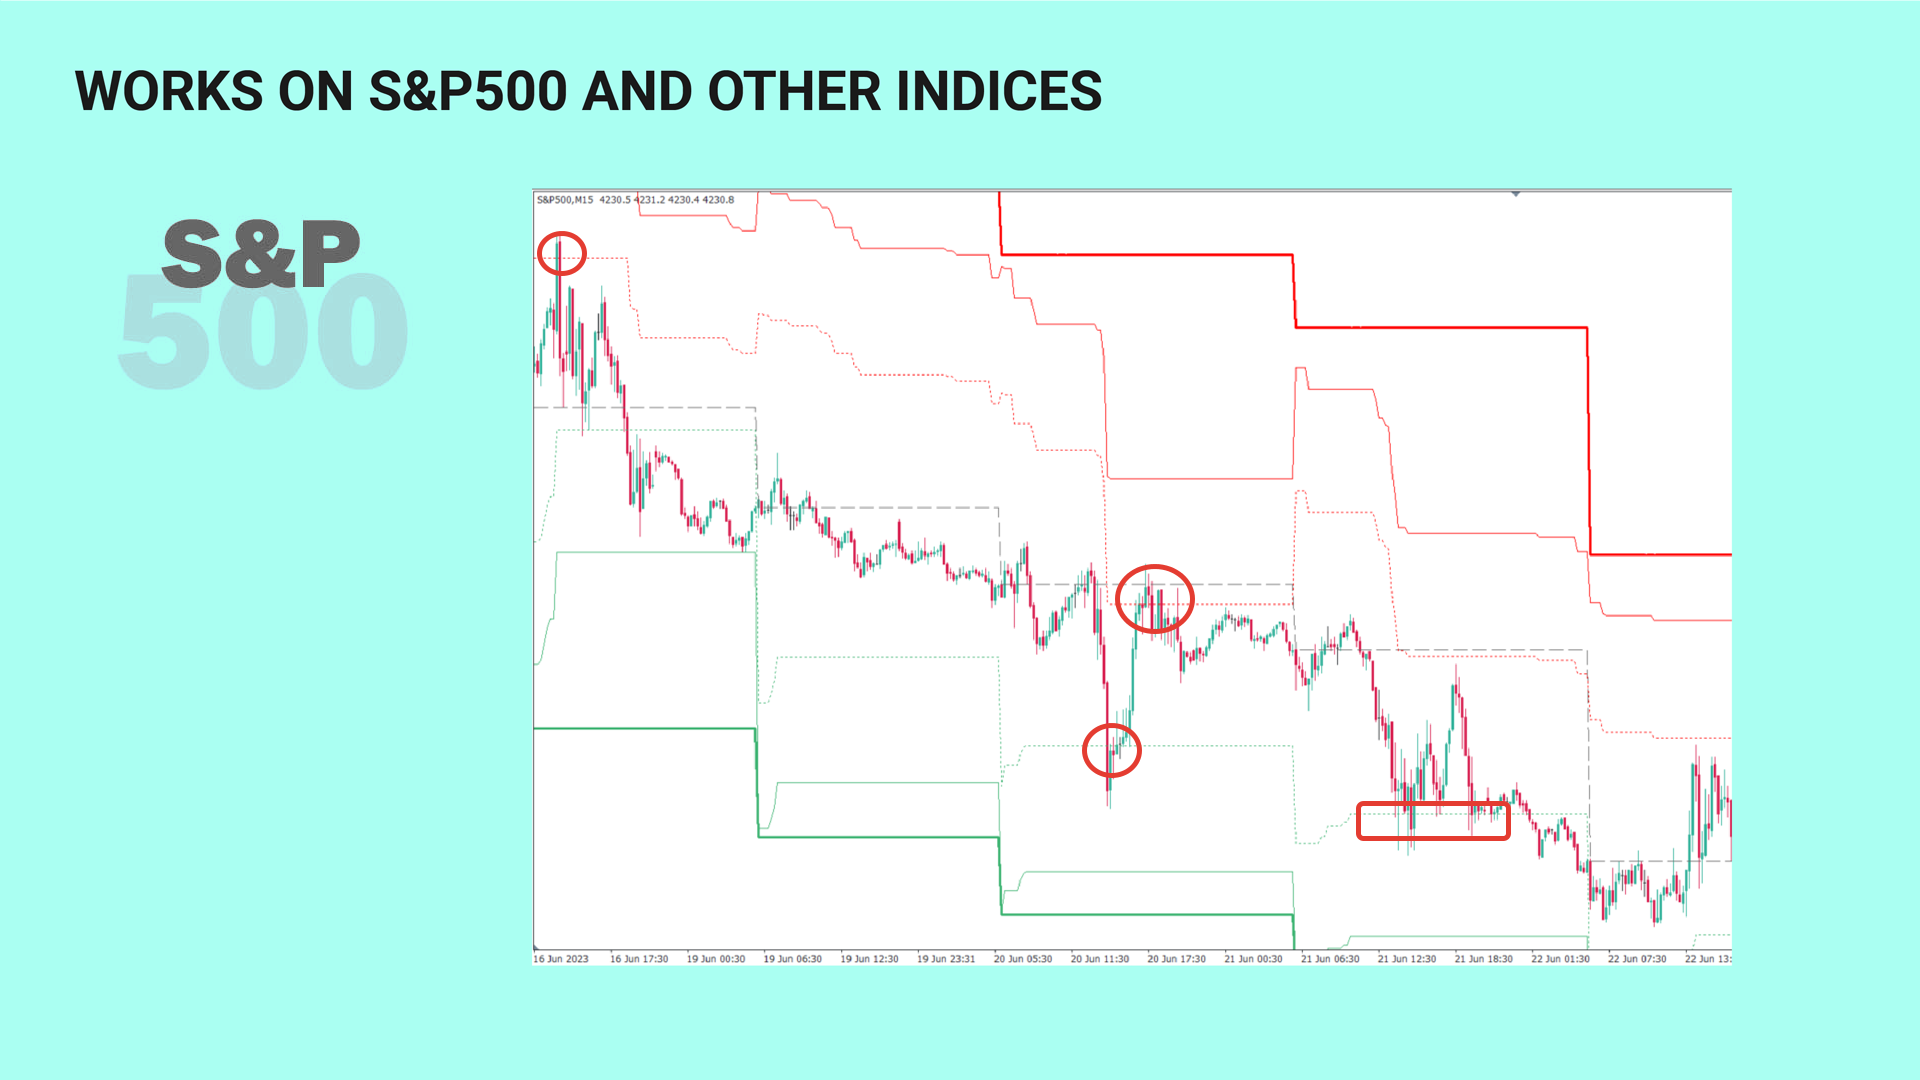
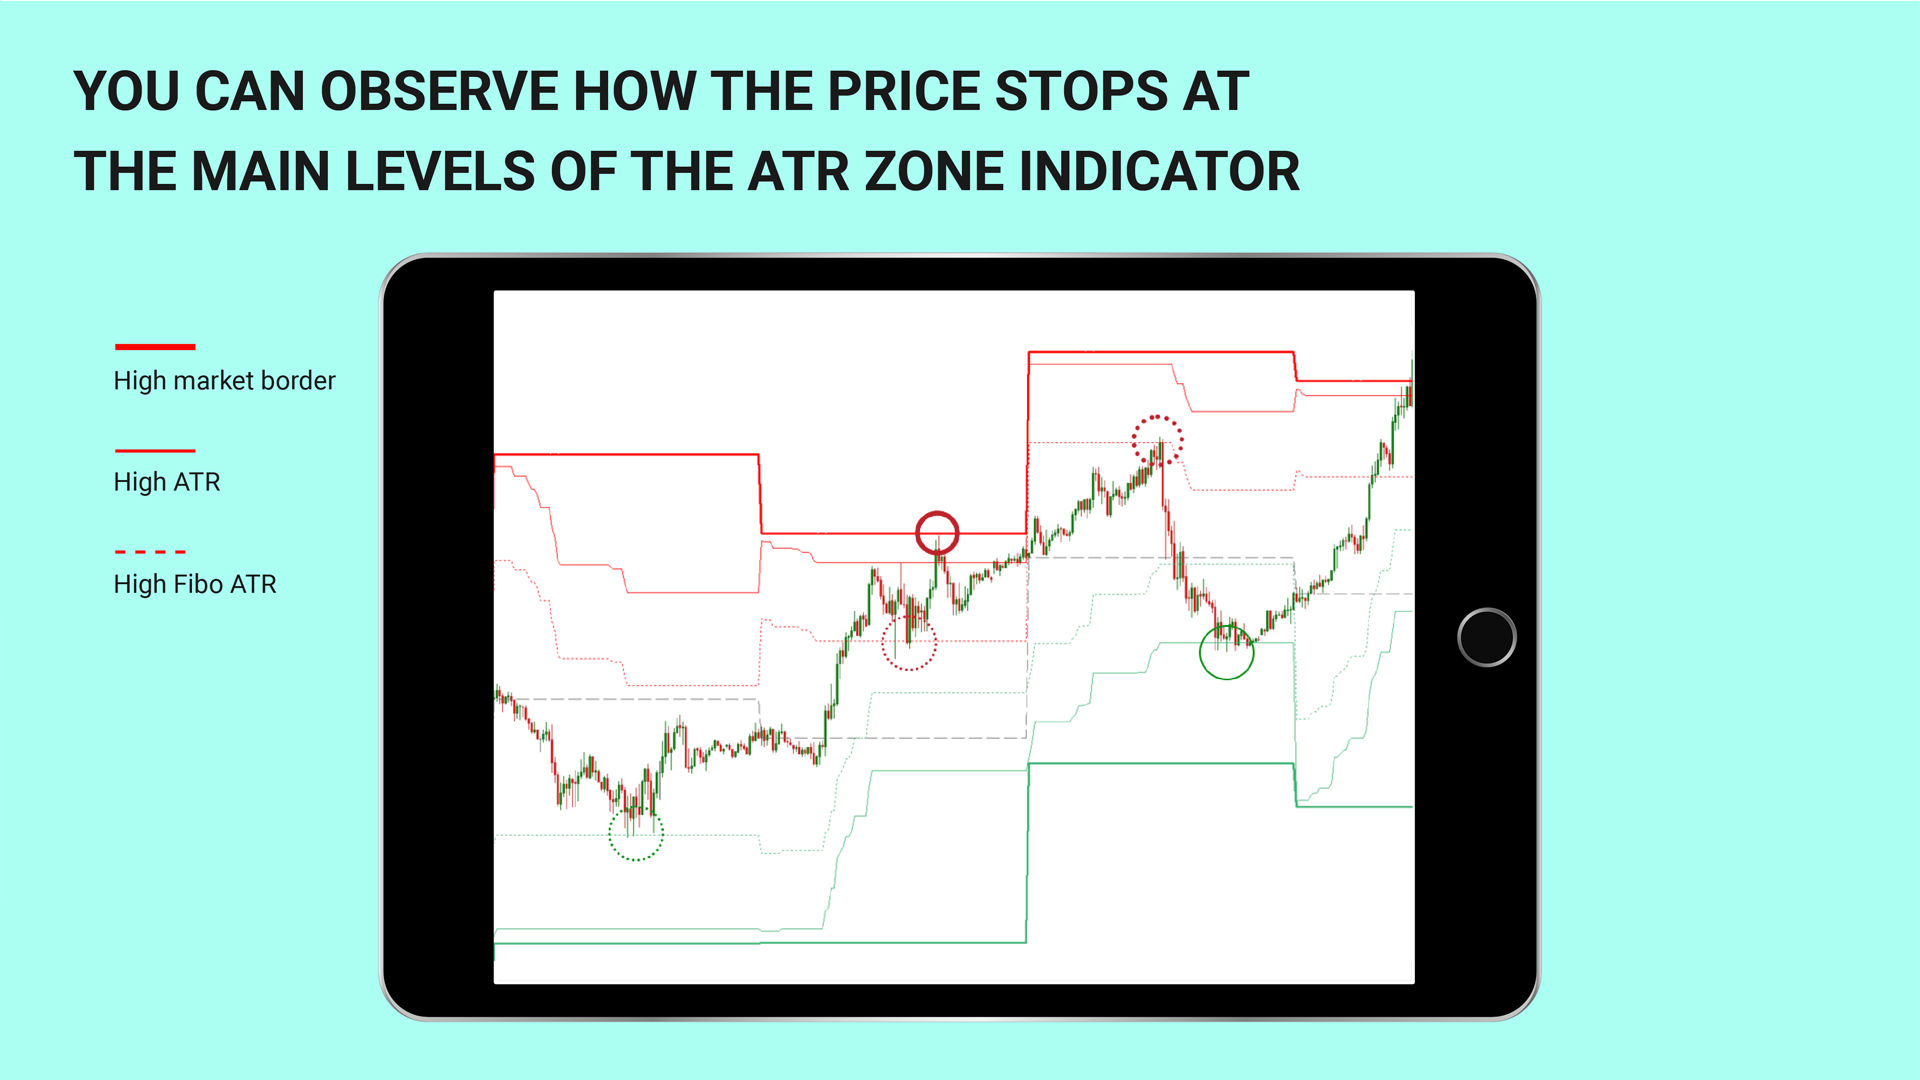
The most important indicator that we really need in intraday trading is the average daily price movement. Knowing the average daily price movement, we can set the limits (trading levels) on the chart, at which the market will lose energy. These levels are marked by the ATR Zone Indicator with bold red and green lines.
IMPORTANT!!! The ATR Zone Indicator calculates the average daily range of price movement (counts D1 candlesticks), and builds levels on a smaller timeframe.
So even on the timeframe M1, M5, M15, H1 you get the levels of the average daily range, which is more informative during intraday trading.
Earlier I talked about important additions to the indicator. Popular trader Alexander Gerchik recommends using the average value of the price movement for the last 5 days, but you should not take into account extremely large and extremely small daily bars. I listened to his recommendation and applied this rule in the ATR Zone Indicator.
Parameters of the ATR Zone Indicator.
- The beginning of the day - the beginning of the indicator countdown.
I think it is wrong to take the beginning of the countdown 00:00 hours of the current day. It is more correct to take the time of the beginning of the trading session in one of the trading zones as the starting point. In my trading I take the start time of the European trading session as the starting point.
- ATR averaging period - number of days for calculating the average value of the daily price movement
- Exclude the bar more - the coefficient of large bars, which excludes bars that are too large from the calculation of the average ATR value (value 2 means that bars, that are more than 2 times the average ATR, do not participate in the calculations).
- Exclude smaller bars - the coefficient of small bars, which excludes bars that are too small from the calculation of the average ATR value (value 0.5 means that bars, that are less than 50% of the average ATR, do not participate in the calculation)
- Fibo level - Fibonacci level for building additional levels (dotted levels)
- The number of bars to calculate - number of bars to the left to display on the chart