Vertical Volume
- 지표
- Kim Yonghwa
- 버전: 1.3
- 업데이트됨: 2 9월 2023
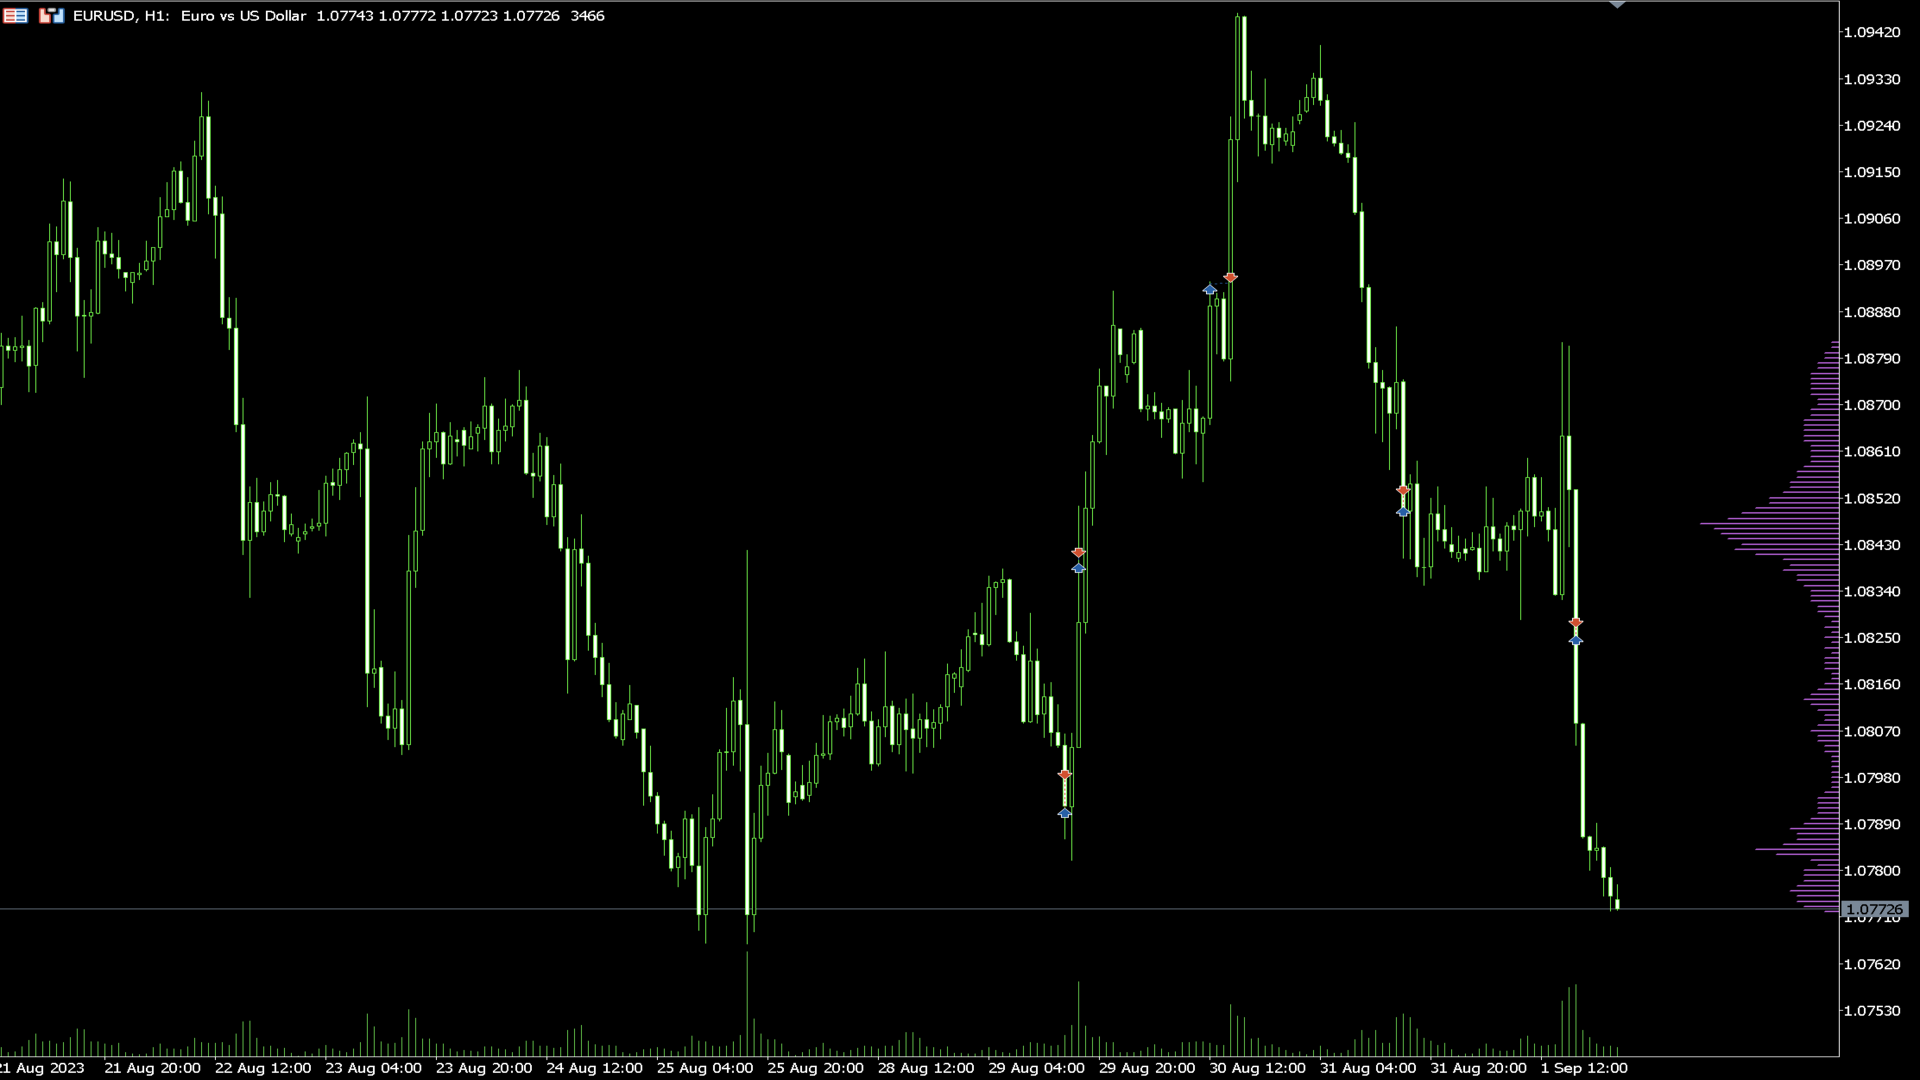
기능
- 가격에 대한 거래량 확인 지표입니다.
- 주로 EURUSD에 적용되며, 다른 통화 쌍은 작동하지 않거나 계산에 오랜 시간이 걸릴 수 있습니다.
- 원활한 사용을 위해 "차트 경계를 오른쪽 경계에서 이동" 옵션을 활성화합니다(스크린샷에 표시됨).
- 새로운 막대가 나타날 때 데이터가 재설정됩니다.
변수
- COlOR: 지표 색상 설정
- WIDTH: 지표 너비 설정
- PERIOD: 데이터 계산을 위한 기간 설정
‐----‐-------------------------------------------------------------------------------------------------------------------------------------------------


Отличный