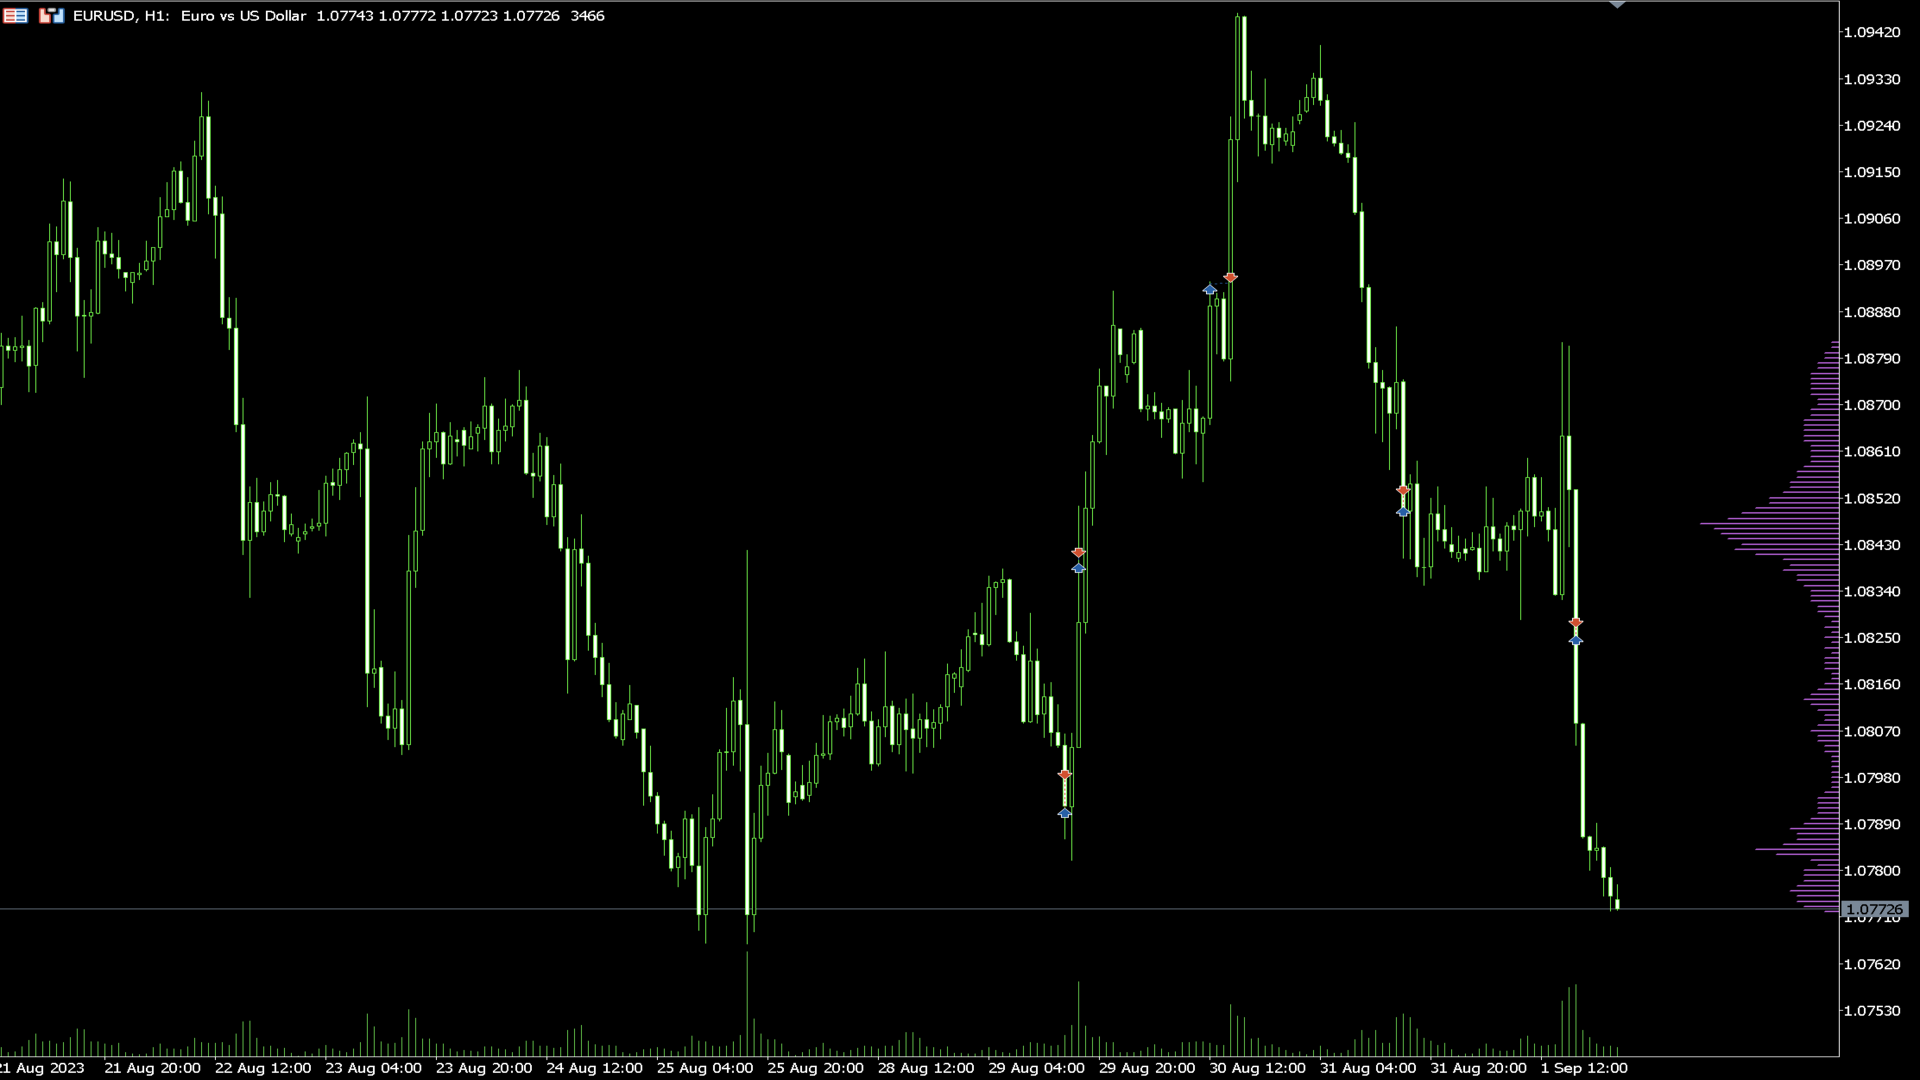
• Overview
  • Reviews (6)
  • Comments (1)
  • What's new

Vertical Volume

4.83

Features


  • Indicator for check volume for price.
  • Mainly works for EURUSD, other currency fair can be no work or calculation takes long time.
  • For smooth use, Turn on "Shift end of the chart border from right border" as shown in the screenshot
  • When apear new bar Data reset


Variables

  • COlOR : Setting of indicator color
  • WIDTH :  Setting of indicator width
  • PERIOD :  Determine the time of period for calculating data


Reviews 6
Irusel
484
Irusel 2024.10.29 21:32 
 

Отличный

ahmed fakhry
18
ahmed fakhry 2024.09.25 09:29 
 

nice

Thapa
81
Thapa 2024.06.13 10:17 
 

not bad

Recommended products
React Fibonacci Chart
Kim Yonghwa
4.91 (11)
Features Indicator for Fibonacci Retracement Trading A Fibonacci chart is drawn based on the previous bar selected among 1H, 4H, 1D, and 1W. When the market price touches the Fibonacci level, the color changes and the touch time is displayed. The Fibonacci graph is drawn at -23.6, 0, 23.6, 38.2, 50, 61.8, 76.4, 100, and 123.6 levels and the chart refreshes when the bar is updated. Variables Timeframe : A Fibonacci chart is drawn with the selected time frame among 1H, 4H, 1D, and 1W. FiboWid
FREE
Overview The Period Breakout Indicator is a versatile tool designed for traders seeking to identify breakout opportunities based on customizable time periods. This indicator automatically determines the highest and lowest prices within a user-defined period, allowing you to tailor it precisely to your trading strategy. Key Features Customizable Time Periods:   Define the start and end times based on your preferred trading hours or any specific period. The indicator will then calculate the highes
FREE
Fair Value Gap Scanner
Usiola Oluwadamilol Olagundoye
The Fair Value Gap Detector is a MetaTrader 5 indicator designed to identify and draw rectangles on the chart wherever fair value gaps (FVGs) are detected. Fair value gaps occur when there is a significant disparity between the current price and the fair value of an asset. These gaps can provide valuable insights into potential trading opportunities, as they often indicate overbought or oversold conditions in the market. Key Features: FVG Detection: The indicator utilizes a proprietary algorith
FREE
VWAP Simple
Deibson Carvalho
4.25 (28)
The Volume Weighted Average Price is similar to a moving average, except volume is included to weight the average price over a period.    Volume-Weighted Average Price [VWAP] is a dynamic, weighted average designed to more accurately reflect  a security’s true average price over a given period . Mathematically, VWAP is the summation of money (i.e., Volume x Price) transacted divided by the total volume over any time horizon, typically from market open to market close. VWAP reflects the capitali
FREE
NakaTrend
Ricardo De Andrade Nakano
2 (1)
"Introducing NakaTrend: Your Ultimate Trend Detector for MetaTrader 5! Ready to revolutionize your trading experience? Meet NakaTrend, your go-to indicator for identifying trend changes with precision and ease. With NakaTrend, you'll never miss another opportunity to capitalize on market shifts. When a bullish trend emerges, NakaTrend signals it with a green dollar sign, prompting you to enter a buy order. And when the tide turns bearish, a red dollar sign appears, signaling the perfect momen
FREE
AliPivot Points is a Meta Trader 5 Indicator that draws you the latest pivot points. You can choose from timeframes ranging from 1 Minute to 1 Month. Calculation methods for pivot points includes: Classic Pivot Points Camarilla Pivot Points Fibonacci Pivot Points Woodie Pivot Points You can personalize the line colors, style, and width to suit your preference. The indicator displays values on the right side of the chart. AliPivot Points values can also be utilized by developers for creating Expe
FREE
The selective pin bar is designed to identify reversals. To use the selective pin bar effectively, traders typically look for Strong Rejection: The tail of the pin bar should extend significantly beyond the surrounding price action. It indicates that there was a sharp rejection of higher or lower prices during the trading period. A strong rejection suggests that the market sentiment may be changing.
FREE
TickChart Indicator plots tick line on the main window of MetaTrader. In the Lite version, the number of ticks is limited to 20 and the alert function described below is omitted.  The tick-line shows the most detailed, fastest and real-time activities of the market, which are usually hidden in bars or candles longer than 1 minute. Usually, several new tick-line segments appear while a bar of M1 time frame is completed. After the release of an important economic indicator, the number of ticks per
FREE
The Pivot Indicator is a vital tool for technical analysis used by traders in the financial markets. Designed to assist in identifying potential reversal points or trend changes, this indicator provides valuable insights into key levels in the market. Key features of the Pivot Indicator include: Automatic Calculations: The Pivot Indicator automatically calculates Pivot Point, Support, and Resistance levels based on the previous period's high, low, and close prices. This eliminates the complexity
FREE
Buy and Sell Power
Marco Engstermann
4 (2)
Simple Indicator that shows the Buy and Sell volume in percent. Settings: Font size for percentage labels Horizontal offset from right edge (pixels) Vertical offset for Signal label from bottom (pixels) Vertical offset for Buy label from bottom (pixels) Vertical offset for Sell label from bottom (pixels) Color for Buy label Color for Sell label Color for Strong Buy signal Color for Buy signal Color for Strong Sell signal Color for Sell signal Color for Neutral signal Default to every tick
FREE
Support Resistance Indicator The "Support Resistance" indicator is a versatile tool designed to help traders identify key support and resistance levels based on an underlying algorithm. These levels indicate price points where an asset historically experiences buying (support) or selling (resistance) pressure. The indicator allows traders to visualize these levels on their charts, making it easier to make informed decisions. All Products   |   Contact PARAMETERS: Timeframe : Users can select the
FREE
Standard PVSR
Ashok Kumar Singha
Standard PVSR is based on Pivot Points. Steps to Setup the Indicator: Install the Custom Indicator; Set all the Lines Color, Width and Styles; Set visualization to All Timeframe; and DONE It can be used for: All Pairs: Forex, Cryptocurrencies, Metals, Stocks, Indices etc. All Timeframe All Brokers All type of Trading Style like Scalping, Swing, Intraday, Short-Term, Long-Term etc. Multiple Chart -->> For any Type of Support, Guidance, Setup Issue, EA Optimization, Input Setup etc. etc
FREE
SMC Structure Markup
Seyed Mohammad Hosseini Hejazi
5 (6)
Overview The Smart Money Structure Markup Indicator for MetaTrader 5 is a powerful tool designed to help traders identify key market structures based on popular Smart Money Concepts (SMC) strategies. This indicator detects micro-market structures, providing insights into price movements and potential trend changes. It highlights important elements such as valid Break of Structure (BOS), Change of Character (CHoCH), and Inducement (IDM), helping traders to make informed decisions. Key Features Ma
FREE
Amiguinhos Bar Counter
Eduardo Correia Da Silva
3.67 (3)
Amiguinho's Bar Counter is a price action indicator to display the bar count (candles) with some interesting options. About the "Period of analysis" parameter: if the current timeframe is in minutes, then the analysis period will be considered in days; if the current timeframe is in days, then the analysis period will be considered in months; or  if the period of analysis will be considered in years.
FREE
Reclaimed Order Block ICT Indicator MT5 Built upon the ICT trading principles, the Reclaimed Order Block ICT Indicator MT5 for MetaTrader 5 pinpoints essential price areas where an order block is initially breached, leading to a structural shift and the formation of a new trend. As the price revisits these levels post-breakout, the indicator generates strategic buy and sell signals, assisting traders in making data-driven decisions. «Indicator Installation & User Guide» MT5 Indicator Installatio
FREE
QuantumAlert RSI Navigator is a free indicator available for MT4/MT5 platforms, its work is to provide "alerts" when the market is inside "overbought and oversold" regions in the form of "buy or sell" signals. This indicator comes with many customization options mentioned in the parameter section below, user can customise these parameters as needful. Join our MQL5 group , where we share important news and updates. You are also welcome to join our private channel as well, contact me for the priva
FREE
This EA is named Dinosaur Hunter(DH) because it can capture very large trend, such as 5000-10000 pips. DH trades infrequently as it patiently waits for the right market conditions. DH can load multiple currency pairs on a single chart to increase the number of trades. Live Signal This is a demo version that only for fixed lot size of 0.01. To obtain the full version, please purchase Dinosaur Hunter Pro . This EA has been tested from 2015 to the present. The test used data from Dukascopy. If yo
FREE
Large Price MT5
Nino Guevara Ruwano
For traders, monitoring price movements is a constant activity, because each price movement determines the action that must be taken next. This simple indicator will helps traders to display prices more clearly in a larger size. Users can set the font size and choose the color that will be displayed on the chart. There are three color options that can be selected to be displayed on the chart.
FREE
RSI Chart Levels
Nikolay Mitrofanov
5 (5)
The indicator draws levels based on the overbought and oversold values ​​of the RSI indicator. The maximum values ​​are taken into account, which are equal to or exceeded certain limits. That is, for example, when the price has gone into the overbought zone, the highest price is selected from all prices in this zone for this period of time, and as soon as the indicator value returns to a value below the overbought value, the level is fixed and the calculation of new values ​​begins. The same
FREE
Highly configurable Average True Range (ATR) indicator. Features: Highly customizable alert functions (at levels, crosses, direction changes via email, push, sound, popup) Multi timeframe ability Color customization (at levels, crosses, direction changes) Linear interpolation and histogram mode options Works on strategy tester in multi timeframe mode (at weekend without ticks also) Adjustable Levels Parameters: ATR Timeframe: You can set the lower/higher timeframes for ATR. ATR Bar Shift: you
FREE
MT Monster
MASSINISSA AINOUZ
This EA has been backtested with real ticks since January 2012 untill March 2025, with no delay in execution, and then with a delay of 1000ms, the backtest showed a drawdown of 30% with a 10k USD backtest account. The EA default parameters are optimised to work best on EURUSD pair, but can work on other currencies and metals like XAUUSD. Before using this EA and in order to not lose all your money make sure you have at least 5000USD in your account. Do not use another EA with this one on the sam
Value Chart Candlesticks
Flavio Javier Jarabeck
4.73 (11)
The idea of a Value Chart indicator was presented in the very good book I read back in 2020 , " Dynamic Trading Indicators: Winning with Value Charts and Price Action Profile ", from the authors Mark Helweg and David Stendahl. The idea is simple and the result is pure genius: Present candlestick Price analysis in a detrended way! HOW TO READ THIS INDICATOR Look for Overbought and Oversold levels. Of course, you will need to test the settings a lot to find the "correct" one for your approach. It
FREE
Pivot Point Supertrend (corresponds to Pivot Point Super Trend indicator from Trading View) Pivot Point Period:    Pivot point defined as highest high and highest low... input 2 = defining highest high and highest low with 2 bars on each side which are lower (for highest high) and are higher (for lowest low calculation) ATR Length  : the  ATR  calculation is based on 10 periods ATR Factor: ATR multiplied by 3
FREE
Aroon Indicator Classic
Fernando Lahude Ritter
The Aroon indicator measures the time since price highs and lows over a set period. It outputs two lines, Aroon Up and Aroon Down. Aroon Up shows how long it has been since a recent high occurred. Aroon Down shows how long it has been since a recent low occurred. When Aroon Up stays close to 100 and Aroon Down stays near 0, it suggests an upward trend. When Aroon Down is near 100 and Aroon Up is near 0, it suggests a downward trend. The closer each line is to 100, the stronger the recent trend i
FREE
My Candle Patterns
Francisco Gomes Da Silva
5 (1)
This indicator is a demo version of the complete My candle, which can be downloaded here: Candle Patterns Creator With the full version, you can create your own candle rules and modify a traditional candle pattern to be more accurate according to your strategy. The indicator includes several example candle rules, but here I will demonstrate only a few: Pattern Rule Candle Green C > O Candle Red C < O Doji C = O Hammer (C > O and (C-O) *2 < O-L and (C-O) *0.5 > H-C) or (C < O and (O-C) *2 < C-L a
FREE
This indicator is stand alone version from  MP Pivot Levels  (All in one) containing Woodie Pivots. Woodie’s pivot points are made up of multiple key levels, calculated from past price points, in order to frame trades in a simplistic manner. The key levels include the ‘pivot’ itself, and multiple support and resistance levels (usually up to three each). Traders use these levels as a guide for future price movements when setting up trades. The pivot : (Previous high + previous low + 2 x previous
FREE
Camarilla Swing Trade Indicator is an Indicator. Support and resistance points are calculated from the High Low Close of the previous TF Week's price. What are Camarilla Pivot Points? 1.Camarilla Pivot Points is a modified version of the classic Pivot Point. 2.Camarilla Pivot Points was launched in 1989 by Nick Scott, a successful bond trader. 3.The basic idea behind Camarilla Pivot Points is that price tends to revert to its mean until it doesn't. 4.Camarilla Pivot Points is a mathematical pr
FREE
Basic Vwap
james mugendi
Simple Vwap with the daily, weekly and monthly VWAP is the abbreviation for   volume-weighted average price , which is a technical analysis tool that shows the ratio of an asset's price to its total trade volume. It provides traders and investors with a measure of the average price at which a stock is traded over a given period of time. How it's used Identify entry and exit points:   Traders can use VWAP to determine when to buy or sell an asset.   Understand price trends :  Traders can use V
FREE
Daily VWAP
Riccardo Moreo
5 (3)
This is the Volume Avarage Weighted Price (VWAP) it's a indicator that shows where is the avarage of the current volumes and the levels at which the price is considered premium, above the second upper band, or discount, under the second lower band, it's also very usefull to use the VWAP level as a target for operations since it's a very liquid level so the price it's attracted to it. feel free to leave a feedback either positive or negative based on your expereince with this indicator, enjoy the
FREE
Simple Weis Wave
Jean Jacques Huve Ribeiro
3.67 (3)
One of the best tools for analyzing volume, Weis Wave was idelized by David Weis, to facilitate the reading of directional flow. For the VSA method disciples it is an evolution of the practices created by Richard Wycoff, facilitating a predictive reading of the market, always seeking an accumulation and distribution of the negotiated contracts. Cumulative wave volume  Range of wave ( removed) Average Wave volume Ref "Tim Ord lectures" ( removed)
FREE
Buyers of this product also purchase
Trend Screener Pro MT5
STE S.S.COMPANY
4.85 (82)
Unlock the Power of Trends Trading with the Trend Screener Indicator: Your Ultimate Trend Trading Solution powered by Fuzzy Logic and Multi-Currencies System! Elevate your trading game with the Trend Screener, the revolutionary trend indicator designed to transform your Metatrader into a powerful Trend Analyzer. This comprehensive tool leverages fuzzy logic and integrates over 13 premium features and three trading strategies, offering unmatched precision and versatility. LIMITED TIME OFFER : Tre
Divergence Bomber
Ihor Otkydach
5 (4)
Each buyer of this indicator also receives the following for free: The custom utility "Bomber Utility", which automatically manages every trade, sets Stop Loss and Take Profit levels, and closes trades according to the rules of this strategy Set files for configuring the indicator for various assets Set files for configuring Bomber Utility in the following modes: "Minimum Risk", "Balanced Risk", and "Wait-and-See Strategy" A step-by-step video manual to help you quickly install, configure, and s
Golden Trend Indicator MT5
Noha Mohamed Fathy Younes Badr
4.89 (18)
Golden Trend indicator  is The best indicator for predicting trend movement this indicator never lags and never repaints and never back paints    and give  arrow buy and sell    before the candle appear  and it will help you and  will make your trading decisions clearer its work on all currencies and  gold and crypto and all time frame This unique  indicator uses very secret algorithms to catch the  trends, so you can trade using this indicator and see the trend clear on charts  manual guide and
NOTE: CYCLEMAESTRO is distributed only on this website, there are no other distributors. Demo version is for reference only and is not supported. Full versione is perfectly functional and it is supported. CYCLEMAESTRO , the first and only indicator of Cyclic Analysis, useful for giving signals of TRADING, BUY, SELL, STOP LOSS, ADDING. Created on the logic of   Serghei Istrati   and programmed by   Stefano Frisetti ;   CYCLEMAESTRO   is not an indicator like the others, the challenge was to inter
Algo Pumping
Ihor Otkydach
5 (11)
PUMPING STATION – Your Personal All-inclusive strategy Introducing PUMPING STATION — a revolutionary Forex indicator that will transform your trading into an exciting and effective activity! This indicator is not just an assistant but a full-fledged trading system with powerful algorithms that will help you start trading more stable! When you purchase this product, you also get FOR FREE: Exclusive Set Files: For automatic setup and maximum performance. Step-by-step video manual: Learn how to tr
MonetTrend — Премиум-индикатор для торговли по тренду (M30, H1, H4) MonetTrend — это мощный и визуально понятный трендовый индикатор, созданный для торговли на таймфреймах M30, H1 и H4. Он идеально подходит для работы с волатильными инструментами, такими как: • Золото (XAUUSD) • Криптовалюты (BTCUSD) • Валютные пары (EURUSD, USDJPY и др.) Ключевые особенности MonetTrend: • Автоматическое отображение Take Profit 1 (TP1) и Stop Loss (SL): После появления сигнала индикатор сразу показывает: • TP
TPSproTREND PrO MT5
Roman Podpora
4.72 (18)
Entry points at the bar close,  without redrawing .  Trend scanner  across all assets,  MTF - mode  and much more in one tool. We recommend using it together with   RFI LEVELS. ИНСТРУКЦИЯ RUS   /   INSTRUCTIONS  ENG         /         VERSION MT4   Main functions: Accurate entry signals WITHOUT REPAINTING! Once a signal appears, it remains valid! This is a significant distinction from repainting indicators that might provide a signal and then alter it, potentially leading to deposit losses. Now,
RelicusRoad Pro MT5
Relicus LLC
4.79 (19)
How many times have you bought a trading indicator with great back-tests, live account performance proof with fantastic numbers and stats all over the place but after using it, you end up blowing your account? You shouldn't trust a signal by itself, you need to know why it appeared in the first place, and that's what RelicusRoad Pro does best! User Manual + Strategies + Training Videos + Private Group with VIP Access + Mobile Version Available A New Way To Look At The Market RelicusRoad is th
Support And Resistance Screener Breakthrough unique Solution With All Important levels analyzer and Markets Structures Feature Built Inside One Tool ! Our indicator has been developed by traders for traders and with one Indicator you will find all Imporant market levels with one click. LIMITED TIME OFFER : Support and Resistance Screener Indicator is available for only 50 $ and lifetime. ( Original price 125$ ) (offer extended) The available tools ( Features ) in our Indicator are :  1. HH-LL S
Quantum TrendPulse
Bogdan Ion Puscasu
5 (13)
Introducing Quantum TrendPulse , the ultimate trading tool that combines the power of SuperTrend , RSI , and Stochastic into one comprehensive indicator to maximize your trading potential. Designed for traders who seek precision and efficiency, this indicator helps you identify market trends, momentum shifts, and optimal entry and exit points with confidence. Key Features: SuperTrend Integration: Easily follow the prevailing market trend and ride the wave of profitability. RSI Precision: Detect
Gold Stuff mt5
Vasiliy Strukov
4.93 (178)
Gold Stuff mt5 is a trend indicator designed specifically for gold and can also be used on any financial instrument. The indicator does not redraw and does not lag. Recommended time frame H1. Contact me immediately after the purchase to get   personal bonus!  You can get a free copy of our Strong Support and Trend Scanner indicator, please pm. me! Settings  and manual   here  Please note that I do not sell my EA's or special sets on telegram, it is only available on Mql5 and my set files are on
FX Power MT5 NG
Daniel Stein
5 (15)
FX Power: Analyze Currency Strength for Smarter Trading Decisions Overview FX Power is your go-to tool for understanding the real strength of currencies and Gold in any market condition. By identifying strong currencies to buy and weak ones to sell, FX Power simplifies trading decisions and uncovers high-probability opportunities. Whether you’re looking to follow trends or anticipate reversals using extreme delta values, this tool adapts seamlessly to your trading style. Don’t just trade—trade
TPSpro RFI Levels MT5
Roman Podpora
4.55 (20)
Reversal zones / Peak volumes / Active zones of a major player =  TS TPSPROSYSTEM INSTRUCTIONS RUS  /  INSTRUCTIONS   ENG          /       Version MT4 Every buyer of this indicator additionally receives FREE: 3 months of access to trading signals from the RFI SIGNALS service - ready-made entry points according to the TPSproSYSTEM algorithm. Training materials with regular updates - immerse yourself in strategy and grow your professional level. 24/5 support on weekdays and access to a closed tra
FX Levels MT5
Daniel Stein
5 (4)
FX Levels: Exceptionally Accurate Support & Resistance for All Markets Quick Overview Looking for a reliable way to pinpoint support and resistance levels across any market—currencies, indices, stocks, or commodities? FX Levels merges our traditional “Lighthouse” method with a forward-thinking dynamic approach, offering near-universal accuracy. By drawing from real-world broker experience and automated daily plus real-time updates, FX Levels helps you identify reversal points, set profit targe
MONEYTRON – ТВОЙ ЛИЧНЫЙ СИГНАЛ НА УСПЕХ! XAUUSD | AUDUSD | USDJPY | BTCUSD Поддержка таймфреймов: M5, M15, M30, H1 Почему трейдеры выбирают Moneytron? 82% успешных сделок — это не просто цифры, это результат продуманной логики, точного алгоритма и настоящей силы анализа. Автоматические сигналы на вход — не нужно гадать: когда покупать, когда продавать. 3 уровня Take Profit — ты сам выбираешь свой уровень прибыли: безопасный, уверенный или максимум. Четкий Stop Loss — контролируешь риск
Atomic Analyst MT5
Issam Kassas
4.32 (19)
First of all Its worth emphasizing here that this Trading Indicator is   Non-Repainting   , Non Redrawing and Non Lagging Indicator   Indicator, Which makes it ideal from both manual and robot trading.  User manual: settings, inputs and strategy . The Atomic Analyst  is a PA Price Action Indicator that uses Strength and Momentum of the price to find a better edge in the market. Equipped with Advanced filters which help remove noises and false signals, and Increase Trading Potential. Using Multi
FX Volume MT5
Daniel Stein
4.82 (17)
FX Volume: Experience Genuine Market Sentiment from a Broker’s Perspective Quick Overview Looking to elevate your trading approach? FX Volume provides real-time insights into how retail traders and brokers are positioned—long before delayed reports like the COT. Whether you’re aiming for consistent gains or simply want a deeper edge in the markets, FX Volume helps you spot major imbalances, confirm breakouts, and refine your risk management. Get started now and see how genuine volume data can
FourAverageMT5
Mikhail Sergeev
5 (2)
FourAverage is a new word in trend detection. With the development of information technology and a large number of participants, financial markets are becoming less amenable to analysis by outdated indicators. Conventional technical analysis tools, such as a Moving Average or Stochastic, in their pure form are not able to determine the direction of a trend or its reversal. Can one indicator indicate the correct direction of the future price, without changing its parameters, based on the history
***  Entry In The Zone and SMC Multi Timeframe is a realtime market analysis tool based on the Smart Money Concept (SMC). It effectively integrates reversal signals and automatically identifies key reversal zones through Multi Timeframe Structure Detection, along with the identification of Points of Interest (POI). This tool is designed to help traders plan and make decisions with greater confidence and a more structured approach. *** Features include : - Automated market structure detection (B
Matrix Arrow Indicator MT5
Juvenille Emperor Limited
5 (13)
Matrix Arrow Indicator MT5  is a unique 10 in 1 trend following   100% non-repainting  multi-timeframe indicator that can be used on all symbols/instruments:   forex,   commodities,   cryptocurrencies,   indices,   stocks .  Matrix Arrow Indicator MT5  will determine the current trend at its early stages, gathering information and data from up to 10 standard indicators, which are: Average Directional Movement Index (ADX) Commodity Channel Index (CCI) Classic Heiken Ashi candles Moving Average
MetaForecast M5
Vahidreza Heidar Gholami
5 (3)
MetaForecast predicts and visualizes the future of any market using different powerful methods. While financial markets are not always predictable, if there are patterns in the past data, MetaForecast can learn and predict the future as accurately as possible. It features a complete implementation of neural networks embedded directly into the indicator, enabling traders to create and train AI models using data from multiple symbols to learn complex patterns. MetaForecast leverages your computer'
CBT Quantum Maverick High-Efficiency Binary Trading System CBT Quantum Maverick is a finely tuned, high-performance Binary Options Trading System designed for traders seeking precision, simplicity, non-repaint signals and disciplined trading. No customization is required—this system is optimized for effective results right out of the box. Simply follow the signals, which can be mastered with a bit of practice. Key Features: Signal Precision: New-bar-based trading signals—targeting the next ca
Best Solution for any Newbie or Expert Trader! This Indicator is a unique, high quality and affordable trading tool because we have incorporated a number of proprietary features and a new formula. With only ONE chart you can read Currency Strength for 28 Forex pairs! Imagine how your trading will improve because you are able to pinpoint the exact trigger point of a new trend or scalping opportunity? User manual:   click here That's the first one, the original! Don't buy a worthless wannabe clone
Gold Trend 5
Sergei Linskii
3.5 (2)
Gold Trend - this is a good stock technical indicator. The indicator algorithm analyzes the price movement of an asset and reflects volatility and potential entry zones. The best indicator signals: For SELL = red histogram + red SHORT pointer + yellow signal arrow in the same direction. For BUY = blue histogram + blue LONG pointer + aqua signal arrow in the same direction. Benefits of the indicator: The indicator produces signals with high accuracy. A confirmed arrow signal can only be redrawn
Auto Order Block with break of structure based on ICT and Smart Money Concepts (SMC) Futures Break of Structure ( BoS )             Order block ( OB )            Higher time frame Order block / Point of Interest ( POI )    shown on current chart           Fair value Gap ( FVG ) / Imbalance   -  MTF      ( Multi Time Frame )    HH/LL/HL/LH  -  MTF      ( Multi Time Frame )  Choch  MTF      ( Multi Time Frame )  Volume Imbalance     ,  MTF          vIMB Gap’s Power of 3 Equal High / Low’s  
This dashboard shows the latest available   harmonic patterns   for the selected symbols, so you will save time and be more efficient /   MT4 version . Free Indicator:   Basic Harmonic Pattern Comparison of "Basic Harmonic Pattern" vs. "Basic Harmonic Patterns Dashboard" Indicators Feature Basic Harmonic Pattern Basic Harmonic Patterns Dashboard Functionality Detects and displays harmonic patterns on a single chart Searches multiple symbols and timeframes for harmonic patterns, displays res
Black Dragon indicator mt5
Ramil Minniakhmetov
4.84 (61)
The trend detection indicator will compliment any strategy and can also be used as an independent tool. Be careful i not sell EA or sets at telegram it scam. All settings free here at   blog .  IMPORTANT! Contact me immediately after the purchase to get instructions and a bonus!  Benefits  Easy to use; does not overload the graphic wih unnecessary information. The ability to use as filter for any strategy. Contains bult -in dynamic levels of cupport and resistange,  which can be used both, for p
First of all Its worth emphasizing here that this Trading Tool is Non Repainting , Non Redrawing and Non Lagging Indicator , Which makes it ideal for professional trading . Online course, user manual and demo. The Smart Price Action Concepts Indicator is a very powerful tool for both new and experienced traders . It packs more than 20 useful indicators into one , combining advanced trading ideas like Inner Circle Trader Analysis and Smart Money Concepts Trading Strategies . This indicator focus
MetaBands M5
Vahidreza Heidar Gholami
4.5 (2)
MetaBands uses powerful and unique algorithms to draw channels and detect trends so that it can provide traders with potential points for entering and exiting trades. It’s a channel indicator plus a powerful trend indicator. It includes different types of channels which can be merged to create new channels simply by using the input parameters. MetaBands uses all types of alerts to notify users about market events. Features Supports most of the channel algorithms Powerful trend detection algorith
Introducing   Quantum Breakout PRO , the groundbreaking MQL5 Indicator that's transforming the way you trade Breakout Zones! Developed by a team of experienced traders with trading experience of over 13 years,   Quantum Breakout PRO   is designed to propel your trading journey to new heights with its innovative and dynamic breakout zone strategy. Quantum Breakout Indicator will give you signal arrows on breakout zones with 5 profit target zones and stop loss suggestion based on the breakout b
More from author
React Fibonacci Chart
Kim Yonghwa
4.91 (11)
Features Indicator for Fibonacci Retracement Trading A Fibonacci chart is drawn based on the previous bar selected among 1H, 4H, 1D, and 1W. When the market price touches the Fibonacci level, the color changes and the touch time is displayed. The Fibonacci graph is drawn at -23.6, 0, 23.6, 38.2, 50, 61.8, 76.4, 100, and 123.6 levels and the chart refreshes when the bar is updated. Variables Timeframe : A Fibonacci chart is drawn with the selected time frame among 1H, 4H, 1D, and 1W. FiboWid
FREE
Filter:
Irusel
484
Irusel 2024.10.29 21:32 
 

Отличный

ahmed fakhry
18
ahmed fakhry 2024.09.25 09:29 
 

nice

eugene.nz
411
eugene.nz 2024.07.21 05:00 
 

Looks good.

Thapa
81
Thapa 2024.06.13 10:17 
 

not bad

xlxAxlx
1463
xlxAxlx 2024.01.31 17:53 
 

Thank you...

ceseixas
66
ceseixas 2023.10.19 03:31 
 

Olá. Parece bem interessante o indicador. Mas não consigo fazê-lo aparecer na versão demo. Tentei no Mini dólar (WDO) e Mini índice (WIN) no gráfico de 5 minutos. Mas nem abre a tela de configuração. Tem alguma idéia ?

Kim Yonghwa
12180
Reply from developer Kim Yonghwa 2023.10.22 11:09
Obrigado pelo seu feedback. No entanto, é difícil implementar partes que não fornecem dados além das principais moedas ou têm formatos de dados únicos. Agradeço muito pela sua classificação.
Reply to review
Version 1.3 2023.09.02
chart shift in default
Version 1.2 2023.08.26
variable adjust
Version 1.1 2023.08.22
variable change